データ駆動の品質革命!ナレッジグラフ&生成AIでゲームを変える
Stardogナビン・シャルマとジョー・ピンデルとの共同執筆作品である。
業界を問わず、納品後の失敗に伴うコスト(リコール、保証請求、納品後の信用失墜など)の影響は甚大です。食品業界では、1件あたりの直接的なコストが1,000万ドルを超えることもあります。その影響は多面的で、売上の減少やブランドの評判へのダメージが伴います。ある推定によると、納品後の失敗による売上損失は、顧客1人あたりの平均収益の2,000倍以上に相当します。このような高リスクの状況で不十分な対応や遅いレスポンスが続くと、顧客は競合他社へと流れ、将来の成長を支える酸素を断たれることになります。そのため、品質の悪さによるコストは製造業にとって大きな財務負担であり、場合によっては運営コストの最大40%に達することもあります。
企業は品質問題の早期警告指標をもっと得たいと願っていますが、通常は顧客の苦情が増加した後に初めて問題を把握します。典型的な問題は次のようなものです:週末に顧客からの報告が急増し、製品の品質問題やブランドに対する不満が明らかになります。このような状況が発生すると、それはまさに火消し作業となります。顧客はもはや長い対応時間を受け入れることなく、このような問題に対する高い基準を要求しています。
Databricks と Stardog を使った新しい遊び方の開発
ほとんどの組織が知っているように、品質問題は通�常、単発の出来事ではありません。これらは繰り返し発生する問題であり、顧客のフィードバックを継続的に監視し、緊急の問題を優先し、迅速に解決するための再現可能なソリューションやシステムが必要です。品質問題に直面したとき、企業は問題の範囲や潜在的な二次的影響を深く理解し、製造プロセスやサプライチェーンの上流にある根本原因をよりよく理解して、将来の高額な問題を回避したいと考えます。
これには、異なるデータソースをすべて統合して、さまざまなデータ領域間の多くの相互接続を理解し、企業の知識ベースやシステムを発展させることが求められます。本日は、Stardogのナレッジグラフを活用した生成AIとDatabricksを組み合わせることで、製造業の組織が品質イベントのフォレンジックを実施し、問題を迅速に特定し、顧客の成果を向上させる力について紹介します。
Stardog Voiceboxは、工場、サプライヤー、生産プロセス、物流、製品ファミリー、SKUなどのビジネスオブジェクトに関連するデータを特定し、リンクさせることができます。このリンク機能により、製造やサプライチェーンのユースケースにおいて、より良い、より迅速な意思決定が可能になります。さらに、StardogプラットフォームはPartner Connectを介してDatabricksと統合され、Databricksを活用して大規模なデータ処理を行います。
DatabricksとStardogがどのようにして企業が品質問題をより適切に管理するためのエンドツーエンドの能力を構築するのを支援するかを説明するために、スポーツイベント中にさまざまなスタジアムにビールを供給するビール流通業者の例を取り上げます。注目度の高い試合で、同�社は多くのファンがビールが「気が抜けている」と感じているという報告を受け取り、それが一連の事象を引き起こします。
迅速な品質イベントフォレンジックの実行
品質の問題に関しては、時間は問題ではなく、データがサイロ化して分断されているわけでもありません。 製品品質の SME としては、適切なリソースを配備して当面の問題に対処し、重大な品質問題にすぐに対応できるように、状況をできるだけ早くトリアージする必要があります。
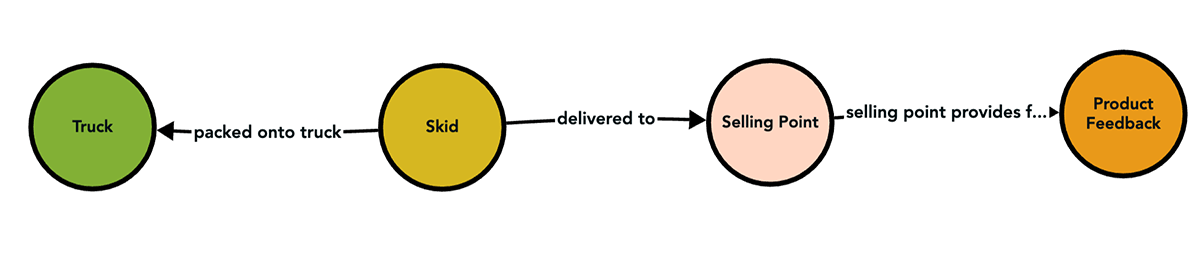
製品品質の中小企業として、私たちはまず否定的なフィードバックから始めて、そのフィードバックが何であるか、何についてのものであるか、どこから来たのかを理解します。 これには、製品のフィードバック、完成品、販売拠点、スタジアム、販売代理店、トラック、センサー、パレット、サプライヤーにわたる可視性が必要です。 これにより、さまざまなドメインとソースからのデータが統合されます。
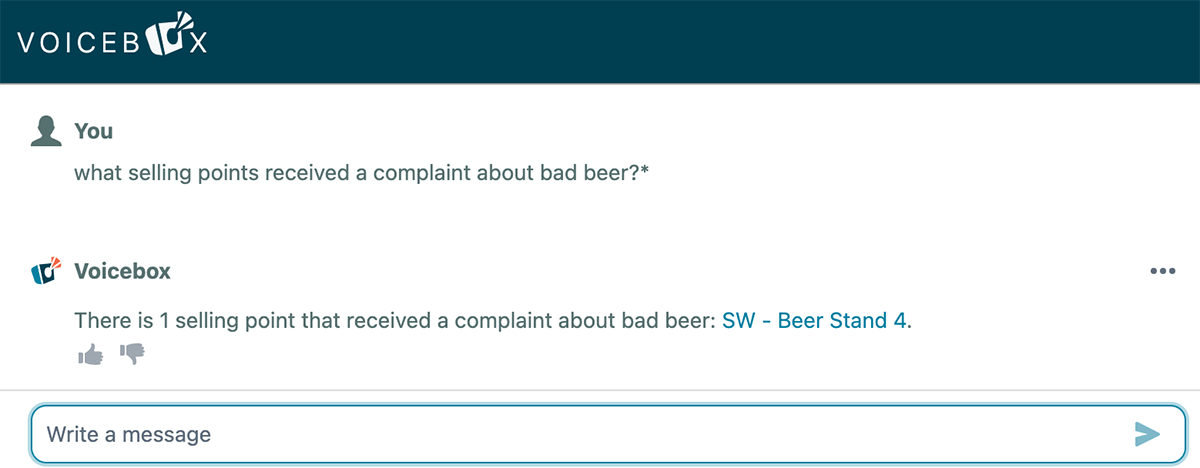
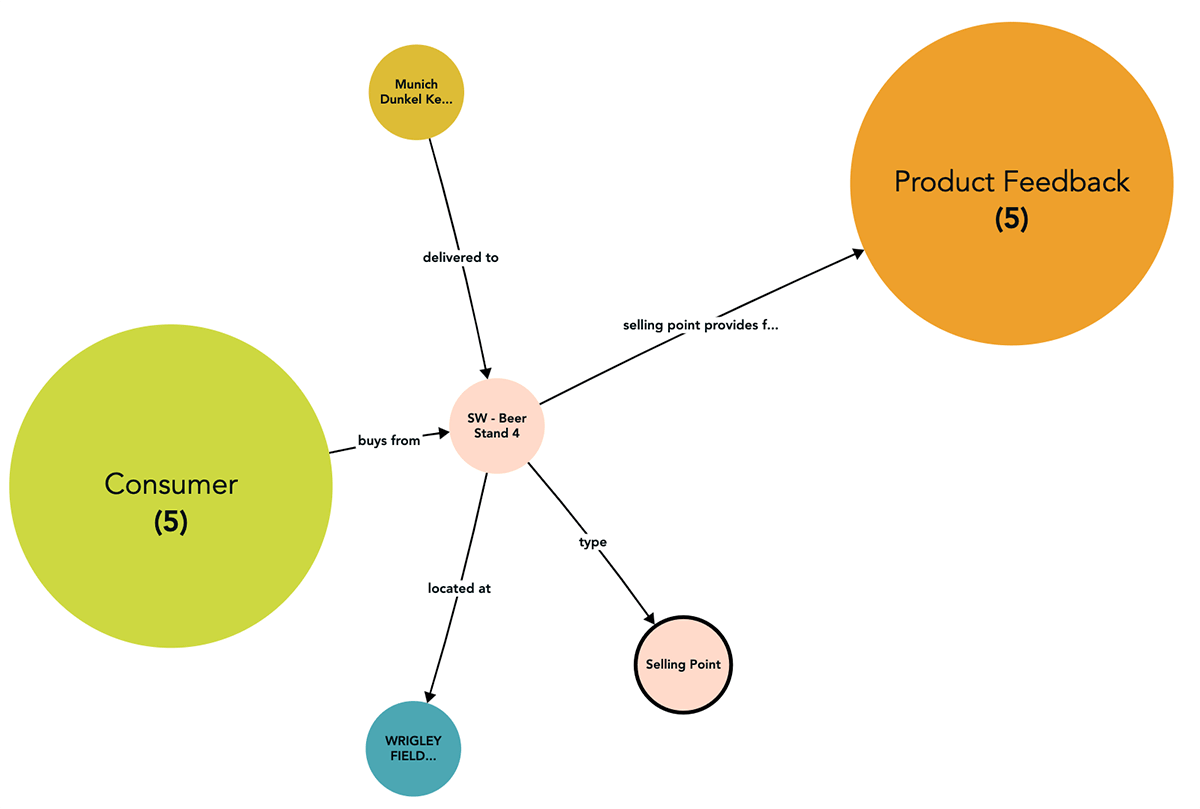
Stardogは、企業が柔軟かつ相互接続された方法でデータに接続し、クエリを実行できるようにするナレッジグラフ プラットフォームです。 これにより、顧客の問題を調査するために必要な情報をすばやく簡単に見つけることができるため、顧客および製品サポートに最適です。 これにより、他の顧客サポート エージェントは、基礎となるデータ構造に精通していなくても、顧客の問題を解決するために必要な情報を自然言語で簡単に見つけることができます。
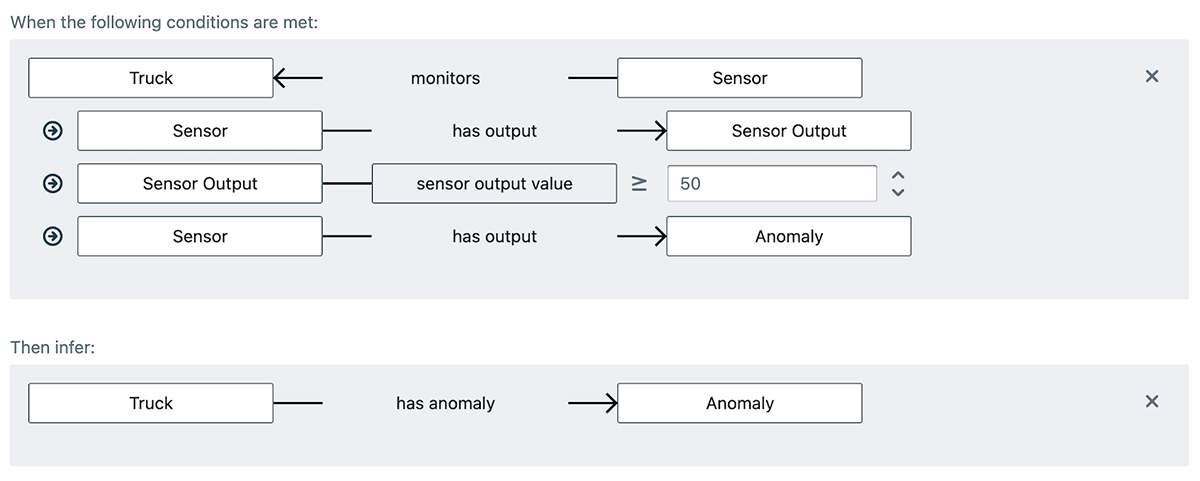
Stardog知識グラフのユニークな機能は、クエリ時にデータに適用されるルールを定義できることです。 推論により、Stardog の推論エンジンは関連情報を関連付けて新しい接続を推論できるようになります。 これらのルールでは、新しいデータは作成されませんが、実際のデータであるかのように操作できます。 以下の Anomaly の概念は、データ内のどこにも明示的に定義または保存されていないものです。 これは、ルールの定義済み条件が満たされた場合の暗黙的な出力です。
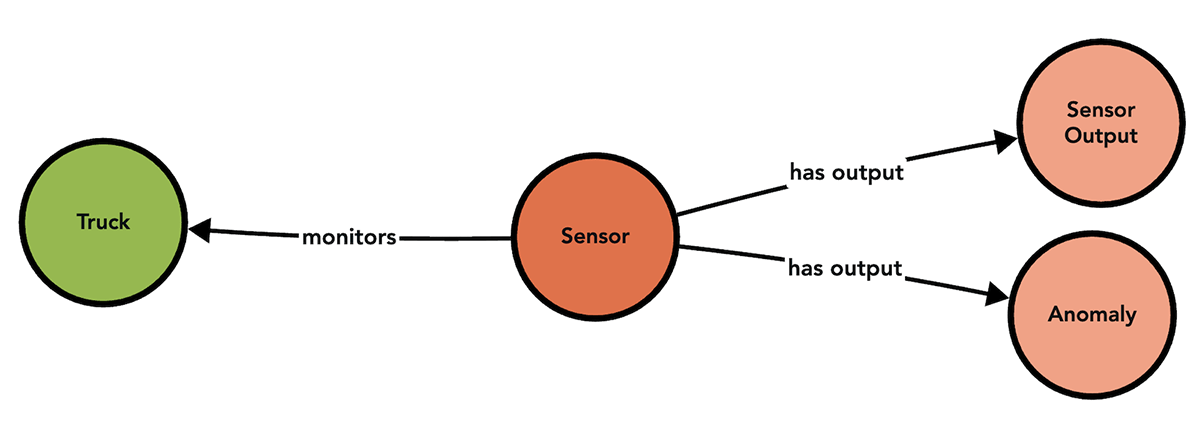
以下のルール定義を見てみましょう。 ご覧のとおり、いずれかのトラックに温度センサーが搭載されており、そのセンサー出力が華氏 50 度以上である場合、Stardog の推論エンジンは、そのトラックに異常が関連していると推論します。
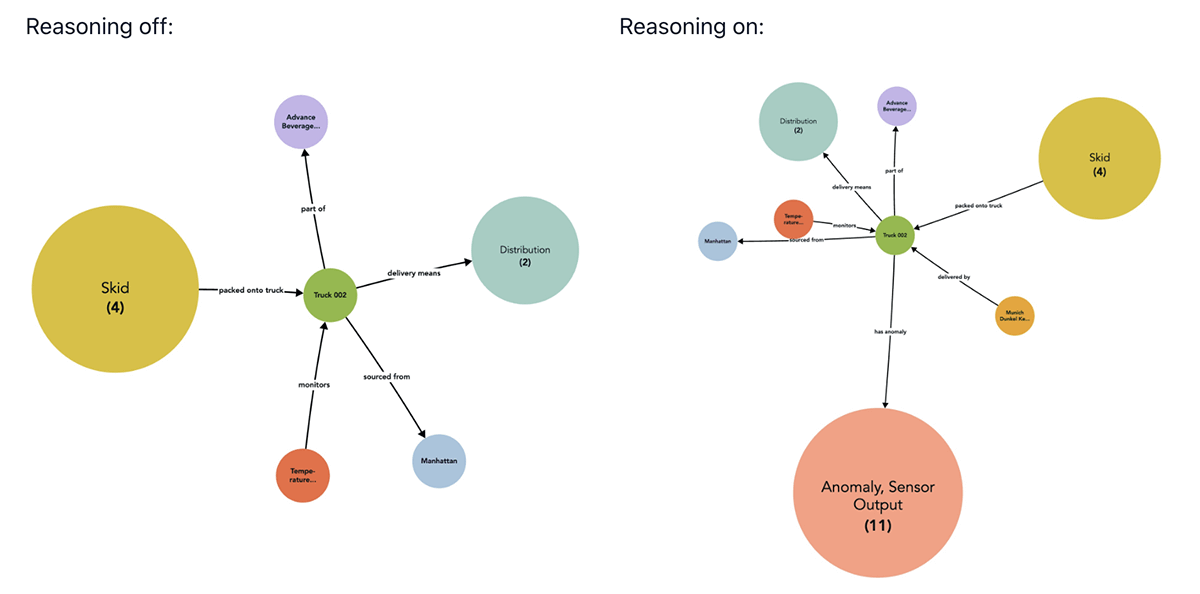
これらのデータ ショートカットは、製品品質にこだわる中小企業の調査を支援する上で非常に役立ちます。 たとえば、推論では、トラック 002 には華氏 50 度以上の 11 個の出力を持つ温度センサーがあるため、11 個の異常があると推論されます。 この発見により、製品品質 SME は、トラック上の温度差がビールの炭酸抜けの原因であったことを確認できます。 これは良い発見かもしれませんが、問題の全容を理解するためのさらに重要な問題への扉を開きます。
ブラスト半径の推定
地震が発生すると、通常は余震が続きますが、製品の品質問題の場合も同様です。 品質問題の潜在的な範囲の推定には、同じ製品の他のバッチ、類似製品、またはこの場合は関連する現場への潜在的な影響を評価することが含まれます。 問題の原因を特定の車両まで追跡したので、他の顧客に影響を与える可能性のある下流の影響を評価する必要があります。
トラック002をもう少し掘り下げて、他の場所に向かっているかどうかを確認しましょう。 Stardog Voicebox との簡単な会話から、トラック 002 が 2 つの配送先に予定されていることがわかります。
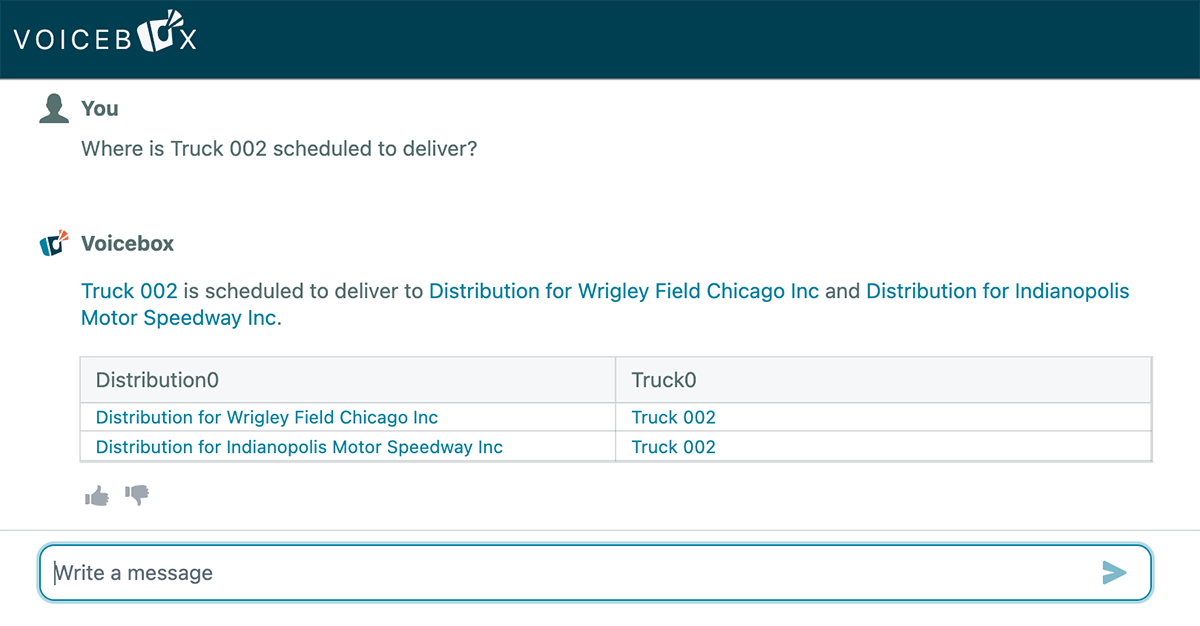
トラブルシュー��ティングから、元の苦情はリグレーフィールドから来ていることがわかっているため、インディアナポリスモータースピードウェイの担当者にフラットビールについて警告することに注意を向ける必要があります。 少なくとも、さらなる否定的な報告を防ぐために、提供前に製品を検査する必要があります。 万が一、品不足が発生した場合には、同じ製品を積んだ代替トラックを探したり、最悪の場合でもお客様にクーポンを提供したりすることも可能です。
関連する可能性のあるすべての状況を評価することで、企業は製品の問題の影響範囲を推定し、積極的に問題に対処するための決定を下すことができます。 これには、顧客への影響を最小限に抑えるための製品リコール、ソフトウェアの更新、製造プロセスの調整などの緩和戦略の実装が含まれる場合があります。
本番運用およびサプライチェーンの問題までのトレーサビリティ
本番運用とサプライ チェーンの問題まで遡ることは、問題を解決するための重要なステップです。 問題の根本原因を特定し、是正措置を講じることで、企業はより効果的なソリューションを開発し、問題の再発を防ぐことができます。 これには、品質を向上させるためにサプライヤーと協力したり、代替の供給源を見つけたり、本番運用プロセスに変更を加えたりすることが含まれる場合があります。
サプライチェーンの可視性は、エクスペリエンスと結果の向上を目指す製造組織にとって非常に重要ですが、現在、そこにいる組織は6%未満です。 LakeHouse アーキテクチャ上に構築されたDatabricksデータ インテリジェンス プラットフォームは、セマン��ティック レイヤーとしてStardogと組み合わせることで、企業がデータとデータ間の関係性をより密接に関連付けたビューを構築できるようにします。 これは、データセット全体にわたる包括的で接続されたビューを必要とする品質イベントのフォレンジックなど、サプライ チェーンの課題に対処する場合に非常に大きな利点となり、最終的には製造会社がデータドリブンの意思決定を推進できるようになります。
無料トライアル
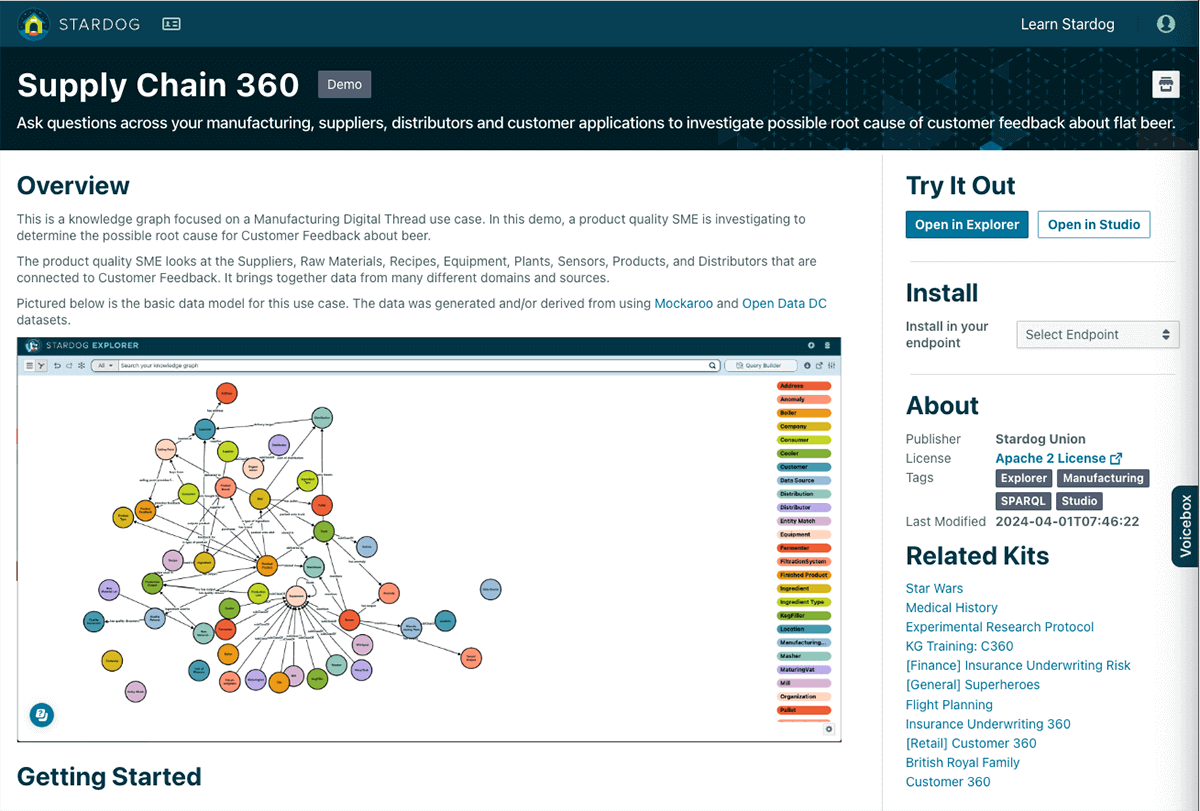
今すぐDatabricks Partner Connect Web サイトにアクセスして、Stardog の可能性を解き放ちましょう。 Stardog を Databricks に接続するには、Stardog のドキュメントに記載されている手順に従ってください。 接続すると、上記の例に従うために必要なものがすべて含まれた包括的なリソースであるSupply Chain 360 ナレッジ キットにアクセスできるようになります。
最新の投稿を受信トレイで受け取る
ブログを購読して、最新の�投稿を受信トレイにお届けします。