地理空間クラスタリングによる金融不正の識別

For most financial service institutions (FSI), fraud prevention often implies a complex ecosystem made of various components –- a mixture of traditional rules-based controls and artificial intelligence (AI) and a patchwork of on-premises systems, proprietary frameworks and open source cloud technologies. Combined with strict regulatory requirements (such as model explainability), high governance frameworks, low latency and high availability (sub second response time for card transactions), these systems are costly to operate, hard to maintain and even harder to adapt to customers changing behaviors and fraudsters alike. Similar to risk management, a modern fraud prevention strategy must be agile at its core and combines a collaborative data-centered operating model with an established delivery strategy of code, data and machine learning (ML) such as DataOps, DevOps and MLOps. In a previous solution accelerator, we addressed the problem of combining rules with AI in a common orchestration framework powered by MLflow.
消費生活のデジタル化に伴い、大手 FSI では、GPS 座標を活用して顧客の購買行動をリアルタイムに把握するケースが増えています。米国では毎年約 400 億件のカード決済トランザクションが行なわれており、リテールバンクでは、同意している顧客を対象に、バンキング業務のアプリケーション上のトランザクションの発生時に、行動把握のための GPS ベースのデータを取得しています。取得したデータは膨大で複雑であることから、従来のデータウェアハウスとリレーショナルデータベースを中心とした枠組みでは地理空間分析が困難な場合が多く、大容量のコンピューティングリソースと最新のライブラリの利用が必要となります。
この地理空間分析を中心に据えたソリューションでは、購買行動をする顧客の特定とその取引内容の把握が、データブリックスのレイクハウスプラットフォームによっていかに改善されるかを示します。画一的なベースモデルではなく、高度にパーソナライズされた AI を実装しています。異常なパターンを識別するには、まず正常な動作を把握する必要があります。何百万もの顧客を対象とするには、データと AI を単一プラットフォームに統合する必要がありました。
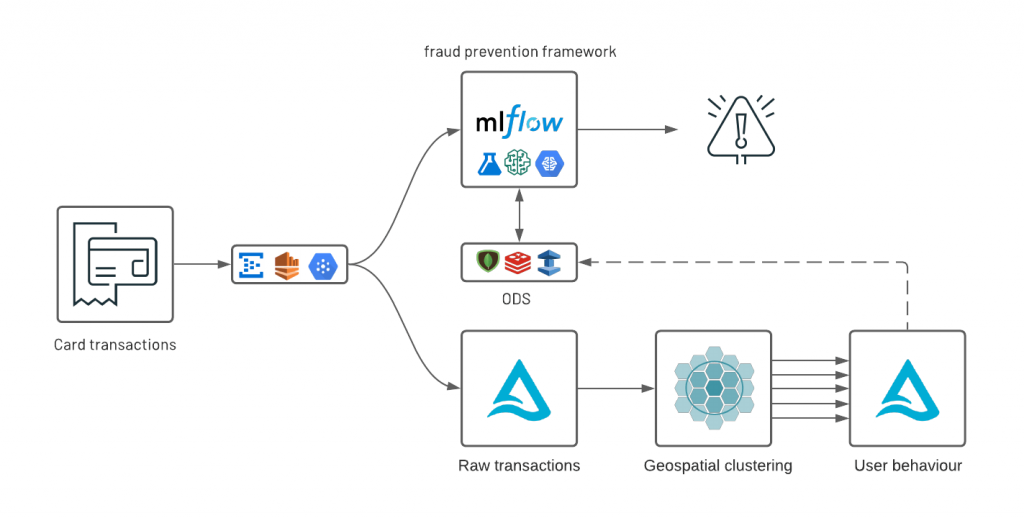
As part of this real-world solution, we are releasing a new open source geospatial library, GEOSCAN, to detect geospatial behaviors at massive scale, track customers patterns over time and detect anomalous card transactions. Finally, we demonstrate how organizations can surface anomalies from an analytics environment to an online data store (ODS) with tight SLA requirements following a Lambda-like infrastructure underpinned by Delta Lake, Apache Spark and MLflow.
カード決済トランザクションの地理空間クラスタリング
DBSCAN (density-based spatial clustering of applications with noise) is a common ML technique used to group points that are closely packed together. Compared to other clustering methodologies, it doesn’t require you to indicate the number of clusters beforehand, can detect clusters of varying shapes and sizes and effectively finds outliers that don’t belong in any dense area. This makes it a great candidate for geospatial analysis of credit card transactions and potentially fraudulent activities. However, it comes with a serious price tag: DBSCAN requires all points to be compared to every other point to find dense neighbourhoods, which is a significant limitation given the scale large FSIs operate at. As we could not find a viable solution that can scale to millions of customers or more than a few hundreds of thousands of records, we created our own open source AI library: GEOSCAN. Available with both Scala and Python APIs, GEOSCAN is our implementation of DBSCAN algorithm for geospatial clustering at big data scale.
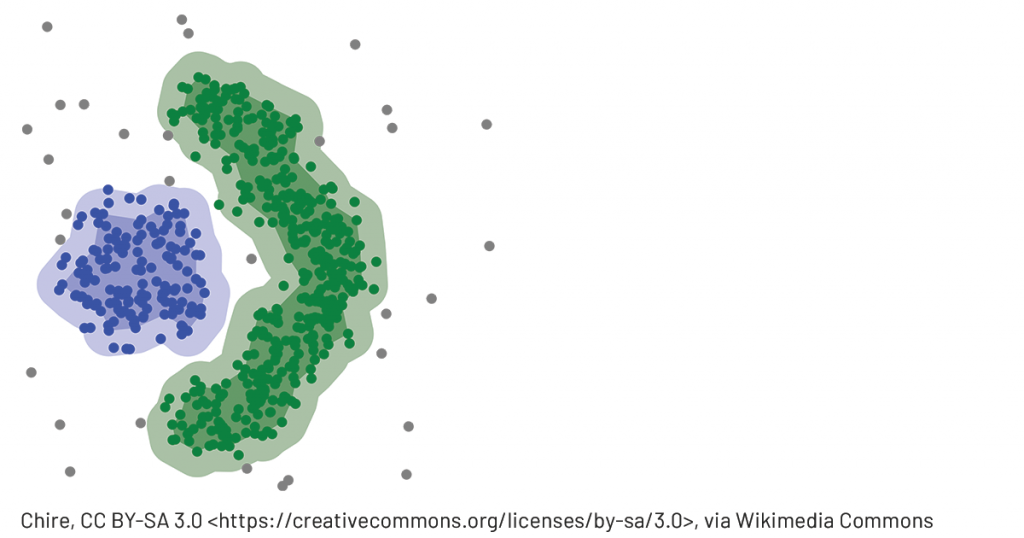
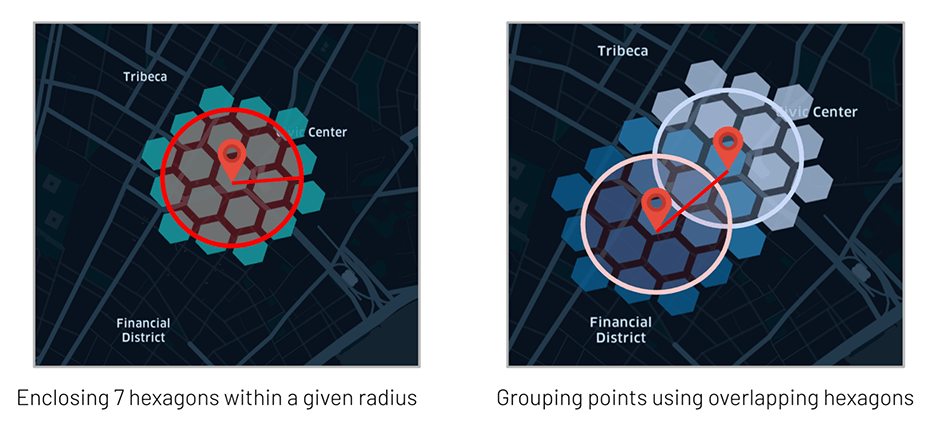
Leveraging Uber’s H3 library to only group points we know are in close vicinity (sharing at least one H3 polygon) and relying on GraphX API, this can detect dense areas at massive scale, understand user spending behaviors and detect anomalous transactions in near real time.
今回のフレームワークの検証を行うために、ニューヨーク市内におけるクレジットカード決済のトランザクションを模倣したデータセットを作成しました。データセットには、顧客のトークン化された値、地理空間座標(緯度と経度)、タイムスタンプとトランザクション量(amount)のみが含まれています。実際の同様のデータセットには、トランザクションに関するその他のコンテキスト情報(加盟店の説明や MCC コードなど)が含まれ、整理済みのブランド情報で補足されているはずです(後者については、今後のデータブリックスソリューションアクセラレータで取り扱う予定です)。今回のデモでは、大通りやショッピングモールなどのトランザクションアクティビティが集中するエリアに該当する高密度なクラスタを抽出します。
GEOSCAN の実装では 2 つのモードがサポートされています。分散モードと疑似分散モードです。
- 分散モード:データフレーム全体(全てのユーザーベース)からクラスタを検知。
- 疑似分散モード:プレディケート(叙述関数)をグループ化してクラスタを取得するため、膨大な数の顧客に対応する膨大な数のモデルの並行トレーニングが可能。
いずれのモードも、顧客の購買行動の詳細を把握するうえで有用であり、不正防止のパーソナライズ戦略に役立ちます。
買い物客が集中する地域の検出
GEOSCAN の中核となるアルゴリズムは、完全な分散モードで働き、GraphX により distance < epsilon (メートル単位)で、かつ neighbors > minPoints となるポイントを検出します。
As a strong advocate of open standard, we built GEOSCAN to support RFC7946 (aka GeoJSON) as a model output that can be processed as-is with any geospatial library (such as geopandas), GIS database (geomesa) or visualization (folium). As represented below, MLflow natively supports the use of GeoJSON as a model artifact.
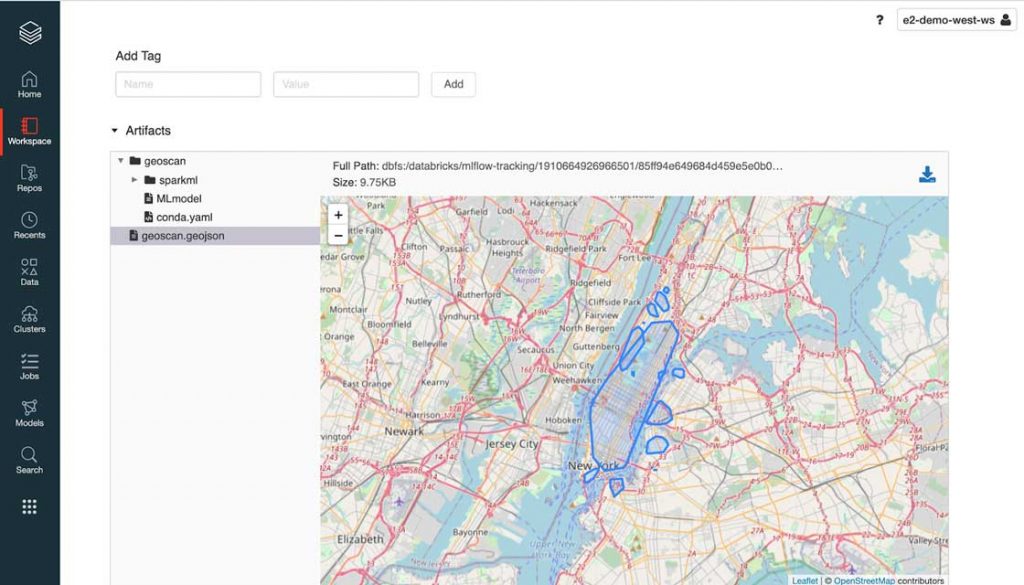
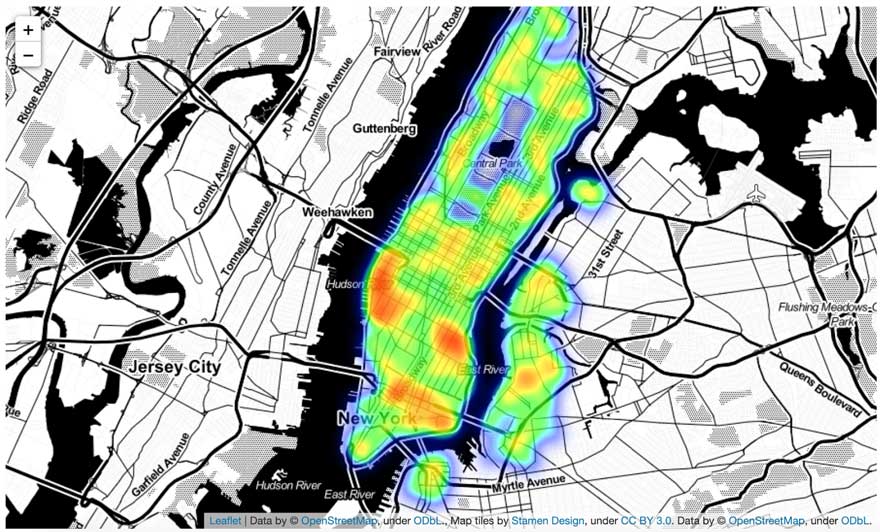
では、GEOSCAN の実際のサンプルについて確認しましょう。このソリューションでは、ニューヨーク市(NYC)の市域内でカード決済トランザクションが集中している地域に該当する地理空間図形をプログラムで抽出します。上の図で示されているように、この時点のパラメータ設定では、NY 市のほぼ全域を囲む比較的大きな図形が描かれています。minPoints の値を減らすか epsilon の値を増やせば図形を精緻化することはできますが、その場合、ブルックリンのウィリアムズバーグのような密度の小さな地域が影響を受ける可能性があります。この点については、主に個別の領域に特化して、本ブログの最後にある Notebook でモデルの調整とパフォーマンスの改善を行う別のアプローチについて解説します。
モデル推論とクラスタタイリング
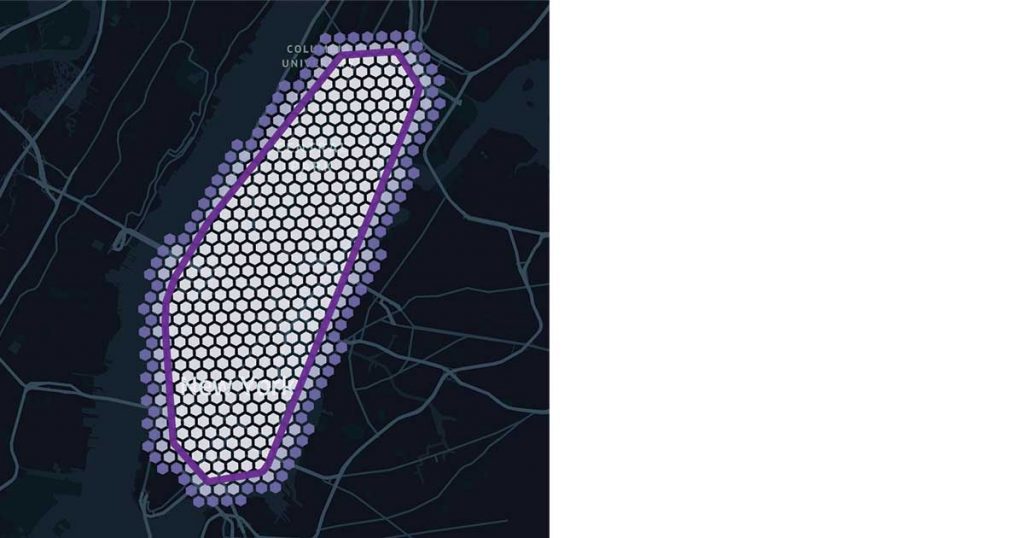
As the core of GEOSCAN logic relies on the use of H3 polygons, it becomes natural to leverage the same for model inference instead of bringing in extra GIS dependencies for expensive points in polygons queries. Our approach consists in “tiling” our clusters with H3 hexagons that can easily be joined to our original dataframe, exploiting at best Delta Lake optimizations (such as ZORDER indexing) and offering complex geospatial queries as a form of a simple SQL operation.
パーソナライズされたクラスタリング
We have demonstrated how GEOSCAN can be used across our entire dataset. However, the aim was not to machine learn the shape of NYC, nor to find the best place to go shopping, but to track user spending behaviour over time and – most importantly – where transactions are the least expected to happen for a given customer, therefore requiring a personalized approach to geospatial clustering.
上述の分散型アプローチと同様に、モデルの格納と取得は標準の Spark ML API に沿って行われます。このモードでは、GeoJSON オブジェクトで構成されたデータフレームが返されます。地理空間上での顧客の購買パターンを、顧客��ごとに単一ファイルに記録する形式ではありません。
顧客固有のパターンを把握
It is important to step back and reflect on the insights gained so far. As we learn more about our entire customer base (distributed approach), we could leverage this information to better understand the behaviour that is specific to each individual. If everyone were to shop at the same location, such an area would be less specific to a particular user. We can detect “personalized” zones as how much they overlap with common areas, better understanding our end customers and pave the way towards truly personalized banking.
個々の顧客について最も限定的な情報が得られる領域を検出することは、自然言語処理のユースケースで個々の文章について最も限定的に説明できるキーワードを検出することと似ています。そこで、TF-IDF(Term Frequency / Inverse Document Frequency:単語の出現頻度 / 逆文書頻度)アプローチを使用して、ある顧客に固有の場所については重み付けを増し、複数の顧客に共通の場所については重み付けを減らすようにしました。
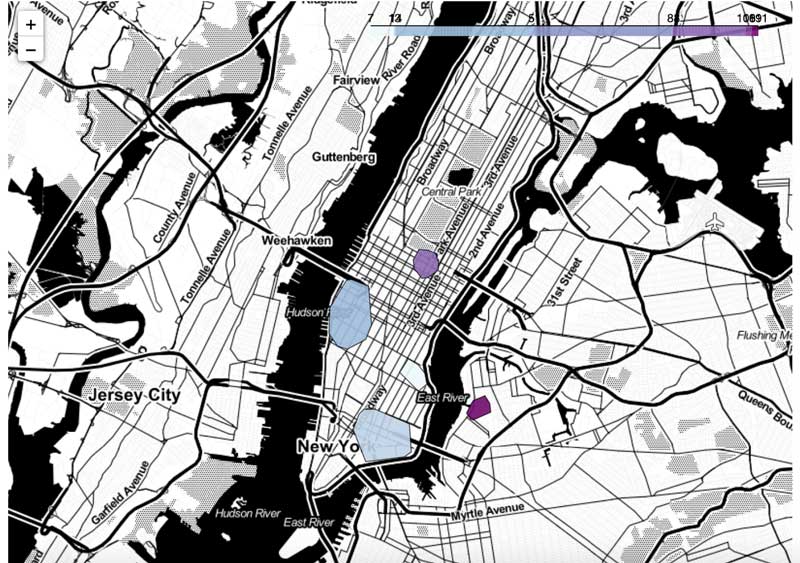
We suddenly have gained incredible insights about our customers’ shopping behaviour. Although the core of this user’s transactions are made in the Chelsea and financial district areas of NYC, what seems to better define this user are their transactions around the Plaza Hotel on the 5th avenue and Williamsburg. Given a specific user and a location, this framework can be used to better understand whether a card transaction falls within a known shopping pattern at a specific time of day or day of the week.
パーソナライズされた AI による不正防止対策
前項では、地理空間データ分析により顧客の行動と傾向について多くの情報が得られることを示しました。この情報は、地理空間上に広く網をかけて異常を検出するオーバーハッチング不正防止戦略モデルにおいて極めて重要な要素となります。ここでは、これらの知見を使用して、疑わしい行動をリアルタイムで検出する方法をを解説します。多くの場合、不正検出システムは、データの機密性(PII)、規制要件(PCI/DSS)、モデルの優先項目(高 SLA と低遅延)などの理由から、分析環境とは別の場所で稼働します。このような背景をふまえ、知見を提供するための複数の戦略について調査しました。多くの実行可能なソリューションがある中で、今回は MLflow を使用した自己完結型フレームワークや、Redis、MongoDB、Redshift、ElastiCache などのリレーショナル/NoSQL オンラインデータストアの採用を検討しました。
異常の抽出
Since we have stored and indexed all of our personalized ML models as H3 polygons in a Delta table, it becomes easy to enrich each transaction with their cluster using a simple JOIN operation. In the example below, we can extract anomalies (transactions not matching any known pattern of a given user) given a specific H3 resolution (see resolution table) embedded in a user defined function.
Out of half a million transactions, we extracted 81 records in less than 5 seconds. Not necessarily fraudulent, maybe not even suspicious, but these transactions did not match any of our users’ “normal” behaviors, and as such, should be flagged as part of an over-hatching fraud prevention framework and further combined with other rules and models. In a real-life example, we should factor for time and additional transactional context. Would the same transaction happening on a Sunday afternoon or a Wednesday morning be suspicious given user characteristics we could learn?
With millions of transactions and low latency requirements, it would not be realistic to join these large datasets in real time. Although we could load all clusters (their H3 tiles) in memory, we may have evaluated multiple models at different time of the days, for different segments, different transaction indicators (e.g. for different brand category or MCC codes) and for millions of consumers resulting in a complex system that requires efficient lookup strategies against millions of variables.
ブルームフィルタの使用
Here comes Bloom filters, an efficient probabilistic data structure that can test the existence of a given record without keeping an entire set in memory. Although Bloom filters have been around for a long time, its usage has not – sadly – been democratized beyond blurry engineering techniques such as database optimization engines and daunting execution planners (Delta engine leverages Bloom filters optimizations under the hood, among other techniques). This technique is a powerful tool worth having in a modern data science toolkit.
ブルームフィルタの基本となる仕組みは、ひと続きのレコード�を一連のハッシュ値に変換することです。1 と 0 の一次元配列として表現されたバイト配列のそれぞれが重なり合う構造をとり、今回のケースであれば、カード決済トランザクションの発生場所を示すH3 ポリゴンがひと続きのレコードに該当します。指定のレコードが存在するかどうかは、レコードの各ビットが 1 になっているかで判定されます。ただ、ブルームフィルタのメモリ効率は、不正検出に利用するには十分ではありません。また、偽陰性は一切生じませんが一定の確率で擬陽性が発生します。ハッシュの衝突により誤って陽性とみなされる可能性がありますが、これは配列の長さとハッシュ関数の数で制御可能です。
このアプローチの検証には Python ライブラリ pybloomfilter を使用し、既知の各 H3 タイルの全てに対して特定の顧客ごとにブルームフィルタのトレーニングを行いました。理論上、フィルタには数百万単位のレコードが含まれますが、確率的な検索を有効にするうえで実際に管理する必要があるのはメモリ内の 1 バイト配列のみです。実行時間を短縮するためには、異常なトランザクションの 1% については擬陽性が発生することを受容する必要があります。
特定のカード決済が発生している場所があるか(範囲内にあるか)を、非常に短時間で確認できます。
In the notebooks listed in this blog, we demonstrate how data scientists can embed that business logic as an MLflow experiment that can be further delivered to a batch or stream processing or to external APIs with higher throughput requirements (see MLflow deployments).
ただし、このアプローチは、大規模な金融サービス機関に対しては重要な運用上の課題を投げかけます。新しいモデルでは、顧客行動の変化に対応するために常に再トレーニングと再配置を行う必要があるのです。
Let’s take an example of a user going on holidays. Although their first card transactions may be returned as anomalous (not necessarily suspicious), such a strategy would need to adapt and learn the new “normal” as more and more transactions are observed. One would need to run the same process with new training data, resulting in a new version of a model being released, reviewed by an independent team of experts, approved by a governance entity and eventually updated to a fraud production endpoint outside of any change freeze. Technically possible and definitely made easier with Databricks due to the platform’s collaborative approach to data management, this approach may not be viable for many.
オンラインデータストア
It is fairly common for financial services institutions to have an online data store decoupled from an analytics platform. A real-time flow of incoming card transactions usually accessed from an enterprise message broker such as Kafka, Event Hub (Azure) or Kinesis (AWS) are compared with reference data points in real time. An alternative approach to the above is to use an online datastore (like MongoDB) to keep “pushing” reference data points to a live endpoint as a business as usual process (hence outside of ITSM change windows). Any incoming transaction would be matched against a set of rules constantly updated and accessible via sub-seconds look up queries. Using MongoDB connector (as an example), we show how organizations can save our geo clusters dataframes for real-time serving, combining the predictive power of advanced analytics with low latency and explainability of traditional rules-based systems.
上の例では、クレジットカード利用者ごとの新しいリファレンスデータ(カード決済トランザクションの H3 ロケーション)を、一定の時間間隔で MongoDB のコレクション(テーブル)に追加しています。このようにすることで、新しいトランザクションと MongoDB に格納された時系列のリファレンスデータを、シンプルなリクエストで比較できます。特定のユーザーと H3 ポリゴンによるトランザクションロケーションについて、既知の顧客のパターンに一致するかどうかが判別されます。
As part of this solution, we want to leverage another built-in capability of MongoDB: Time to Live (TTL). Besides the operation benefits of not having to maintain this collection (records are purged after TTL expires), we can bring a temporal dimension to our model in order to cope with users changing patterns. With a TTL of 1 week (for example) and a new model trained on Databricks every day, we can track clusters over time while dynamically adapting our fraud strategy as new transactions are being observed, purposely drifting our model to follow users’ changing behaviors.
Example of how change in customers’ transactional behaviors could be tracked over time
In the visualization above, we show an example of how change in customers’ transactional behaviors could be tracked over time (thanks to our TTL on MongoDB in real time and / or time travel functionality on Delta), where any observed location stays active for a period of X days and wherein anomalous transactions can be detected in real time.
まとめ:地理空間分析で顧客中心のバンキングを実現
Card fraud transactions will never be addressed by a one-size-fits-all model but should always contextualize isolated indicators coming from different controls as part of an over-hatching fraud prevention strategy. Often, this combines advanced modeling techniques (such as neural networks) with rules-based systems, integrates advanced technologies and legacy processes, cloud-based infrastructures and on-premises systems, and must comply with tight regulatory requirements and critical SLAs. Although this solution does not aim at identifying fraudulent transactions on its own, we demonstrated through the release of a new open source library, GEOSCAN, how geospatial analytics can greatly contribute to extracting anomalous events in a timely, cost-effective (self maintained) and fully-explainable manner, hence a great candidate to combat financial fraud more effectively in a coordinated rules + AI strategy.
なお、今回の試みの中で、金融サービスにとって不正対策と同程度に重要なことを発見しました。レイクハウスインフラストラクチャを活用することで、顧客の属性でセグメント化するのではなく、購買パターンでセグメント化できることが示されたのです。つまり、従来のバンキングからパーソナライズされたバンキングに移行し、顧客中心の包括的なリテールバンキングをさらに推進するための方策が得られたことになります。
まずはここから
Check out the solution accelerator and try these notebooks on Databricks to accelerate your fraud prevention development strategy today and contact us to learn more about how we assist customers with similar use cases.
