Data Quality Monitoring at scale with Agentic AI
Built on Unity Catalog to detect issues early and resolve them quickly
• Manual, rule-based data quality does not scale as data estates grow for analytics and AI.
• Agentic data quality monitoring learns expected data patterns and detects issues across critical datasets.
• Platform-native signals like Unity Catalog lineage help teams resolve issues faster at enterprise scale.
Why is data quality hard to maintain at scale?
As organizations build more data and AI products, maintaining data quality becomes harder. Data powers everything– from executive dashboards to company-wide Q&A bots. A stale table leads to outdated or even incorrect answers, directly affecting business outcomes.
Most data quality approaches do not scale to this reality. Data teams rely on manually defined rules applied to a small set of tables. As data estates grow, they create blind spots and limit visibility into overall health.
Teams continuously add new tables, each with its own data patterns. Maintaining custom checks for every dataset is not sustainable. In practice, only a handful of critical tables are monitored while most of the estate remains unchecked.
The result is organizations have more data than ever, but less confidence to use it.
What is Data Quality Monitoring on Databricks?
Today, Databricks announces the Public Preview of Data Quality Monitoring on AWS, Azure Databricks, and GCP.
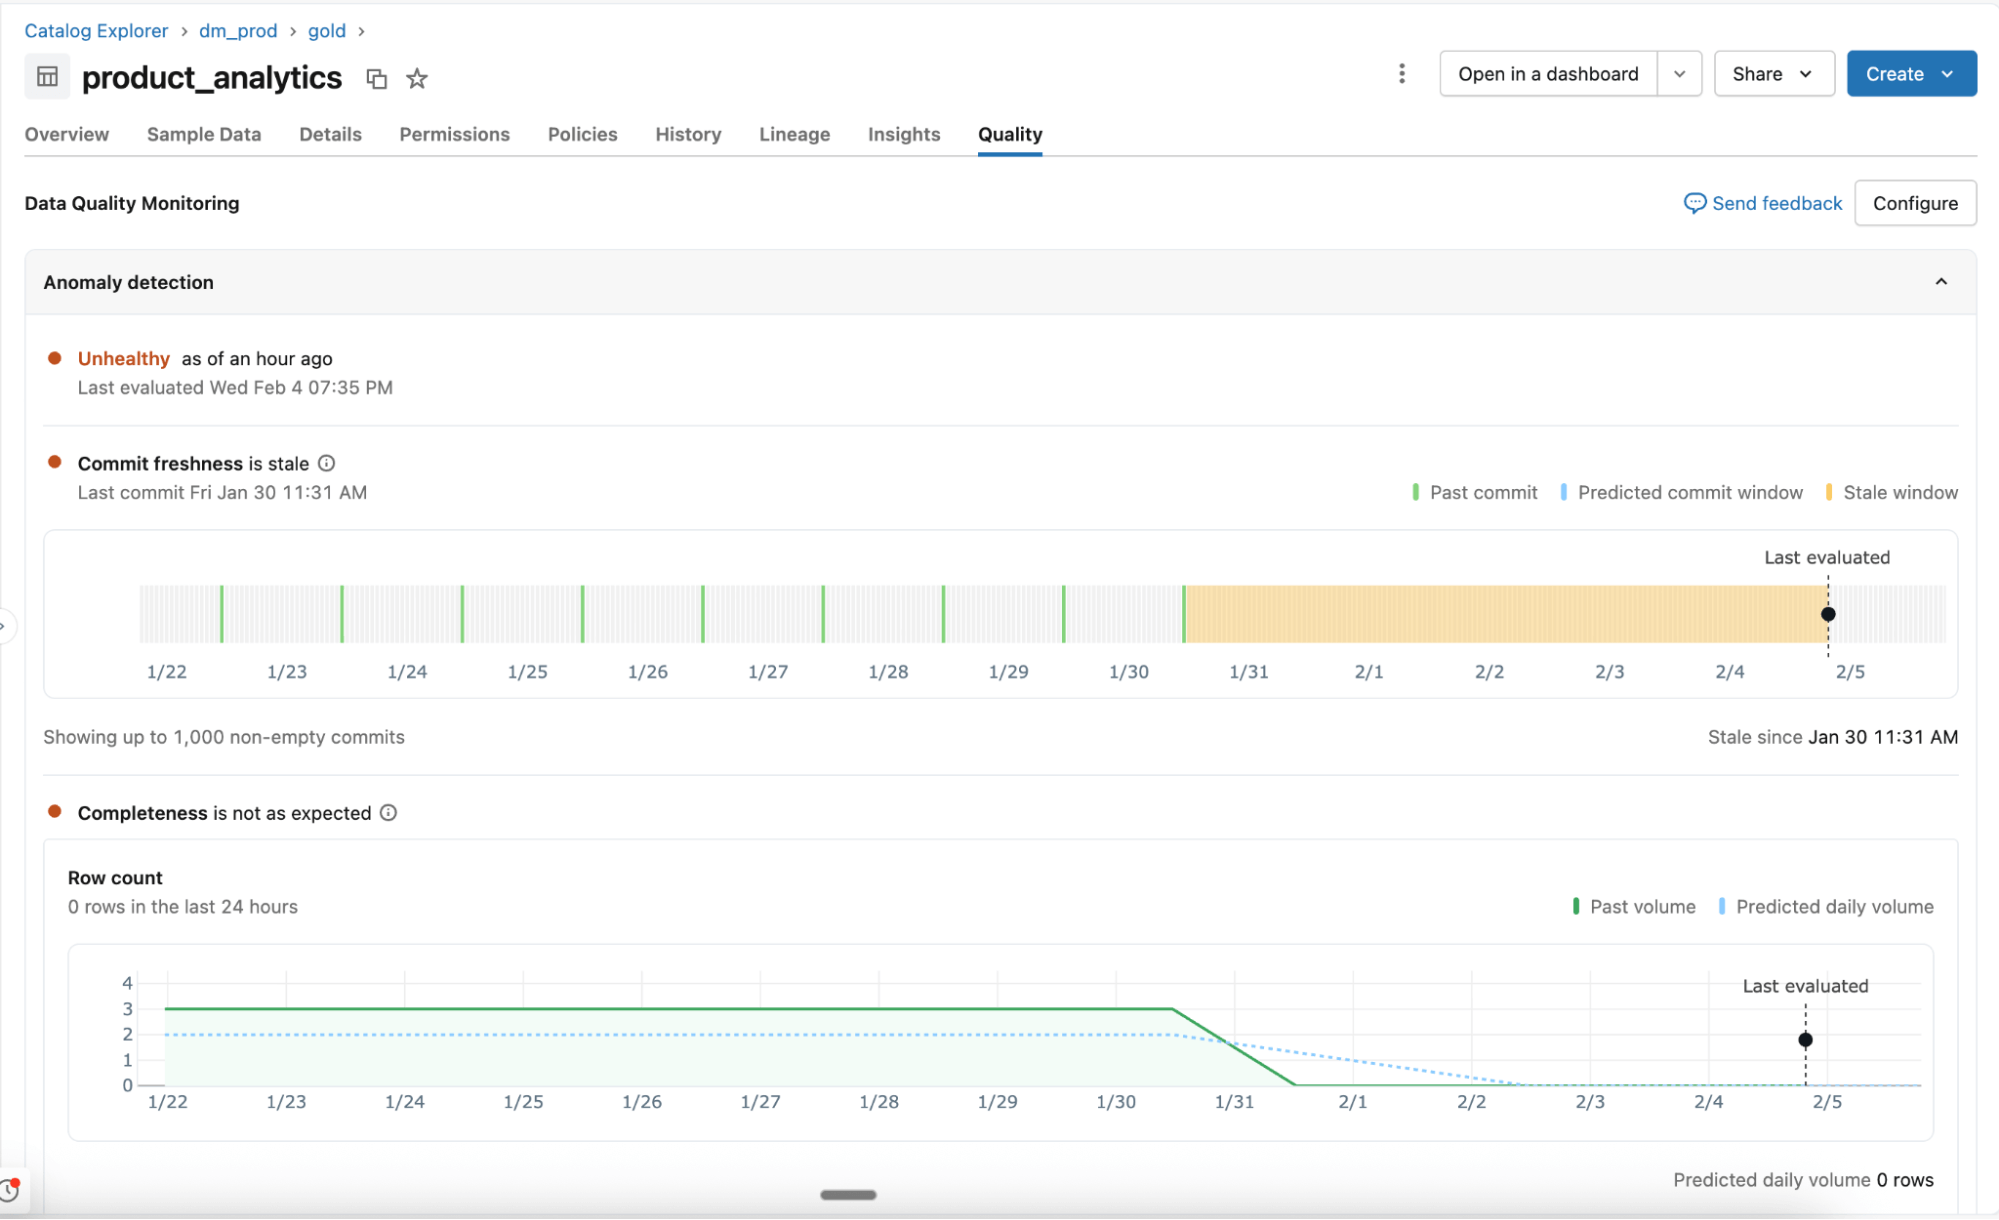
Data quality monitoring replaces fragmented, manual checks with an agentic approach built for scale. Instead of static thresholds, AI agents learn normal data patterns, adapt to change, and monitor the data estate continuously.
Deep integration with the Databricks Data + AI Platform enables more than detection.
- Root cause is surfaced directly in upstream Lakeflow jobs and pipelines. Teams can jump from Data quality monitoring into the affected job and leverage Lakeflow’s built-in observability capabilities to get deeper context on failures and resolve issues faster.
- Issues are prioritized using Unity Catalog lineage and certified tags, ensuring high-impact datasets are addressed first.
With platform-native monitoring, teams detect issues earlier, focus on what matters most, and resolve problems faster at enterprise scale.
“Our goal has always been for our data to tell us when there is a problem. Databricks' Data Quality Monitoring finally does that through its AI-driven approach. It's integrated seamlessly into the UI, monitoring all our tables with a hands-off, no-configuration approach which was always a limiting factor with other products. Instead of users reporting issues, our data flags it first, improving the quality, trust and integrity in our platform.” —Jake Roussis, Lead Data engineer at Alinta Energy
How does Data Quality Monitoring work?
Data quality monitoring delivers actionable insights through two complementary methods.
How does anomaly detection work in Data Quality Monitoring?
Enabled at the schema level, anomaly detection monitors all critical tables without manual configuration. AI agents learn historical patterns and seasonal behavior to identify unexpected changes.
- Learned behavior, not static rules: Agents adapt to normal variation and monitor key quality signals such as freshness and completeness. Support for additional checks, including percent nulls, uniqueness, and validity, is coming next.
- Intelligent scanning for scale: All tables in a schema are scanned once, then revisited based on table importance and update frequency. Unity Catalog lineage and certification determine which tables matter most. Frequently used tables are scanned more often, while static or deprecated tables are skipped automatically.
- System tables for visibility and reporting: Table health, learned thresholds, and observed patterns are recorded in system tables. Teams use this data for alerting, reporting, and deeper analysis.
What does data profiling do in Data Quality Monitoring?
Enabled at the table level, data profiling captures summary statistics and tracks their changes over time. These metrics provide historical context and will be provided to anomaly detection so you can catch issues easily.
“At OnePay, our mission is to help people achieve financial progress - empowering them to save, spend, borrow, and grow their money. High-quality data across all our datasets is critical to delivering on that mission. With Data Quality Monitoring, we can catch issues early and take swift action. We're able to ensure accuracy in our analytics, reporting, and development of robust ML models, all of which contributes to us serving our customers better.” —Nameet Pai, Head of Platform & Data Engineering at OnePay
How does Data Quality Monitoring help manage a growing data estate?
With automated quality monitoring in place, data platform teams can keep a pulse on the overall health of their data and ensure timely resolution of any issues.
Agentic, one-click monitoring: Monitor entire schemas without manual rule writing and threshold configuration. Data quality monitoring learns historical patterns and seasonal behaviors (e.g., dips in volume on the weekends, tax season, etc.) to intelligently detect anomalies across all your tables.
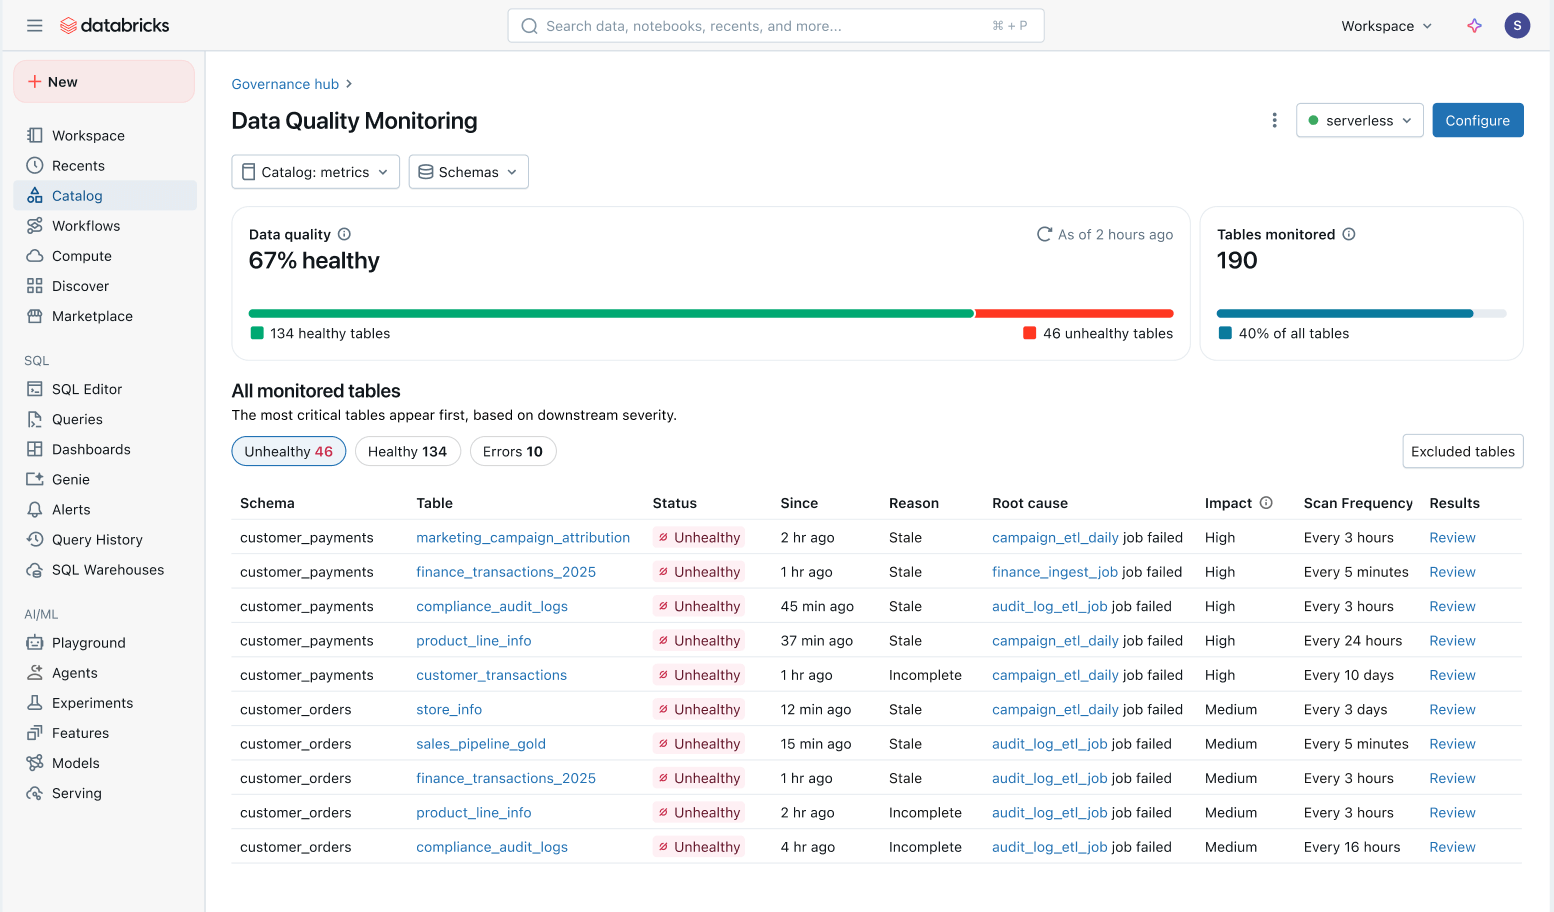
Holistic view of data health: Easily track the health of all tables in a consolidated view and ensure issues get fixed.
- Issues prioritized by downstream impact: All tables are prioritized based on their downstream lineage and query volume. Quality issues on your most important tables are flagged first.
- Faster time to resolution: In Unity Catalog, Data quality monitoring traces issues directly to upstream Lakeflow Jobs and Spark Declarative Pipelines. Teams can jump from the catalog into the affected job to investigate specific failures, code changes, and other root causes.
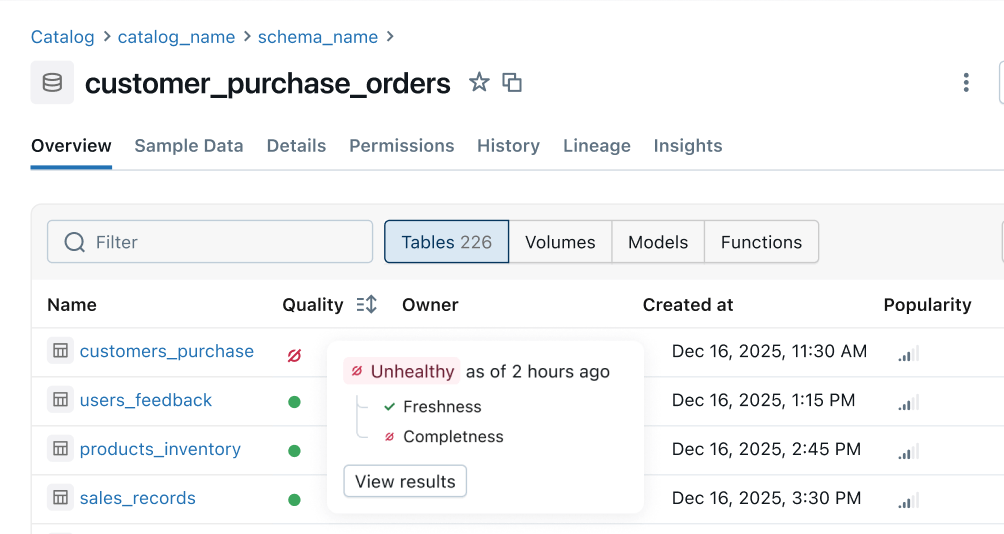
Health Indicator: Consistent quality signals are populated from upstream pipelines to downstream business surfaces. Data engineering teams are notified of issues first and consumers can instantly tell if data is safe to use.
What’s next on the Data Quality Monitoring roadmap?
Here's what's on our roadmap in the coming months:
- More quality rules: Support for more checks like percent null, uniqueness, and validity.
- Automated alerts and root cause analysis: Automatically receive alerts and quickly resolve issues with intelligent root cause pointers built directly into your jobs and pipelines.
- Health indicator across the platform: See consistent health signals across Unity Catalog, Lakeflow Observability, Lineage, Notebooks, Genie, etc.
- Filter and quarantine bad data: Proactively identify bad data and prevent it from reaching consumers.
How do you get started with Data Quality Monitoring in Public Preview?
Experience intelligent monitoring at scale and build a trusted, self-serve data platform. Try Public Preview today:
- Enable Data Quality Monitoring from the Schema Details tab in Unity Catalog
- Get a holistic view of all monitored tables directly in-product.
- Configure alerts with this template
Frequently Asked Questions
Which cloud platforms currently support Data Quality Monitoring?
Databricks has announced the Public Preview of Data Quality Monitoring on AWS, Azure Databricks, and GCP. This means teams on any of the three major clouds can enable schema-level anomaly detection and table-level data profiling during the preview period.
How has Alinta Energy benefited from Data Quality Monitoring?
According to Jake Roussis, Lead Data engineer at Alinta Energy, the AI-driven approach lets their data flag problems automatically instead of relying on users to report issues first. He noted that it's integrated seamlessly into the UI and monitors all their tables with a hands-off, no-configuration approach, which improves the quality, trust, and integrity of their platform.
What is the Health Indicator feature in Data Quality Monitoring?
The Health Indicator is a consistent quality signal that flows from upstream pipelines to downstream business surfaces so anyone looking at a table can quickly judge whether it's reliable. Data engineering teams are notified of issues first, while downstream consumers can instantly tell if the data is safe to use. On the roadmap, Databricks plans to extend this same health signal across Unity Catalog, Lakeflow Observability, Lineage, Notebooks, and Genie.
Where can teams find historical data quality metrics for reporting?
As part of anomaly detection, table health, learned thresholds, and observed patterns are recorded in system tables. Teams can query this system table data for alerting, reporting, and deeper analysis of quality trends over time, without needing to build separate tracking infrastructure.
How can teams set up alerts for data quality issues?
Teams can configure alerts using the alerting template provided as part of the Public Preview getting-started resources. This template ties notifications to the quality signals generated by anomaly detection and data profiling, so teams can act quickly when a table's health changes. Fully automated alerts with built-in root cause pointers are also planned as a near-term roadmap addition.
Get the latest posts in your inbox
Subscribe to our blog and get the latest posts delivered to your inbox.