A practical approach to end-to-end Solvency II reporting in Databricks
See how a governed workflow connects ingestion, controls, reporting, and scenario analysis
by Laurence Ryszka and Jack Yallop
- Solvency II is an end-to-end insurance reporting process spanning data ingestion, reserving, capital calculation, governance, and disclosure.
- Fragmented systems, data sources, and teams make it difficult to monitor reporting readiness, investigate issues, and answer scenario questions quickly.
- The demo shows how a connected workflow in Databricks can provide one control view, governed automation, AI-assisted review, and faster scenario analysis.
Solvency II reporting is not only a regulatory submission. It is a business process that connects data, models, controls, approvals, and narrative across an insurer.
Solvency II is the EU's risk-based regulatory framework for insurance capital, governance, and disclosure (retained in the UK as Solvency UK). It requires insurers to assess and communicate their financial position through data, models, controls, approvals, the own risk and solvency assessment (ORSA), and regulatory disclosure to demonstrate they can meet obligations to policyholders.
In practice, Solvency II reporting is an end-to-end business process that connects data ingestion, actuarial reserving, capital calculation, quantitative reporting templates (QRTs), the ORSA, governance approvals, and disclosure, all against strict regulatory deadlines.
The challenge is that the process is often distributed across many systems, teams, data sources, and locations. When those parts are only loosely connected, it becomes difficult to maintain one governed view of the reporting cycle, or to answer a business question that cuts across it.
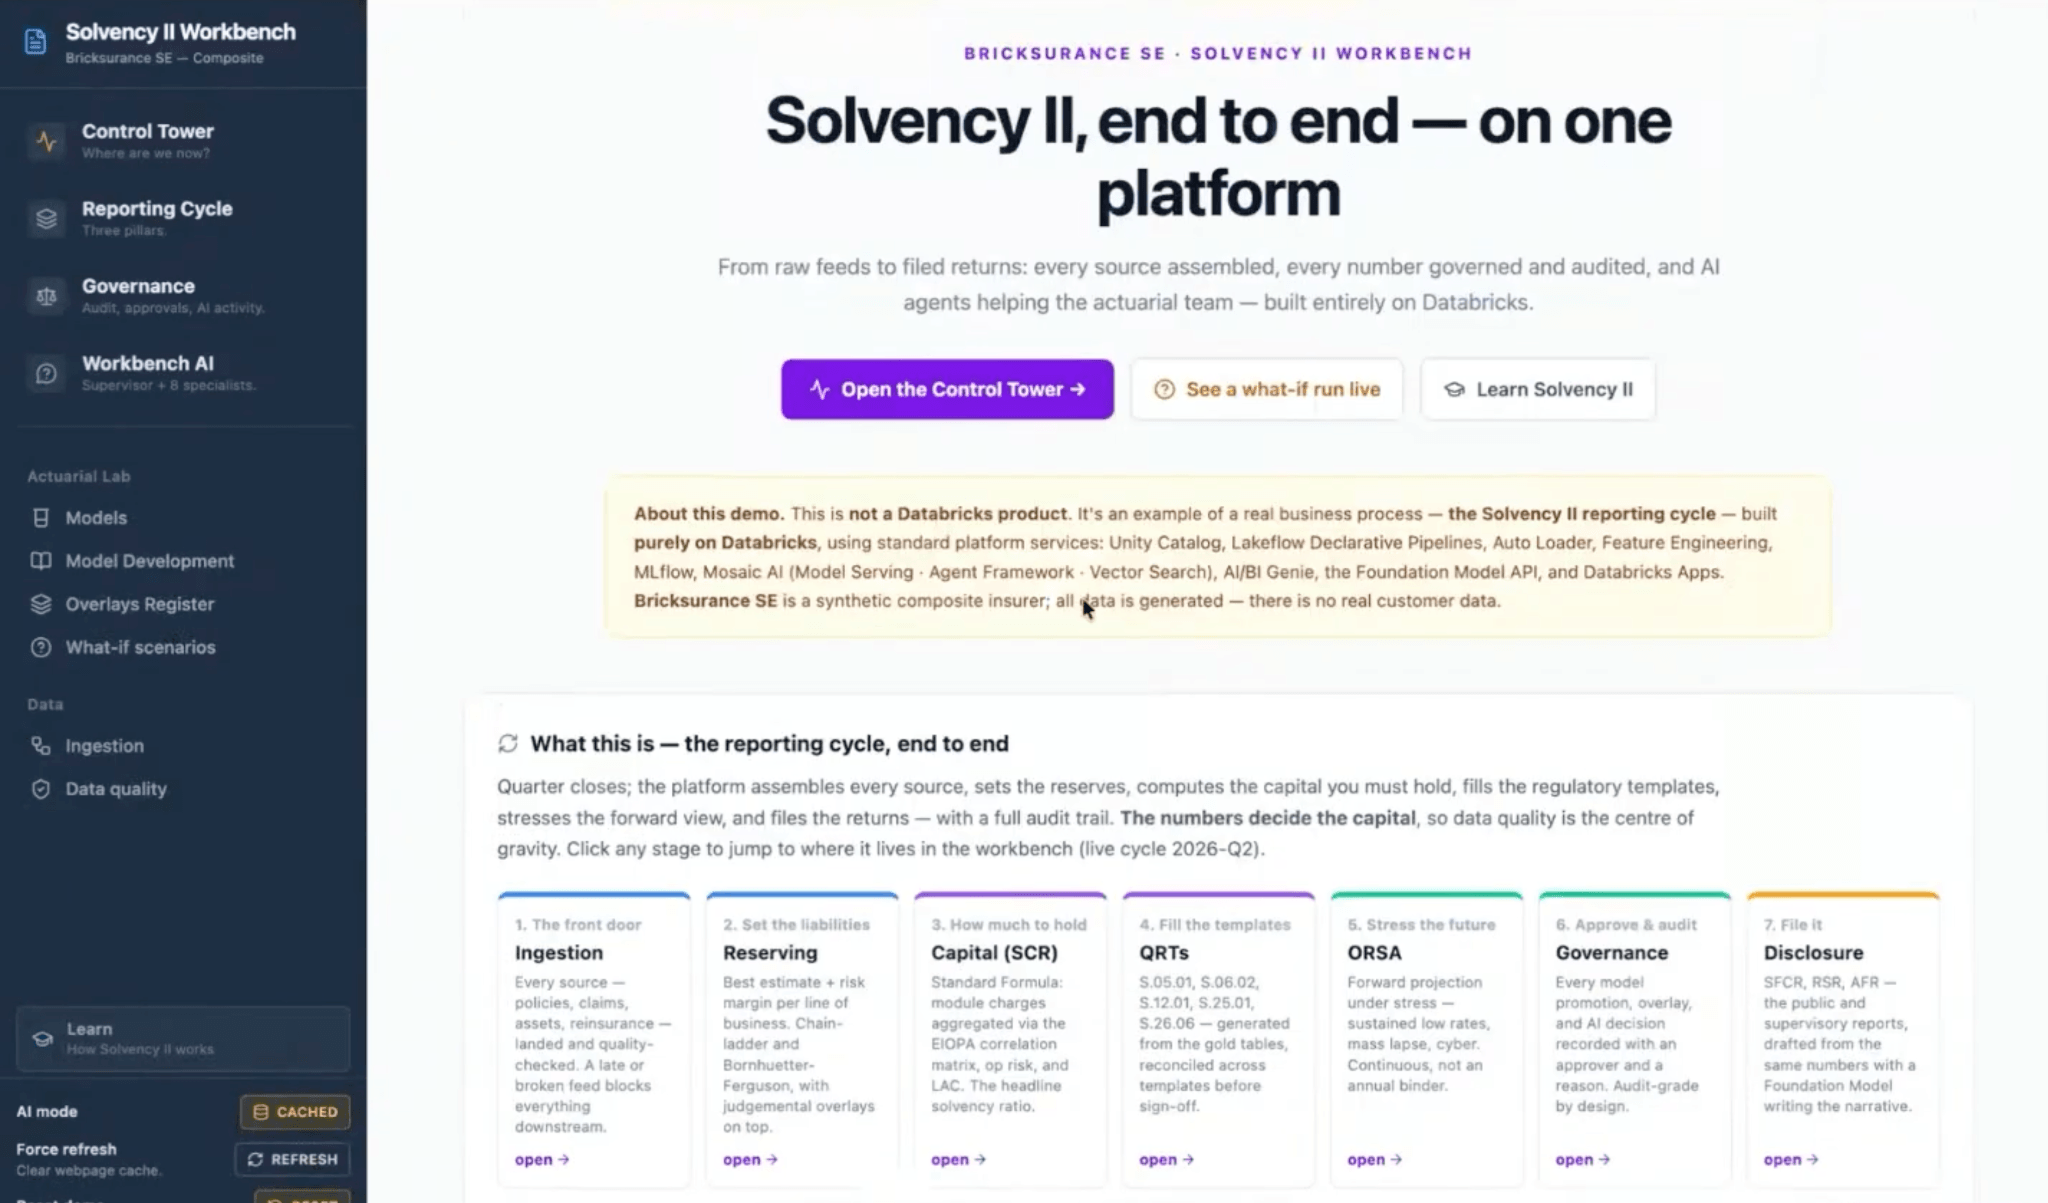
A Databricks demo, presented by Laurence Ryszka, Databricks Insurance Sr. Solutions Architect, illustrates what this process could look like when implemented end-to-end: from ingestion and reserving through capital calculation, reporting, governance, and disclosure.
Why Solvency II reporting is difficult to operate
Many Solvency II implementations were assembled over time. Different teams manage different parts of the process, data arrives at different speeds, and reporting activities can be spread across multiple systems and data locations. A person overseeing the process may have responsibility for the final submission without having one connected view of everything happening underneath it.
That fragmentation creates specific, recurring problems:
- A data feed arrives late and requires manual follow-up to identify the owner and assess the impact
- A data-quality rule fails and the affected rows need a disposition decision before the workflow can proceed
- Two QRTs may not reconcile
- A model approval may block an automated workflow
- Leadership asks a scenario question, for example what happens to the solvency ratio if the insurer doubles its cyber book over the next 12 months, and answering requires data, models, capital calculations, and reporting outputs to work together.
Each issue pulls teams into separate investigations and coordination across tools. The submission gets made, but the process consumes significant effort and remains difficult to monitor.
How Databricks supports end-to-end Solvency II reporting
Databricks provides a single platform where the full Solvency II reporting cycle can be implemented as one governed workflow. The approach covers data ingestion, quality checks, actuarial reserving, capital calculation, QRT production, ORSA drafting, governance, and disclosure.
This is not an either/or proposition. Most insurers run established actuarial and capital modeling suites, and those systems remain in place. Databricks acts as the governed data, orchestration, and reporting layer around them: preparing their inputs, consuming their outputs, and connecting both into one monitored process.
The following sections describe how each part of that workflow operates.
One control view for the reporting cycle
At the center of the workflow is a control tower. It provides a single place to monitor the current solvency ratio, readiness for the reporting deadline, approvals, late feeds, and outstanding issues. Changes to the ratio can also be labeled with the event associated with the change, helping users understand what shifted rather than simply seeing that the number moved.
This view changes the operating model from chasing updates across teams to working from a shared picture of the process. A late feed can be linked to its owner. An approval blocker can be surfaced alongside the workflow it affects. A reporting issue can be investigated from the same place where overall readiness is monitored.
Automated ingestion checks and data-quality controls
Ingestion in the workflow is automated. Data is pulled as it becomes available and checked immediately.
The first checks cover basic operational signals such as freshness, completeness, and ownership. Freshness shows whether a feed arrived when expected. Completeness verifies that expected records and fields are present, with volumes checked against previous uploads. Ownership makes it clear who is responsible for a source when a follow-up is needed.
Data-quality rules provide another line of defense. The checks are customizable, and a failed rule can be surfaced for review. Teams can then decide how to handle the affected rows—for example, whether to accept, drop, or quarantine them—based on thresholds that fit their process.
The workflow also supports reconciliation between QRTs. In the demo, an AI agent reviews a mismatch between two templates and traces it to stale property development factors flowing from the reserving feed into the capital calculation. It then provides a remediation path. The important point is not that an agent replaces review; rather, that the agent can focus on a specific issue and give the reviewer a useful second set of eyes.
Model management, approvals, and audit trails
Solvency II reporting depends on more than data movement. It also depends on models, approvals, and evidence that the process was completed correctly.
The demo includes reserving models managed in Databricks with MLflow. It also shows how established actuarial and capital modeling suites—such as Prophet, RAFM, or Igloo—can be orchestrated within the same workflow: Databricks prepares the data those engines consume, ingests and governs their outputs, and carries the results through to reporting. The modeling engines stay where they are; the workflow around them becomes connected and monitored. When a new reserving model or calibration is pending approval, the workflow surfaces the blocker and the action needed to move it forward.
Governance events are recorded across the process, including promotions, approvals, and report-related activity. The audit trail gives users a view of what happened, what is pending, and which workflows require attention.
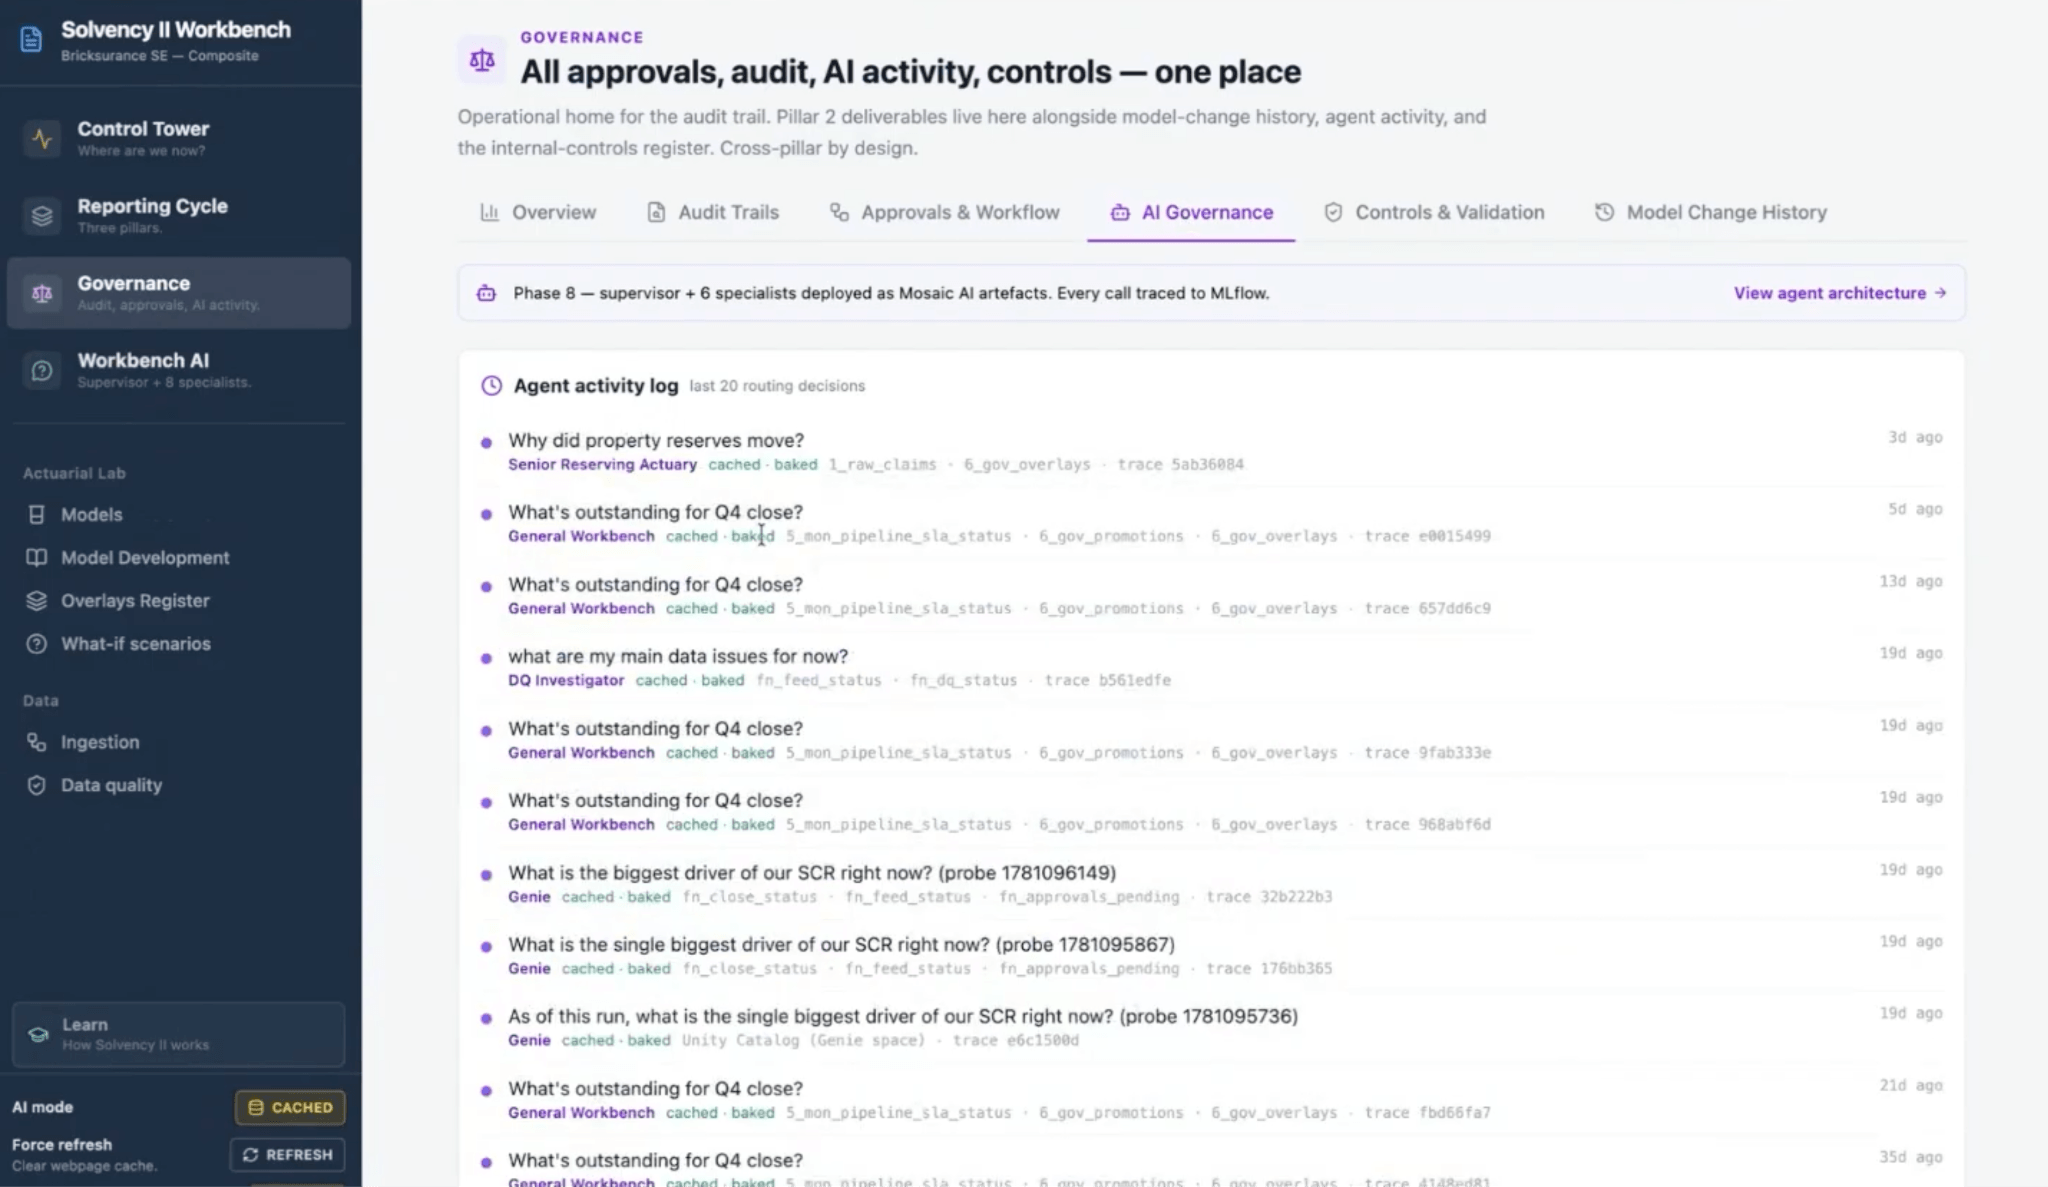
The demo also includes AI governance. The agents have narrow scopes and access to the data relevant to their tasks. Their activity is recorded, including what they use and create. The agents provide recommendations; they do not make decisions on the reviewer's behalf.
An AI orchestration agent can route a broader question across the relevant agents. For example, a question about what is outstanding for a quarter close can be directed to the agents who hold the relevant information. Genie, Databricks' natural-language interface for querying data, can also be used to ask questions directly of the underlying tables.
ORSA drafting and scenario analysis
The reporting workflow can also support narrative and scenario analysis.
The ORSA is different from a numerical QRT. It is an ongoing process in which an insurer assesses its overall solvency needs and risk profile, and its output is a narrative report that typically requires significant input from actuarial and risk teams. In the demo, a large language model (LLM) generates a draft of the ORSA report based on the current numbers, giving the team a starting point that is then reviewed and challenged by those teams. The workflow also includes stress and scenario testing.
The cyber-book example shows how this can support a practical business question. The scenario runs a projection in Databricks and returns an answer about what could happen if the cyber book doubled over the next 12 months. A second AI agent acts as a contrarian capital reviewer, designed to offer an alternative view of the result and highlighting challenges that may not be visible from the solvency ratio alone.
This is the difference between reporting data and an operational reporting process. The same governed workflow that produces the submission outputs can also help teams explore what those outputs mean under a different scenario.
What changes with an end-to-end approach
An end-to-end implementation does not remove the need for regulatory expertise, actuarial review or business ownership. It gives those teams a more connected way to work.
With one control view, teams can see the state of the process, including late feeds, data-quality issues, approvals and blockers. With automated checks and reconciliation support, they can move more quickly from an alert to an explanation. With governance and audit trails, they can retain visibility into the actions and recommendations that shaped the process.
The result is a workflow that is easier to monitor and investigate, while also supporting questions beyond the submission itself. Instead of treating Solvency II as a collection of disconnected tasks, insurers can manage it as one governed business process.
From reporting obligation to business decision support
Solvency II brings together data, models, controls, approvals, and disclosure. When those elements are fragmented, even a straightforward question, such as the impact of doubling a cyber book (an insurer's portfolio of cyber-insurance business), can require extensive coordination.
A connected workflow in Databricks can bring those activities into one process: automated ingestion checks, a control view for readiness and blockers, governed approvals, audit trails, and AI-assisted review. This does not replace regulatory or actuarial expertise. It gives those teams a clearer view of the process and a stronger foundation for exploring business scenarios.
Watch the full demo and expert deep-dive from our Insurance Virtual Industry Forum – From data to decisions: how leading insurers are scaling AI across the entire value chain.
Frequently asked questions
What is Solvency II reporting?
Solvency II reporting is the process by which insurers demonstrate to regulators that they hold sufficient capital and manage risk appropriately. It spans quantitative submissions (QRTs), the ORSA, and public disclosure, supported by governed data, models, and approvals.
What does end-to-end Solvency II reporting include?
End-to-end Solvency II reporting connects data ingestion, quality checks, reserving, capital calculation, QRTs, the ORSA, governance, approvals, and disclosure so insurers can monitor readiness and investigate issues.
How can Databricks support Solvency II reporting?
Databricks provides a unified platform for the full Solvency II reporting cycle. Databricks can provide a governed control view for solvency ratios, late feeds, data-quality issues, approvals, deadlines, model workflows, and audit trails.
How can AI help with Solvency II reporting?
AI can identify reconciliation issues, suggest remediation, draft ORSA report content, and answer questions across reporting data. Actuarial, regulatory, and business reviewers remain responsible for decisions and approvals.
Can Solvency II data support scenario analysis?
Yes. Insurers can use reporting data and capital calculations to assess scenarios, such as doubling a cyber book, and evaluate potential impacts on the solvency ratio within a governed process.
Does Databricks replace actuarial modeling systems such as Prophet, RAFM, or Igloo?
No, Databricks does not replace Prophet, RAFM, or Igloo. Databricks orchestrates around existing actuarial and capital modeling suites rather than replacing them. It prepares the data that those engines use, consumes and governs their outputs, and connects them into one end-to-end reporting workflow with shared controls, approvals, and audit trails.
What is a QRT in Solvency II?
A QRT, or quantitative reporting template, is a standardized data form that insurers submit to regulators under Solvency II. QRTs cover balance sheet, capital, premiums, claims, and other financial data. Reconciliation between QRTs is a common source of reporting issues; the Databricks workflow supports automated reconciliation checks and AI-assisted review of mismatches.
What is the ORSA in Solvency II?
The ORSA, or own risk and solvency assessment, is an ongoing process required under Solvency II in which insurers assess their overall solvency needs, risk profile, and compliance with capital requirements. Its output is a narrative report, distinct from the numerical QRTs, that typically requires significant actuarial and risk input. Databricks supports ORSA drafting with an LLM that generates a starting draft based on current reporting data, for review by those teams.
Get the latest posts in your inbox
Subscribe to our blog and get the latest posts delivered to your inbox.