Benchmarking Coding Agents on Databricks’ Multi-Million Line Codebase
by Vinay Gaba, Ankit Mathur, Rishabh Singh, Patrick Wendell and Matei Zaharia
At Databricks, the way we build software is changing quickly as we aggressively adopt AI for engineering. The landscape of models and harnesses for code authoring has rapidly expanded in the last year, giving developers more choices than ever. With more options, it has become increasingly important to understand which coding agents offer the best performance on real-world coding tasks as well as understanding how task-performance varies with price.
This article shares the results and methodology of the internal coding benchmark we built at Databricks, which evaluates tools on actual coding tasks our engineers performed on the Databricks codebase. Tasks featured edits against a multi-million line codebase covering many popular languages (Python, Go, Typescript, Scala, etc.) and both tasks and solutions were carefully reviewed to ensure accuracy. This isn't meant to be comprehensive, but the exercise surfaced insights that have already made our engineering team meaningfully more efficient with coding agents. Below, you can see how models and harnesses scored on the overall benchmark:
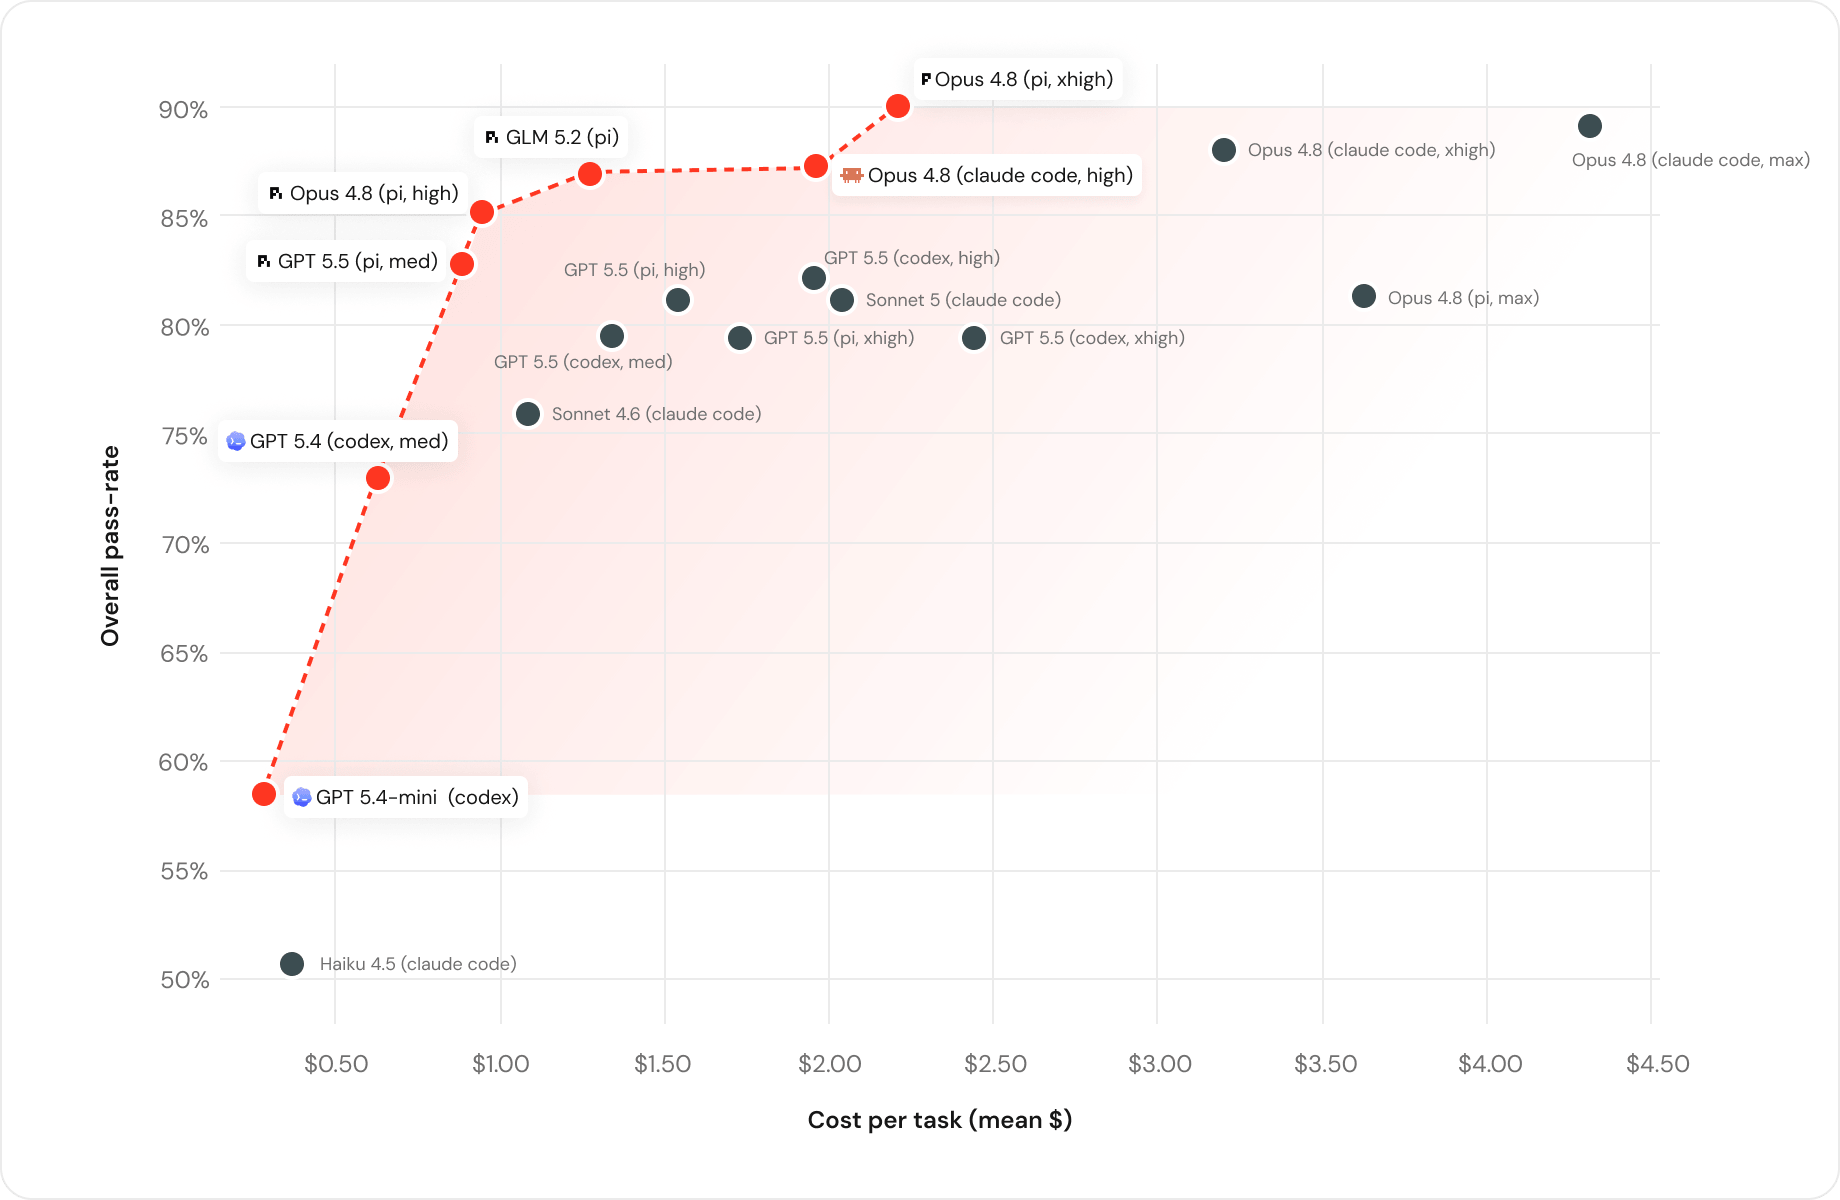
Figure 1: Cost vs. Performance on our benchmark
The main conclusions from our analysis were:
- The Pareto frontier for coding tasks (i.e. best quality for a given cost) includes models from OpenAI, Anthropic, and open source. This means today, only a mix of tools can provide frontier performance.
- Open models, and GLM 5.2 in particular, are now able to handle even the highest level of task difficulty.
- The token price of a model is a poor indicator of actual costs incurred on end-to-end tasks. Larger models can be far more token efficient and have lower overall costs.
- The harness a model is called from dramatically impacts cost and quality. In many cases, simple harnesses like Pi performed best on our workloads.
Let’s dive a bit deeper on each one.
Models cluster into rough “capability tiers”
Specific results being a couple points off can often even out in real world tasks. We focused more on the thematic patterns that help us reason about which models to use for various tasks. In fact, the results showed clear clustering of the models and harnesses into 3 capability tiers.

Figure 2: Three distinct capability tiers emerged in our overall results, with nuance in which models were effective in each group
At the upper end of performance, we see that the most intelligent models are very effective at solving all kinds of problems, but they’re very expensive. Medium and lower intelligence models are still highly effective at the common tasks, and in many cases, they’re also significantly cheaper.
Day to day, engineers do a lot of different things that vary significantly in complexity: common operational tasks like flipping a flag or updating configs don’t require extremely intelligent models, but deeper design explorations do. However, in the past, our default models were always the most expensive ones. Based on this analysis we determined we should push more work to the Haiku and GPT 5.4 Mini class of models.
Open models are here for coding
There’s been a lot of excitement about GLM 5.2, and our results showed evidence that GLM can be a daily driver model for a lot of our developers. It landed in the top capability tier, statistically tied with Opus 4.8 on quality, but costing $1.28/task against Opus’s $1.94.
The GLM quality scores are consistent with qualitative feedback we’ve gotten from internal developers who have been piloting GLM for daily development. Because of its great performance for everyday coding tasks, we’ve been focused on serving GLM with the best performance, and the evidence shows it’s time to start deploying these as daily drivers for coding.
Price-per-task vs price-per-token
Developers often eyeball token costs to determine how expensive a model will be when completing coding tasks. We found, however, that token costs are often a poor indicator of overall task costs, due to variance in reasoning efficiency amongst models. This underscores the need for task-level benchmarking, since task shape and complexity may be different in different contexts.
As an example, Sonnet 5 is ~1.7x cheaper per token than Opus 4.8, but, on our tasks, we found that Sonnet cost $2.09/task vs Opus’s $1.94, while scoring six points lower on task completion (81% vs 87%). This was mostly because Sonnet 5 worked longer and read more to get there, consuming 1.9x more tokens.
Harnesses have a major impact on efficiency
When we ran the same model with the same thinking effort through two different harnesses (Claude Code/Codex vs Pi), we observed that the cost per task differed significantly (more than 2x in some cases), while quality remained the same. The main difference came down to how much context each harness fed the model on each turn.

Pi sent about 3x less context per turn. It managed context better, keeping a tighter working set and finishing the tasks in fewer runs.
The lesson here isn’t that one harness is always cheaper or that native harnesses are worse. Instead, model choice is only one piece of the puzzle. Establishing this flexibility is why we invested in Omnigent to make model-and-harness swaps seamless.
Why build your own benchmark?
Public benchmarks like SWE-Bench and TerminalBench are useful, but they can’t answer the questions we had. There are a few reasons for this:
- The tasks are public, so the solutions leak into training data over time.
- We found the results weren’t representative for our codebase, which spans 10+ languages and many services written in Scala, Go, Rust, Java and Python, Bazel, Protobuf, and more.
By building a benchmark on our own PRs, we can make these decisions with higher confidence that we won’t hamper our developers by rolling out optimizations.
How we built the benchmark
We used Unity Gateway to capture logs of all our coding interactions, which enabled us to analyze the complexity of the tasks engineers tackle using coding agents. There was a significant diversity in the task complexity, and about a quarter were tagged as low-complexity work and ~60% as medium complexity.

However, expensive models are the default models engineers use, so there was clearly a huge opportunity for improving efficiency.
Task Construction
Our engineers merge thousands of code changes a day, so we already have a great dataset to build off. A good pull request is a rich artifact, with commits that show iteration from the developer, review by humans, and tests that help verify a code change is faithful to its intent. However, we needed several quality checks and filters to construct a high-quality benchmark out of them:
- Recency: We pull from recent history so the tasks reflect how we build today, including the frameworks, patterns, and conventions currently in use.
- Human written: Bot commits, service accounts, fully AI generated changes, and auto-generated changes were filtered.
- Associated high quality test suite: We filtered for PRs that included high-quality tests for validating the code changes.
- Self-contained: The changes were confined to a few modules.
- Representative of typical tasks: We selected PRs from a distribution of tasks across the full stack: Scala backend services, Rust systems code, the React and TypeScript frontend, protobuf and gRPC contracts, and Bazel configs.

Once we had candidate PRs, we focused on constructing well-specified tasks by:
- Gleaning the intent and summarizing it as a prompt. We read the PR to understand what it was actually for and then describe the outcome we want. Usually, that meant rewriting the PR description by stating the problem or goal, naming any constraints, and removing the description of the solution. It’s important to remove, for example, explanations of why a bug fix is the right one, since that makes the task too easy.
- Splitting out the relevant tests. The non-test files were the change the model has to reproduce on its own, so we set the test files aside and ensured we could compile that. Our build system can already determine which tests depend on the files that were touched in the original PR, so we ran all those test targets in full.
What came out of this exercise was a single task in the benchmark. Here’s a simplified example:
While we used scripting and AI to generate candidate tasks, we evaluated each sample by hand. In some cases, we found that tests in the original PR needed to be rewritten to allow for an alternative implementation or to be more rigorous, which we did manually (without AI). Similarly, we also found cases that required improving the task description to make them well-specified.

Figure 3: A before-and-after from our test suite: the previous test anchored on verifying exact string match which resulted in some failures when the model tried to solve the task. This wasn’t a great way to test non-deterministic output so it was rewritten to grade behavior instead.
We instantiated the coding agent harnesses and models using their standard, out of the box setups, with all common tools that Databricks engineers would have available to them.

When the agent explicitly said that it had completed the task, we checkpointed that code, patched the tests that were held out, and evaluated the tests to determine whether that task is a “pass” for that model + harness combination. We did not use an LLM judge to evaluate correctness, since we’ve found that this rewards sounding right over being right.
Additional Guardrails

In our early experiments, a few model scores looked too good to be true, so we manually inspected the traces to understand what happened in these agent trajectories. What we saw was that due to our original setup, the “correct” implementation was still recoverable in the Git history of the worktree! Every task had originated from a merged commit, so nothing stopped an agent with a shell from walking forward through git history to find it. To fix this issue, we sealed git history: for the length of each run, we cut the working copy off from the repository entirely.
What’s next?
We started with a simple question: can we use coding agents more efficiently? The answer is a definitive yes, and because we can be data driven, we can start building capabilities to select the right models automatically and track efficiency.
Any company can do the same. Any team with a backlog of merged PRs is sitting on a benchmark already that no model has trained on, graded by the tests your team wrote. We’re actively adding more tasks (especially harder ones), and we plan to run every new agent/harness through it and feel more confident about our choices.
At Databricks, we’ve always been wary of lock-in, not just to vendors, but to assumptions that make teams less flexible over time. That same instinct shaped our early bets on open formats and standards, and it shapes how we’re approaching AI now: measure what actually works on the code we ship, give engineers room to move across models and harnesses with consistent guardrails, and do optimizations to use AI effectively.
In a follow-up blog, we’ll talk more about how we’re using intelligent routing features in Unity Gateway and in Omnigent to help our developers use the most intelligent agents while being efficient.
Get the latest posts in your inbox
Subscribe to our blog and get the latest posts delivered to your inbox.