TOP COMPANIES RELY ON AI/BI
The next generation of analytics is here
Democratize insights from your data through AI-powered business intelligence, natively integrated into the Databricks Platform.AI from day one
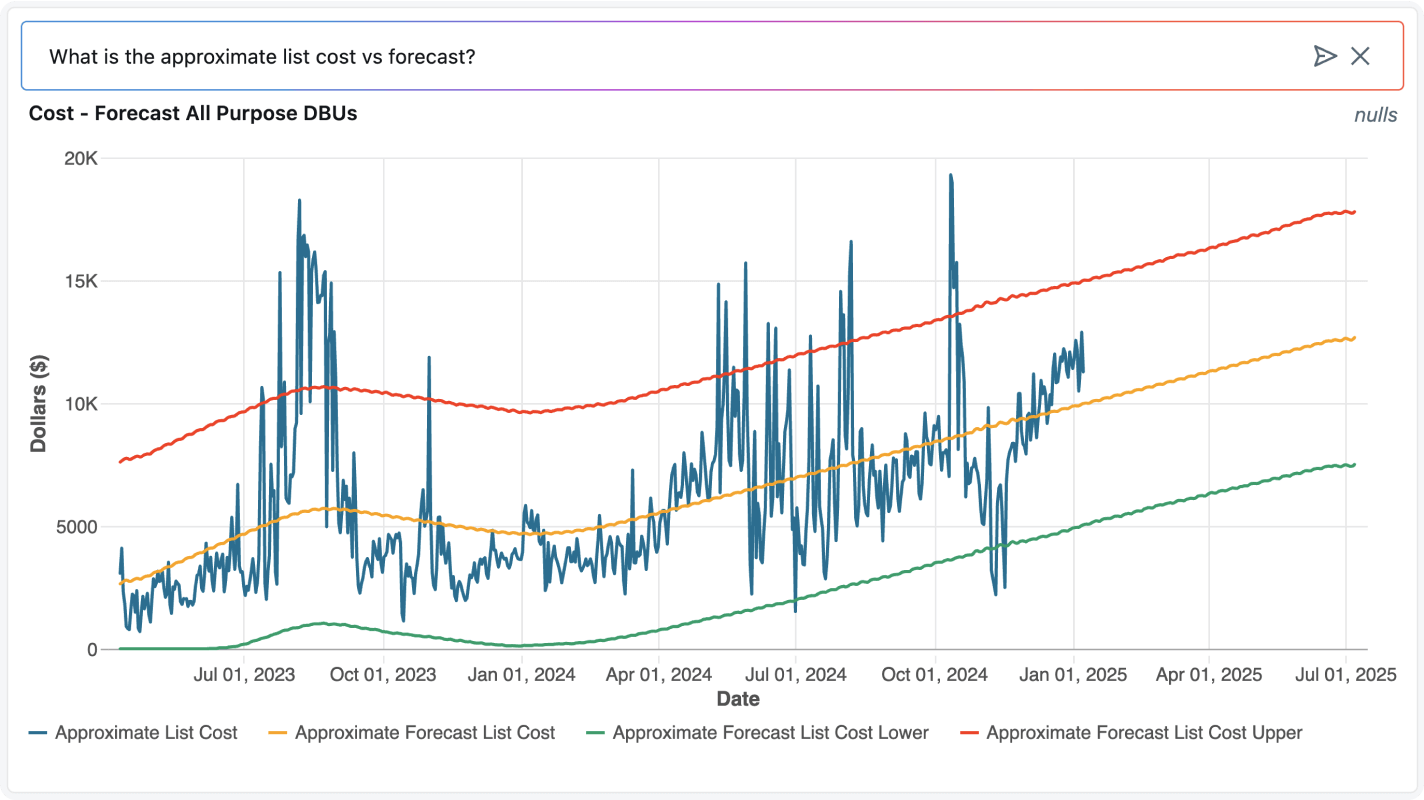
BI built on AI from the ground up. From natural language dashboard creation to conversational analytics. Every step is AI-assisted, empowering true self-service exploration so anyone can build faster, ask follow-up questions and uncover answers in seconds.
Unified governance and semantics
Run analytics directly on your governed data in Unity Catalog. Keeping metrics, lineage and permissions seamlessly aligned end to end. Integrated semantics ensure one version of truth across BI dashboards, AI agents and downstream tools.
No license limits
Empower everyone to explore data, build dashboards and uncover insights without the burden of per-seat or per-license fees. With AI/BI built natively into the Databricks Platform, you remove barriers to access and eliminate hidden BI costs across your organization.
Native Databricks tools for business intelligence

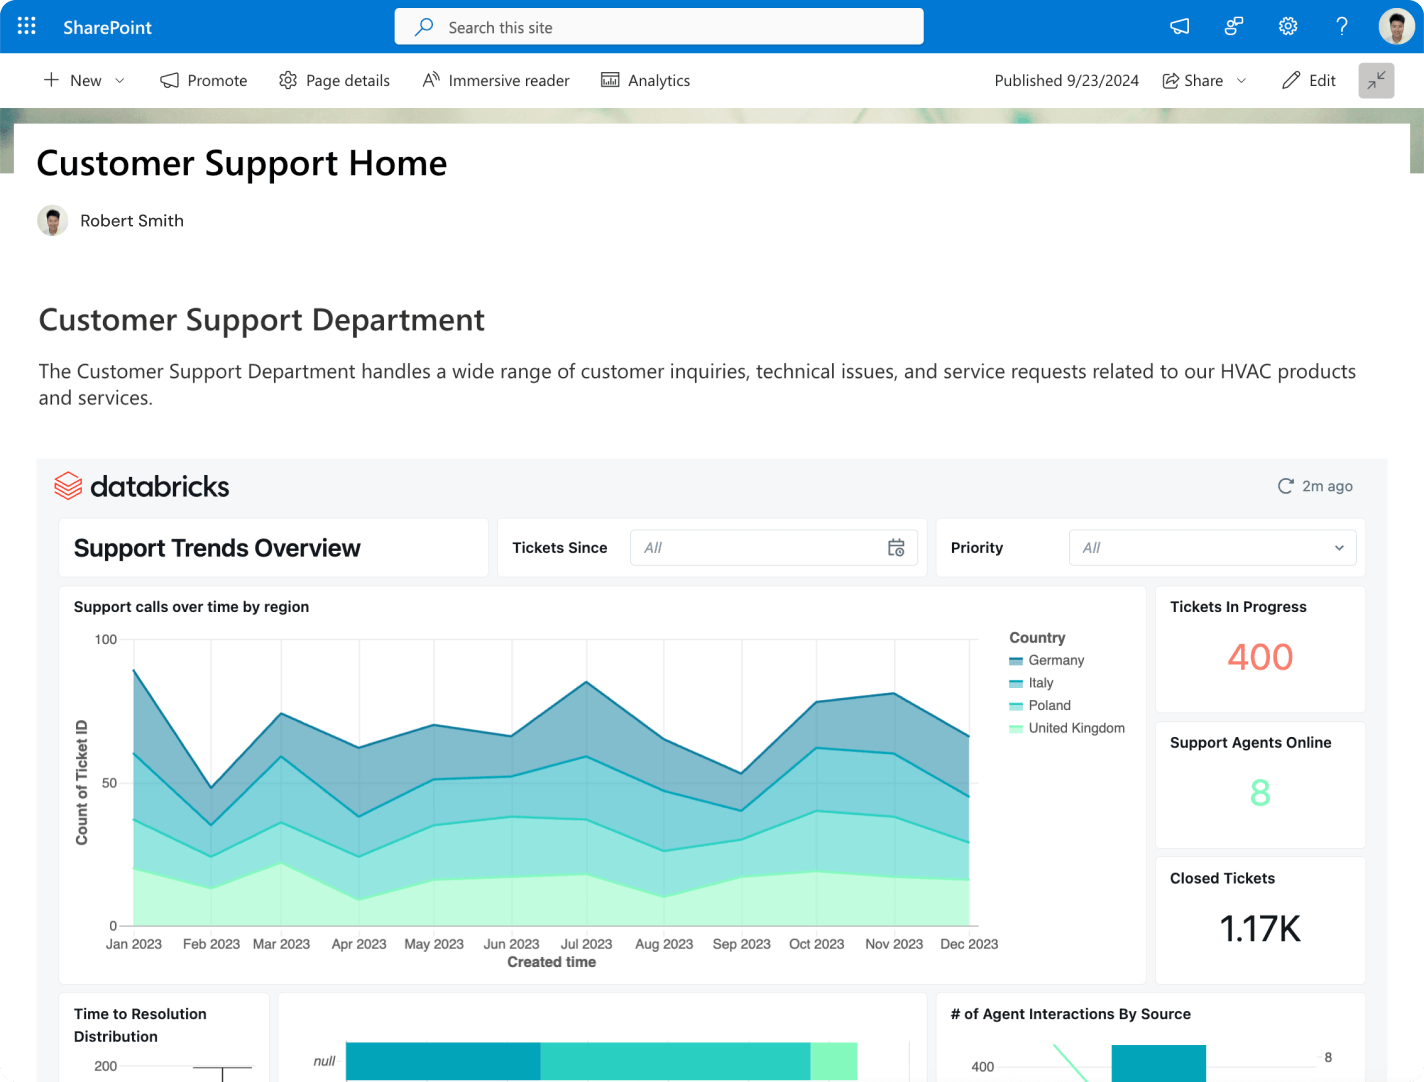
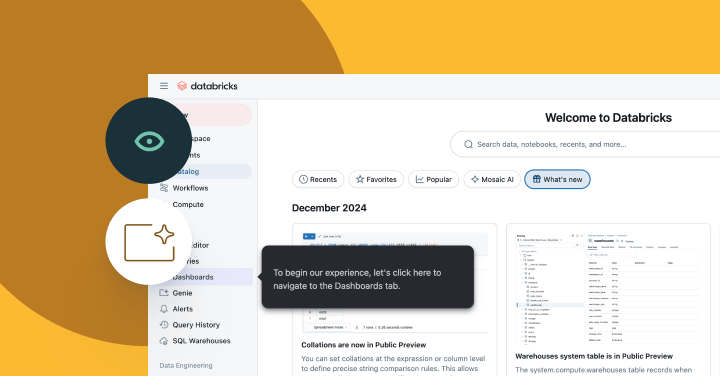
AI/BI Dashboards
An AI-assisted business intelligence solution, built into the Databricks Platform, to quickly create analytical datasets, interactive dashboards and data visualizations for your business teams.
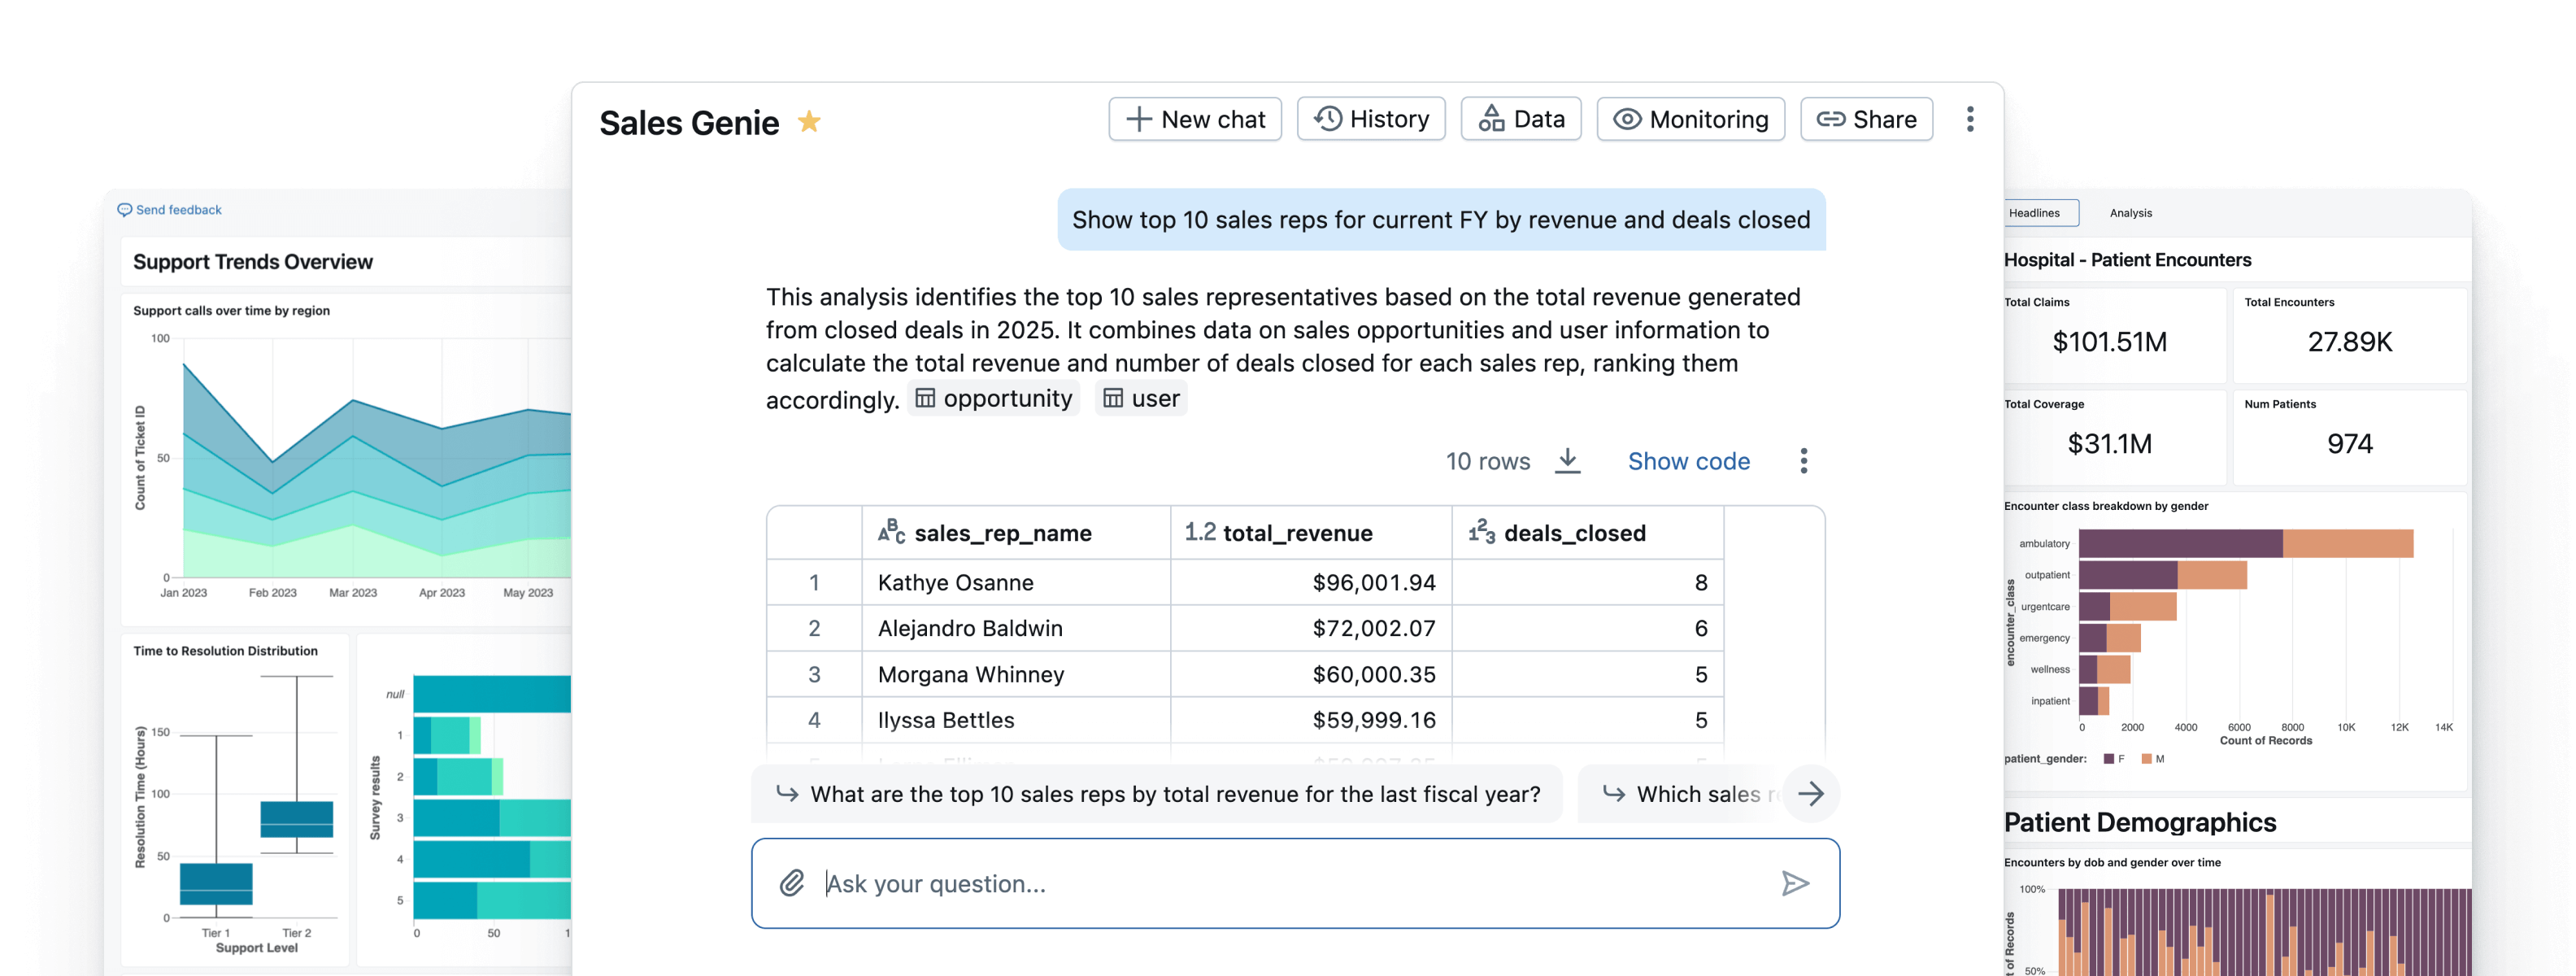
Genie Spaces
A conversational experience, powered by generative AI, for business teams to go beyond BI dashboards and self-serve insights in real time from their data through natural language.

Databricks Lakehouse
An intelligent, self-optimizing data warehouse built on lakehouse architecture, offering the best price/performance in the market.

Genie
A single place for business teams to explore AI/BI Dashboards, talk with Genie and use apps custom-built with Databricks Apps.

Genie Code
Analyze, build and optimize with autonomous AI that understands your data.

Unity Catalog Business Semantics
A unified semantic layer for the Databricks Platform, centralizing business definitions to power your BI, AI and data use cases.
Built for real-world analytics

Monitor, analyze and visualize your business data
Create dashboards and visualizations from your data to enable data-driven decision-making for everyone. Generate detailed reports containing insights into performance, trends and key metrics. Empower users to act on what their data tells them.


Take the next step


Business Intelligence FAQ
Ready to become a data + AI company?
Take the first steps in your data transformation