Data Science
Collaborative data science at scale
Dive deeper into Data Science on Databricks
Streamline the end-to-end data science workflow — from data prep to modeling to sharing insights — with a collaborative and unified data science environment built on an open lakehouse foundation. Get quick access to clean and reliable data, preconfigured compute resources, IDE integration, multi-language support, and built-in advanced visualization tools for maximum flexibility for data analytics teams.

Collaboration across the entire data science workflow
Write code in Python, R, Scala and SQL, explore data with interactive visualizations and discover new insights with Databricks Notebooks. Confidently and securely share code with coauthoring, commenting, automatic versioning, Git integrations, and role-based access controls.

Focus on the data science, not the infrastructure
You don’t have to be limited by how much data fits on your laptop anymore or how much compute is available to you. Quickly migrate your local environment to the cloud and connect notebooks to your own personal compute and auto-managed clusters.

Use your favorite local IDE with scalable compute
The choice of an IDE is very personal and affects productivity significantly. Connect your favorite IDE to Databricks, so that you can still benefit from limitless data storage and compute. Or simply use RStudio or JupyterLab directly from within Databricks for a seamless experience.

Get data ready for data science
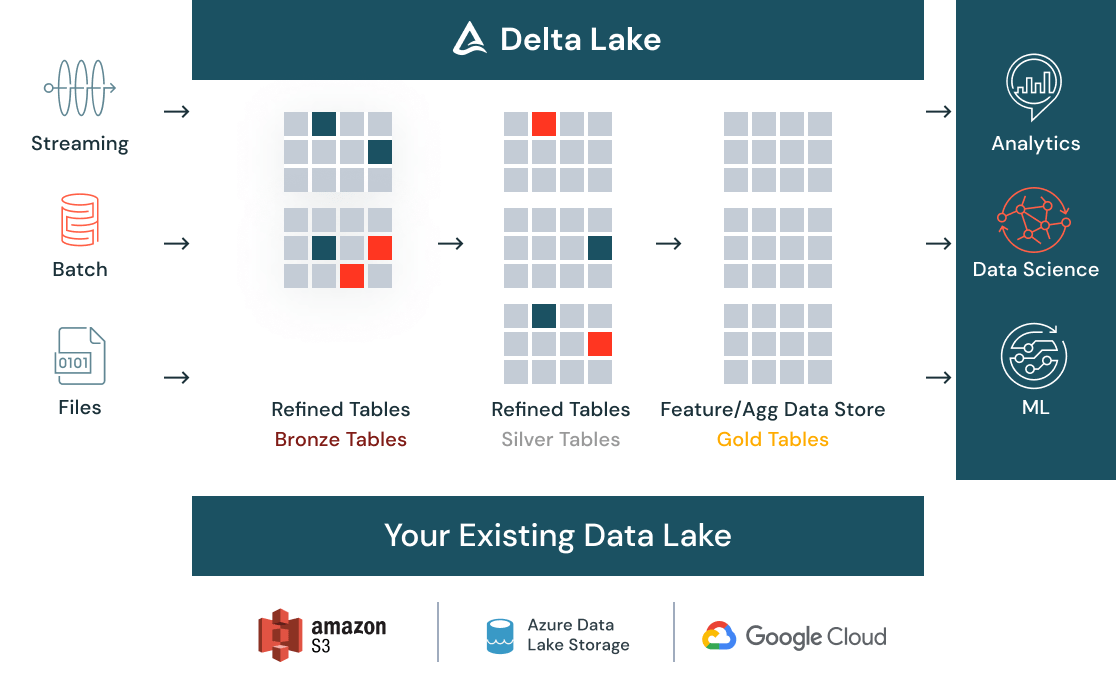
Clean and catalog all your data — batch, streaming, structured or unstructured — in one place with Delta Lake and make it discoverable to your entire organization via a centralized data store. As data comes in, automatic quality checks ensure data meets expectations and is ready for analytics. As data evolves with new data and further transformations, data versioning ensures you can meet compliance needs.

Low-code, visual tools for data exploration
Use visual tools natively from within Databricks notebooks to prepare, transform and analyze your data, enabling teams across expertise levels to work with data. Once done with your data transformations and visualizations, you can generate the code that’s running in the background — saving you time from writing boilerplate code so you can spend more time on high-value work.

Discover and share new insights
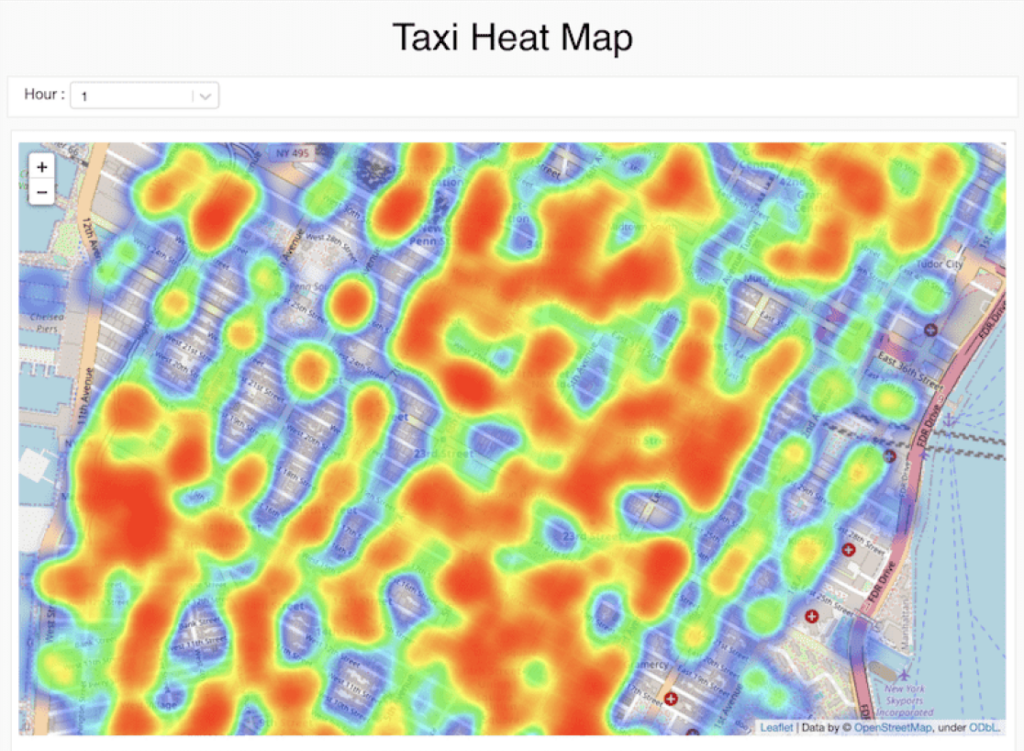
Easily share and export results by quickly turning your analysis into a dynamic dashboard. The dashboards are always up to date and can also run interactive queries. Cells, visualizations or notebooks can be shared with role-based access control and exported in multiple formats, including HTML and IPython Notebook.

