Mining Ecommerce Graph Data with Apache Spark at Alibaba Taobao
by Andy Huang and Wei Wu
Alibaba Taobao operates one of the world’s largest e-commerce platforms. We collect hundreds of petabytes of data on this platform and use Apache Spark to analyze these enormous amounts of data. Alibaba Taobao probably runs some of the largest Spark jobs in the world. For example, some Spark jobs run for weeks to perform feature extraction on petabytes of image data. In this blog post, we share our experience with Spark and GraphX from prototype to production at the Alibaba Taobao Data Mining Team.
Every day, hundreds of millions of users and merchants interact on Alibaba Taobao’s marketplace. These interactions can be expressed as complicated, large scale graphs. Mining data requires a distributed data processing engine that can support fast interactive queries as well as sophisticated algorithms.
Spark and GraphX embed a standard set of graph mining algorithms, including PageRank, triangle counting, connected components, shortest path. The implementation of these algorithms focuses on reusability. Users can implement variants of these algorithms in order to exploit performance optimization opportunities for specific workloads. In our experience, the best way to learn GraphX is to read and understand the source code of these algorithms.
Alibaba Taobao started prototyping with GraphX in Apache Spark 0.9 and went into production in May 2014 around the time that Apache Spark 1.0 was released.
One thing to note is that GraphX is still evolving quickly. Although the user-facing APIs are relatively stable, the internals have seen fairly large refactoring and improvements from 0.8 to 1.0. Based on our experience, each minor version upgrade provided 10 - 20% performance improvements even without modifying our application code.
Graph Inspection Platform
Graph-based structures model the many relationships between our users and items in our store. Our business and product teams constantly need to make decisions based on the value and health of each relationship. Before Spark, they used their intuition to estimate such properties, resulting in decisions which were not a good fit with reality. To solve this problem, we developed a platform to scientifically quantify all these metrics in order to provide evidence and insights for product decisions.
This platform requires constantly re-iterating the set of metrics it provides to users, depending on product demand. The interactive nature of both Spark and GraphX proves very valuable in building this platform. Some of the metrics this platform measures are:
Degree Distribution: Degree distribution measures the distribution of vertex degrees (e.g. how many users have 50 friends). It also provides valuable information on the number of high degree vertices (so-called super vertices). Often our downstream product infrastructure needs to accommodate super vertices in a special manner (because they have a high impact on propagation algorithms), and thus it is crucial to understand their distribution among our data. GraphX’s VertexRDD provides built-in support for both in-degrees and out-degrees.
Second Degree Neighbors: Modeling social relationships often requires measuring the second-degree neighbor distribution. For example, in an instant messaging platform we developed, the number of “retweets” correlates with the number of second degree neighbors (e.g. number of friends of friends). While GraphX does not yet provide built-in support for counting second degree neighbors, we implemented it using two rounds of propagations: the first round propagates each vertex’s ID to its neighbors, and the second round propagates all IDs from neighbors to second degree neighbors. After the two rounds of propagations, each vertex calculates the number of second degree neighbors using a hash set.
One thing to note in this calculation is that we use the aforementioned degree distribution to remove super vertices from the second degree neighbor calculation. Otherwise, these super vertices would create too many messages, leading to high computation skew and high memory usage.
Connected Components: Connected components refer to some set of subgraphs that are “connected”, i.e. there exists a path connecting any pair of vertices in the subgraph. Connected component is very useful in dividing a large graph into multiple, smaller graphs, and then operations that are computationally too expensive to run on the large graph. This algorithm can also be adapted to discover tightly connected networks.
We are developing more metrics using both built-in functions provided by Spark and GraphX, as well as new ones implemented internally. This platform nurtures a new culture such that our product decisions are no longer based on instinct and intuition, but rather on metrics mined from data.
Multi-graph Merging
The Graph Inspection Platform provides us with different properties for modeling relationships. Each relationship structure has its own strengths and weaknesses. For example, some relationship structure provides more valuable information in connected components, while another other structure might work better for interactions. We often make decisions based on multiple different properties and structural representations of the same underlying graph. Based on GraphX, we developed a multi-graph merging framework that creates “intersections” of multiple graphs.
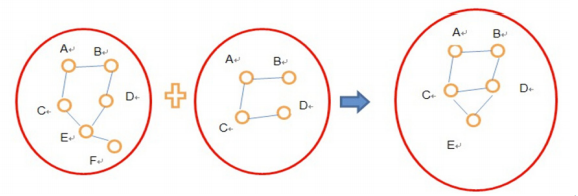
The attached figure illustrates the algorithm to merge graph A and graph B to create graph C: edges are created in graph C if any of its vertices exist in graph A or graph B.
This merging framework was implemented using the outerJoinVertices operator provided by GraphX. In addition to naively merging two graphs, the framework can also assign different weights to the input graphs. In practice, our analysis pipelines often merge multiple graphs in a variety of ways and run them on the Graph Inspection Platform.
Belief Propagation
Weighted belief propagation is a classic way of modeling graph data, often used to predict a user’s influence or credibility. The intuition is simple: highly credited users often interact with other highly credited users, while lower credited users often interact with other lower credited users. Although the algorithm is simple, historically we did not attempt to run these on our entire graph due to the computation cost to scale this to hundreds of millions of users and billions of interactions. Using GraphX, we are able to scale this analysis to the entire graphs we have.
Each run of the algorithm requires 3 iterations, and each iteration requires 8 iterations in GraphX’s Pregel API. After a total of 30 iterations in Pregel, the AUC (area under the curve) increased from 0.6 to 0.9, which is a very satisfactory prediction rate.
While we are still in the early stages of our journey with GraphX, already today we have been able to generate impressive insights with graph modeling and analysis that would have been very hard to accomplish at our scale without GraphX. We plan to enrich and further develop our various platforms and frameworks to include an even wider array of metrics and apply them to tag/topic inference, demographics inference, transaction prediction, which will in turn improve our various recommendation systems’ effectiveness.
Authors
Andy Huang leads the data mining team at Taobao. He is a very early adopter of Spark, using it production since Spark 0.5.
Wei Wu is an engineer at Taobao’s data mining team. His interests span distributed systems, large-scale machine learning and data mining.
This guest blog post is a translation of part of an article published by CSDN Programmer Magazine.
Get the latest posts in your inbox
Subscribe to our blog and get the latest posts delivered to your inbox.