An Illustrated Guide to Advertising Analytics
by Grega Kešpret and Denny Lee
To learn the latest developments in Apache Spark, register today to join the Spark community at Spark Summit in New York City!
This is a joint blog with our friend at Celtra. Grega Kešpret is the Director of Engineering. He leads a team of engineers and data scientists to build analytics pipeline and optimization systems for Celtra.
Advertising technology companies that want to analyze their immense stores and varieties of data require a scalable, extensible, and elastic platform. With Databricks, Celtra was able to scale their Big Data analysis projects six-fold, leading to better-informed product design and quicker issue detection and resolution.
Celtra provides agencies, media suppliers, and brand leaders alike with an integrated, scalable HTML5 technology for brand advertising on smartphones, tablets, and desktop. The platform, AdCreator 4, gives clients such as MEC, Kargo, Pepsi, and Macy’s the ability to easily create, manage, and traffic sophisticated data-driven dynamic ads, optimize them on the go, and track their performance with insightful analytics.
Advertising Analytics Challenges
Like most advertising platforms, Celtra needed the ability to go far beyond calculations provided by precomputed aggregations (e.g. canned reports). They also needed:
- the flexibility to perform uniques, order statistics, and other metrics outside the boundaries of existing pre-designed data models;
- to combine their metric calculations with visualizations to more quickly and better understand their data;
- and to have short development cycles so they could experiment with different analysis much more quickly.
To complicate matters further, Celtra's data sources are diverse involving a wide variety of creative capabilities within a complex ecosystem (e.g. high cardinality). With analysis focused on consumer engagement with their clients’ ads, Celtra was constantly exploring new ways to leverage this information to improve their data products.
In the past, Celtra's original environments had the following issues:
- they were dealing with complex setup and configurations that required their data scientists to focus on infrastructure work instead of focusing their data problems;
- there was a limited number of people working on their solution resulting in all of their big data analysis being bottlenecked with their analytics engineering team;
- and the lack of a collaborative environment resulted in analyses that were not reproducible nor repeatable.
Data Sciences and Simplified Operations with Databricks
With Databricks, Celtra was able to address the challenges above and:
- They reduced the load on their analytics engineering team by expanding access to the number of people able to work with the data directly by a factor of four.
- Allowed their teams to effortlessly manage their Apache Spark clusters and managed issues ranging from high availability to the optimized setups and configurations within AWS.
- This increased the amount of ad-hoc analysis done six-fold, leading to better-informed product design and quicker issue detection and resolution.
- With Databricks' integrated workspace, they were able to quickly build notebooks with visualizations that increased collaboration and improved reproducibility and repeatability of analysis.
While Spark allows you to solve a wide variety of data problems with multiple languages in a scalable, elastic, distributed environment; Databricks simplified operations and reduced the need for dedicated personnel to maintain the infrastructure.
Why Spark for Event Analytics
Apache Spark™ is a powerful open-source processing engine built around speed, ease of use, and sophisticated analytics. Spark comes packaged with support for ETL, interactive queries (SQL), advanced analytics (e.g. machine learning), and streaming over large datasets.
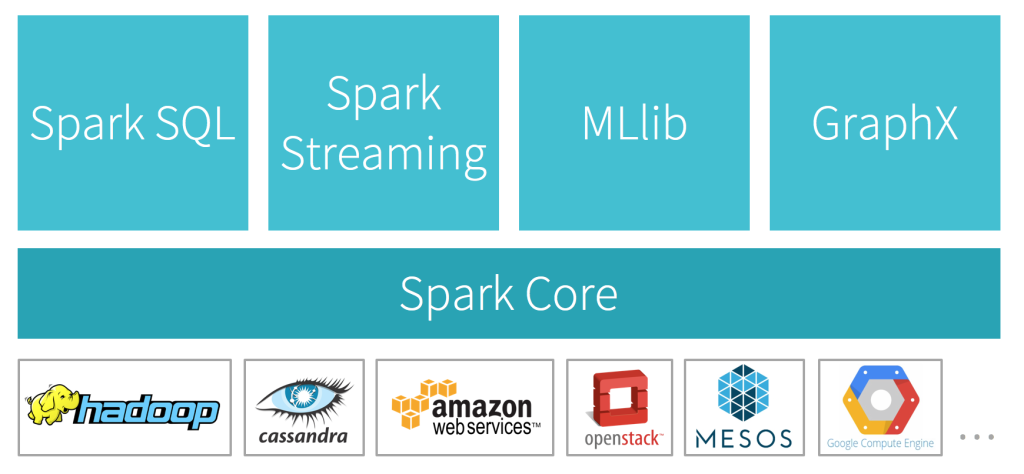
In addition to being scalable and fault tolerant, Spark allows you to program in your language of choice including Python, Java, Scala, R, and SQL. For Celtra and other advertising customers, Spark provides distinct benefits for AdTech and event analytics including:
- the ability to solve multiple data problems (e.g. streaming, machine learning, and analytics) using the same data platform;
- access to an expressive computation layer;
- a fast pace of innovation (with 1000 total code contributors in 2015);
- and seamless integration with S3.
Particularly convenient is the ability to do event sessionization with a simple yet powerful API such as the code below:
def analyze(events: RDD[Event]): RDD[Session] = {
events
.keyBy(_.sessionId)
.groupByKey(groupTasks)
.values()
.flatMap(computeSession)
}
For more information, please check out the webinar How Celtra Optimizes its Advertising Platform with Databricks
Making Sense of your Advertising Data
To make sense of your advertising weblog data, log into Databricks and you will immediately be able to begin working with a Databricks notebook. Our notebooks provide much more than just data visualization, they also support multiple languages (R, Python, Scala, SQL, and Markdown), mixing languages within the same notebook, versioning with GitHub, real-time collaboration, one-click to production (the ability to execute a notebook as a separate scheduled job), and the ability to export notebooks in multiple archive formats including HTML.
In this example, we will perform the following tasks:
- Create an external table against a large amount of web access logs including the use of a regular expression to parse a series of logs.
- Identify each visitor's country (ISO-3166-1 three-letter ISO country code) based on IP address by calling a REST Web service API.
- Identify each visitor's browser and OS information based on their User-Agent string using the user-agents PyPI package.
- Convert the Apache web logs date information, create a userid, and join back to the browser and OS information.
Step 1: Making sense of the access logs
The primary data source for advertising is an Apache web access log. Below is a sample row from one of those logs.
10.109.100.123 - - [04/Dec/2015:08:15:00 +0000] "GET /company/info HTTP/1.1" 200 8572 "https://www.databricks.com/" "Mozilla/5.0 (Macintosh; Intel Mac OS X 10_11_0) AppleWebKit/537.36 (KHTML, like Gecko) Chrome/46.0.2490.80 Safari/537.36" 0.304 "11.111.111.111, 22.222.222.2222, 33.111.111.111, 44.111.111.111"
Traditionally, to make sense of this data, developers would need to build custom ETL processes to provide structure against this data (i.e. convert it into a table). With Spark, instead of spending a lot of resources to make sense of the Apache access log format, you can define an external table using regular expressions to parse your weblogs stored within S3.
CREATE EXTERNAL TABLE accesslog (
ipaddress STRING,
...
)
ROW FORMAT
SERDE 'org.apache.hadoop.hive.serde2.RegexSerDe'
WITH SERDEPROPERTIES (
"input.regex" = '^(\S+) (\S+) (\S+) \[([\w:/]+\s[+\-]\d{4})\] \"(\S+) (\S+) (\S+)\" (\d{3}) (\d+) \"(.)\" \"(.)\" (\S+) \"(\S+), (\S+), (\S+), (\S+)\"'
)
LOCATION
"/mnt/mdl/accesslogs/"
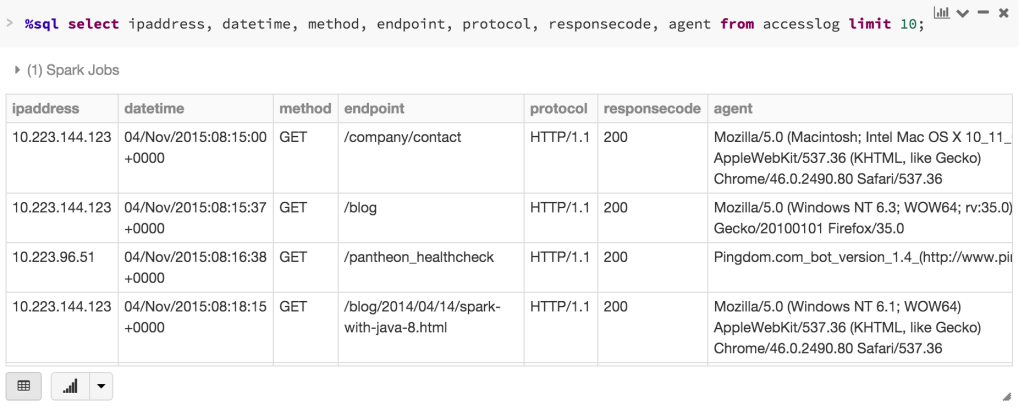
With the creation of this table, you can execute a Spark SQL query against this data similar to how you would query any other structured data source. Note, the underlying source of this external table is still your log files that you had stored in S3.
In addition to Spark’s in-memory computing, Databricks makes use of the blazingly fast SSD-backed EC2 R3 instances to provide both in-memory and file caching for faster processing and querying. Prior to creating your table, you can create a Databricks File System mount (as denoted by /mnt in the above Spark SQL code) by following the Databricks Data Import How-To Guide to leverage both SSDs and Tachyon in-memory file system.
Step 2: Identify Geo-location information based on IP address
Often included within weblogs are the client IP addresses that can potentially provide you the approximate location of the site visitor. While multiple methods exist to convert IP address to geolocation information, a quick (non-production) way to do this is to make use of an external web service such as https://ipstack.com/. In the sample code below, we are making a web service call directly from Spark:
Obtain the unique agents from the accesslog table
ipaddresses = sqlContext.sql("select distinct ip1 from \
accesslog where ip1 is not null").rdd
getCCA2: Obtains two letter country code based on IP address
def getCCA2(ip):
url = 'https://ipstack.com/csv/' + ip
str = urllib2.urlopen(url).read()
return str.split(",")[1]
Loop through distinct IP addresses and obtain two-letter country codes
mappedIPs = ipaddresses.map(lambda x: (x[0], getCCA2(x[0])))
Using Python and Spark, the first line of code creates the ipaddresses RDD which uses a sqlContext to store the distinct IP addresses from the accesslog external table (based on the access log data stored on S3). The subsequent getCCA2 function is the call to the http://freegeoip.net web service which receives an IP address and returns (in this case) a comma-delimited message containing the geo-location information. The final call of this code snippet is a map function which allows Spark to loop through all of the unique IP addresses stored within ipaddresses RDD and make the web service call defined by getCCA2. This is similar to a for loop, except this workload is partitioned and distributed to many nodes in your Spark cluster to be completed in parallel.
Step 3: Making sense of Browser and OS information
The user agent string (or agent) is part of a browser (or client) header when visiting a web page. This header often contains interesting information such as what browser, operating system, or device that users are using to view your ads. For example, the on-demand webinar How Celtra Optimizes its Advertising Platform with Databricks discussed how Celtra was able to troubleshoot different devices viewing their ads by analyzing their web and troubleshooting logs.
Below is an example user agent string which reveals an operating system (Mac OSX 10.11 El Capitan) and browser (Google Chrome 46.0.2490.80).
Mozilla/5.0 (Macintosh; Intel Mac OS X 10_11_0) AppleWebKit/537.36 (KHTML, like Gecko) Chrome/46.0.2490.80 Safari/537.36
Instead of spending time writing custom code to parse this string, Databricks is extensible and allows you to include external packages such as the user-agents via PyPI. Together with PySpark UDFs, you can add columns to an existing Spark DataFrame combining a python function and Spark SQL.
from user_agents import parse
from pyspark.sql.types import StringType
from pyspark.sql.functions import udf
Create UDFs to extract out Browser Family information
def browserFamily(ua_string) : return parse(ua_string).browser.family
udfBrowserFamily = udf(browserFamily, StringType())
Obtain the unique agents from the accesslog table
userAgentTbl = sqlContext.sql("select distinct agent from accesslog")
Add new columns to the UserAgentInfo DataFrame containing browser information
userAgentInfo = userAgentTbl.withColumn('browserFamily', \
udfBrowserFamily(userAgentTbl.agent))
Register the DataFrame as a table
userAgentInfo.registerTempTable("UserAgentInfo")
The browserFamily function utilizes the user-agents PyPI package parse function which takes an user agent string input and returns the browser Family information (e.g. Firefox, Safari, Chrome, etc.). The subsequent udfBrowserFamily UDF defines the output of the browserFamily function as StringType() so it can be properly internalized within a subsequent DataFrame.
The userAgentTbl is a Spark DataFrame that contains the unique agents from the accesslog table from Step 1. To add the browser family information as defined by the agent string, the new UserAgentInfo DataFrame is created by using .withColumn defining the column name (browserFamily) and the string datatype output from udfBrowserFamily.
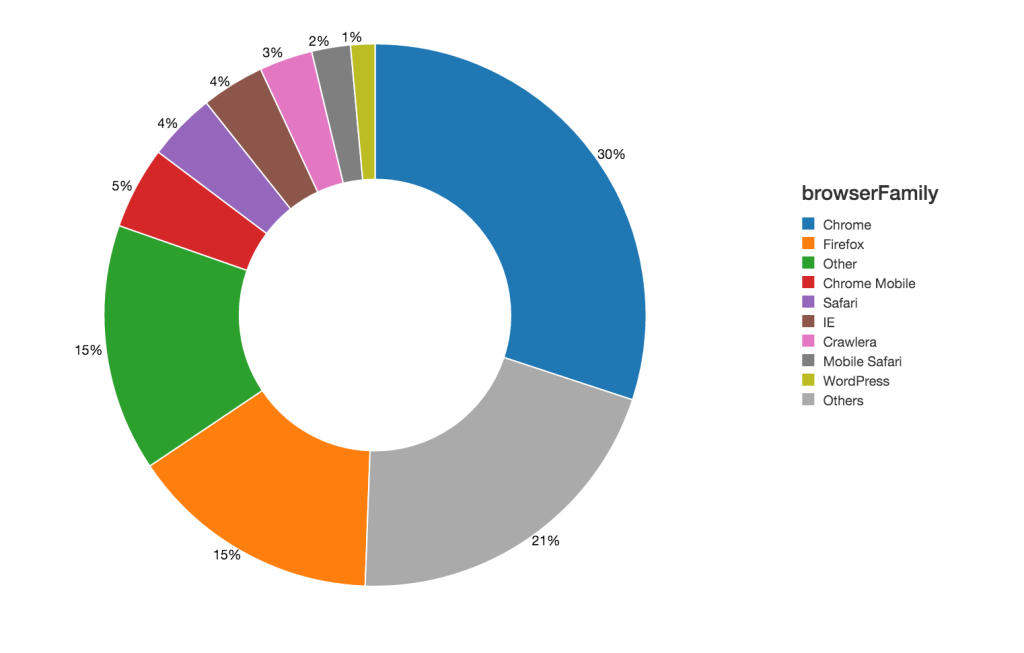
Once the DataFrame has been created, you can execute a Spark SQL query within the same Python notebook. For example, to see the breakdown by browserFamily within the UserAgentInfo table, execute the following query in your notebook:
%sql
SELECT browserFamily, count(1)
FROM UserAgentInfo
GROUP BY browserFamily
Within the same notebook, you will see the following donut chart:
Step 4: Complete our basic preparation
To put this all together, we will do the following tasks to complete our basic preparation of these web access logs for analysis:
Define function (converts Apache web log time)
def weblog2Time(weblog_timestr): …
Define and Register UDF
udfWeblog2Time = udf(weblog2Time, DateType())
sqlContext.registerFunction("udfWeblog2Time", lambda x: weblog2Time(x))
Create DataFrame
accessLogsPrime = sqlContext.sql("select hash(a.ip1, a.agent) as UserId, m.cca3, udfWeblog2Time(a.datetime) as LogDateTime,... from accesslog join UserAgentInfo u on u.agent = a.agent join mappedIP3 m on m.ip = a.ip1")
The weblog2Time function performs the task of converting the Apache web log time to an ISO-8601 date format. Within the sqlContext, to unique-ify the site visitors (in this case we lack a cookieId that anonymously identifies users), we can combine IP address and the user agent string as the UserId. To combine back to the browser and OS information as well as country (based on IP address) information, the same sqlContext includes a join statement to the UserAgentInfo and mappedIP3 tables.
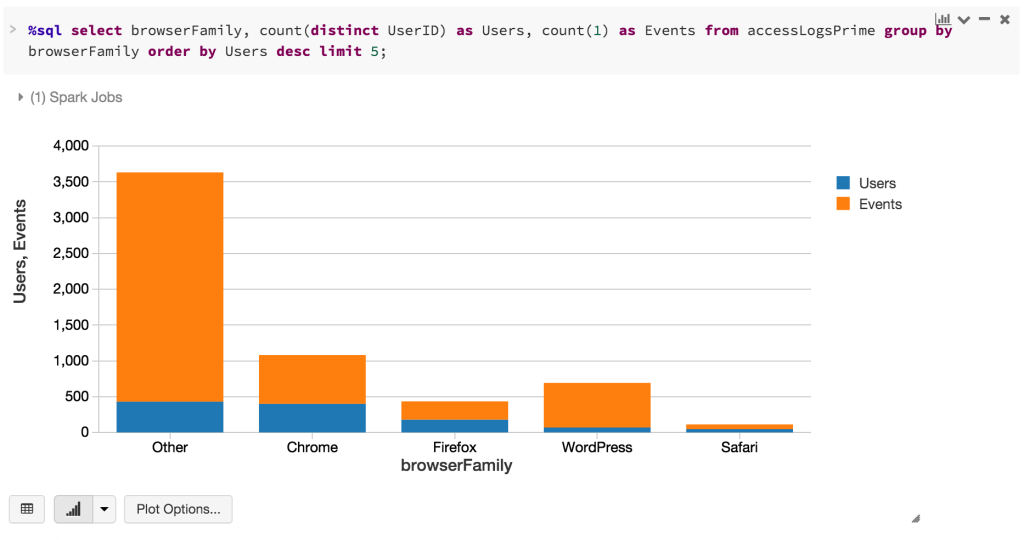
Visualize This!
With your preparation completed, you can quickly analyze and visualize your data, all from within the same notebook. For example, with the browser information included within the accesslogprime DataFrame, we can quickly identify the top 5 browsers by users and events.
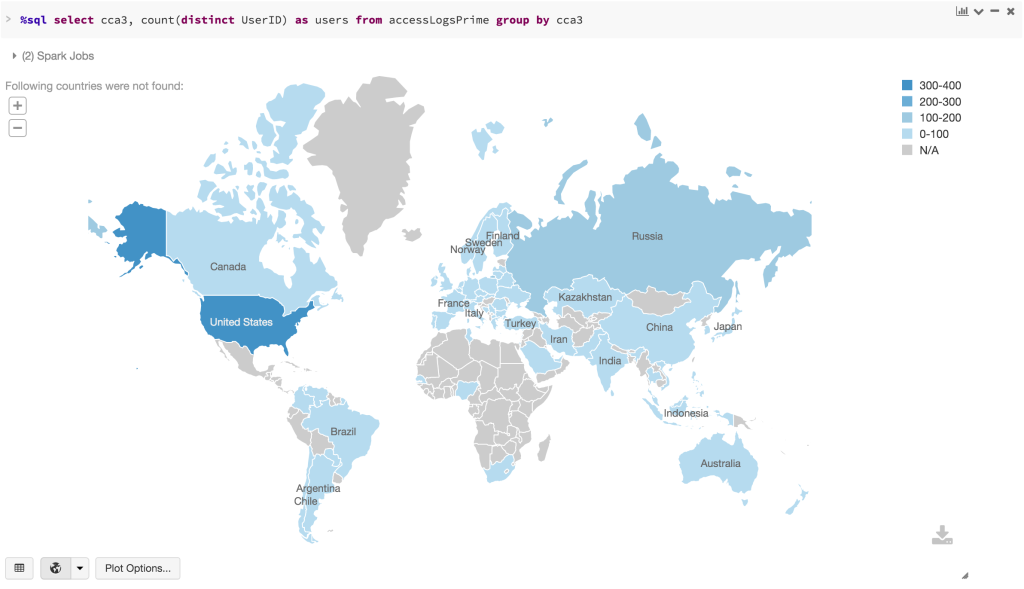
In the same Python notebook, we can also identify where site visitors are coming from based on their IP addresses as noted in the map below:
Conclusion
Databricks allows you to quickly jump start your advertising analysis. For more information about advertising platform optimization, check out the on-demand webinar How Celtra Optimizes Its Advertising Platform with Databricks.
For a free trial of Databricks, please sign up at Try Databricks.
Get the latest posts in your inbox
Subscribe to our blog and get the latest posts delivered to your inbox.