Analyse One Year of Radio Station Songs Aired with Apache Spark, Spark SQL, Spotify, and Databricks
Free Edition has replaced Community Edition, offering enhanced features at no cost. Start using Free Edition today.
<a href="https://www.databricks.com/resources/ebook/rise-data-lakehouse?itm_data=analyseradiostationsongapachesparksql-blog-riselakehousebook">Read Rise of the Data Lakehouse</a> to explore why lakehouses are the data architecture of the future with the father of the data warehouse, Bill Inmon.</p><hr><p><em>This is a guest blog from </em><a href="https://www.linkedin.com/in/paleclercq/"><em>Paul Leclercq</em></a><em>, a data engineer, sports and music lover and was originally published on his </em><a href="https://medium.com/@polomarcus/analyze-one-year-of-radio-station-songs-aired-with-sql-spark-spotify-and-databricks-835fcf73df6"><em>personal blog</em></a><em>.</em></p><p><a class="dbce_cta" href="https://databricks-prod-cloudfront.cloud.databricks.com/public/4027ec902e239c93eaaa8714f173bcfc/6937750999095841/1807085967979471/6197123402747553/latest.html" target="_blank">Try this notebook in Databricks</a></p><p>Whenever I drive or code, I listen to music, as this happens a lot, and in order to find new songs, I listen to the radio or I listen to Spotify’s discover weekly playlist, which made me like Mondays (because they release it every Monday).</p><p>A french <em>old-school</em> institute called Mediamétrie analyzes radio stations’ songs. Since I have seen their study (which I can’t find anymore) some years ago, I have been obsessed with creating my own.</p><figure><img class="size-full wp-image-10537" style="width:310px;" src="https://www.databricks.com/wp-content/uploads/2017/03/mediametrie.png" alt height="167"><figcaption>Mediametrie’s image you can find online → old school</figcaption></figure><p>This article will present the year 2016 for 4 main french radio stations through <em>fun</em> SQL queries, then <strong>we will connect each song to the Spotify API</strong> to create the radio stations’ musical profile.</p><p>We will use the <a href="https://community.cloud.databricks.com/login.html">Databricks community version</a> to visualize our data. <a href="https://databricks-prod-cloudfront.cloud.databricks.com/public/4027ec902e239c93eaaa8714f173bcfc/6937750999095841/1807085967979471/6197123402747553/latest.html"><strong>All SQL queries and all results are available on this notebook.</strong></a> <em>It’s the “backstage” of this article, where the magic happens if we can say.</em></p><p><em><strong>Protip:</strong> don’t miss the bonuses at the end of the article</em></p><h2>Radio stations introduction</h2><p>We all have a favorite radio station; mine is <a href="https://en.wikipedia.org/wiki/Radio_Nova_%28France%29" rel="nofollow">Radio Nova</a> for its diversity, its humor, and as a hip hop fan, this is the only national radio where we can hear <em>listenable</em> hip hop songs.</p><p><img class="aligncenter size-full wp-image-10539" style="width:450px;" src="https://www.databricks.com/wp-content/uploads/2017/03/Radio-Nova.png" alt="Nova Logo" height="189"></p><p>Radio nova had <strong>1,4% of the audience in September 2016</strong> (PDF to download from Mediametrie).</p><figure><a href="https://www.databricks.com/wp-content/uploads/2017/03/top-5-broadcasted-songs-radio-nova-2016.png" data-lightbox><img class="size-full wp-image-10570" style="width:755px;" src="https://www.databricks.com/wp-content/uploads/2017/03/top-5-broadcasted-songs-radio-nova-2016.png" alt="Most 5 broadcasted songs on Nova" height="163"></a><figcaption>Most 5 broadcasted songs on Nova in 2016</figcaption></figure><p>In order to see how a radio becomes number 1, we are also going to analyze the number 1 music radio called <a href="https://www.nrj.fr/" rel="nofollow"><strong>NRJ</strong></a> which has 10.8% of the audience and 2 others: <strong>Virgin</strong> (5%) which, we’ll see, sounds like NRJ, and <strong>Skyrock</strong> (6%), <em>don’t mind the name it’s a rap radio… haha</em></p><figure><a href="https://www.databricks.com/wp-content/uploads/2017/03/top-5-broadcasted-songs-nrj-2016.png" data-lightbox><img class="size-full wp-image-10569" style="width:759px;" src="https://www.databricks.com/wp-content/uploads/2017/03/top-5-broadcasted-songs-nrj-2016.png" alt="Most 5 broadcasted songs on NRJ" height="161"></a><figcaption>Most 5 broadcasted songs on NRJ in 2016</figcaption></figure><p>The main question is, after we compared these radios, should we give to Radio Nova the tips of how to be the number one based on NRJ’s analyze? <strong>What do you say, Nova? Learn from the best, right?!</strong></p><h2>Getting the Radio’s songs data</h2><figure><img class="size-full wp-image-10576" style="width:551px;" src="https://www.databricks.com/wp-content/uploads/2017/03/what-was-this-title-page-radio-nova.png" alt="Radio Songs Title" height="351"><figcaption>“What was this title?” Nova page</figcaption></figure><p>In order to extract the songs lists, artist, song title and timestamp, we are going to parse each Radio “What was this song?” HTML pages, except for Skyrock, which has a handy RESTful web service.</p><p>Every song extracted will be converted into this Song class, to query them easily with (Spark) SQL:</p><pre><code class="language-plaintext">Song(timestamp:Int, humanDate:Long, year:Int, month:Int, day:Int, hour:Int, minute: Int, artist:String, allArtists: String, title:String) </code></pre><p>In 2016 300K broadcasts were collected:</p><ul><li>Nova: <strong>95K broadcasts of 5000 different songs</strong></li><li>NRJ: <strong>50K broadcasts of 800 different songs</strong></li><li>Virgin: <strong>60K broacasts of 1200 different songs</strong></li><li>Skyrock: <strong>100K broadcasts of 1000 different songs</strong></li></ul><p>Every song is stored in a <a href="https://spark.apache.org/docs/latest/sql-programming-guide.html#parquet-files">parquet format</a> to extract only once the data (you’re welcome radios servers :p) and <a href="https://blog.cloudera.com/benchmarking-apache-parquet-the-allstate-experience/">to speed up SparkSQL queries</a>. <em>Btw, if you are interested in the file, I can export it to you in CSV or parquet.</em></p><p>Remember that the best way to speed up (the <a href="https://spark.apache.org/docs/latest/rdd-programming-guide.html#rdd-persistence">Spark doc</a> says often by more than 10x) queries, if you have to use the same SQL table (or Dataset/Dataframe) again and again, is to cache table in memory (<em>Thanks Databricks for the 6Go RAM server!</em>) with the <code>dataframe.cache()</code> method.</p><p>Let’s dive into our analysis now!</p><h2>How many songs by day?</h2><p><em>Some days were not recorded by the radios’ history system, so the real numbers should be a bit higher.</em></p><figure><a href="https://www.databricks.com/wp-content/uploads/2017/03/station-song-broadcasts-per-day.png" data-lightbox><img class="size-full wp-image-10568" style="width:1682px;" src="https://www.databricks.com/wp-content/uploads/2017/03/station-song-broadcasts-per-day.png" alt="Songs Broadcasted by Day" height="430"></a><figcaption>Songs broadcasted by day</figcaption></figure><p>Fun to see that both radio stations broadcast more songs during summer (if we do not take in consideration the one-week bug of Radio Nova, in blue, in August), this is certainly due to summer holidays. <em>They do a good job all year long, so it’s OK to take some days off, I guess!</em></p><p>We can see that Skyrock and Nova broadcast the same number of songs each day, whereas NRJ and Virgin a bit less, certainly due to more talk shows or untracked DJs night shows.</p><h2>How many different songs by day?</h2><p>The real difference comes from the number of different songs played; see for yourself the number of different tracks per day:</p><figure><a href="https://www.databricks.com/wp-content/uploads/2017/03/station-different-songs-per-day.png" data-lightbox><img class="size-full wp-image-10557" style="width:1541px;" src="https://www.databricks.com/wp-content/uploads/2017/03/station-different-songs-per-day.png" alt="Different Songs by Day" height="396"></a><figcaption>Different songs by day</figcaption></figure><p>More mainstream radios such as <strong>NRJ, Virgin and Skyrock top 100/120 different songs</strong> a day, whereas <strong>Nova is more about 280</strong>. If you want to discover more songs, it’s clearly on Nova.</p><h2>How many different songs by month?</h2><p>If we have a look to the monthly different songs, the gap between radios is even bigger.</p><figure><a href="https://www.databricks.com/wp-content/uploads/2017/03/station-different-songs-per-month.png" data-lightbox><img class="size-full wp-image-10558" style="width:1054px;" src="https://www.databricks.com/wp-content/uploads/2017/03/station-different-songs-per-month.png" alt="Different Songs by Month" height="351"></a><figcaption>Different songs by month in 2016</figcaption></figure><h2>Top 10 played titles by each radio station</h2><p>It’s interesting to see how “hits” are played through the year.</p><p>We can notice summer hits: <a href="https://open.spotify.com/track/0EM0yABJzbFOvZQkfvuvCy" rel="nofollow">Kaytranada</a> for Nova, <a href="https://open.spotify.com/track/6YZdkObH88npeKrrkb8Ggf" rel="nofollow">Enrique Iglesias</a> for NRJ, <a href="https://open.spotify.com/track/27PmvZoffODNFW2p7ehZTQ" rel="nofollow">Kent Jones</a> and <a href="https://open.spotify.com/track/1xznGGDReH1oQq0xzbwXa3" rel="nofollow">Drake</a> for Skyrock and <a href="https://open.spotify.com/track/1ZdWNpOXCJT1nmt40UuxWS" rel="nofollow">Imany</a> and <a href="https://open.spotify.com/track/0cAuqPI1R8RlFsXXWWO039" rel="nofollow">Kungs</a> for Virgin. And also, most broadcasted songs are mostly aired during summer.</p><p>Radio tends to broadcast more songs during summer. So artists play smart here and release their songs between February and June to have more chance to become number one, <em>or to have more people hating their music because they heard it too many times?</em></p><h3>Nova</h3><p><a href="https://www.databricks.com/wp-content/uploads/2017/03/top-songs-nova.png" data-lightbox=" "><img class="aligncenter size-full wp-image-10571" style="width:1733px;" src="https://www.databricks.com/wp-content/uploads/2017/03/top-songs-nova.png" alt="Top 10 songs played by Nova" height="314"></a></p><h3>NRJ</h3><p><a href="https://www.databricks.com/wp-content/uploads/2017/03/top-songs-nrj.png" data-lightbox=" "><img class="aligncenter size-full wp-image-10572" style="width:1566px;" src="https://www.databricks.com/wp-content/uploads/2017/03/top-songs-nrj.png" alt="Top 10 songs played by NRJ" height="281"></a></p><h3>Skyrock</h3><p><a href="https://www.databricks.com/wp-content/uploads/2017/03/top-songs-skyrock.png" data-lightbox=" "><img class="aligncenter size-full wp-image-10573" style="width:1632px;" src="https://www.databricks.com/wp-content/uploads/2017/03/top-songs-skyrock.png" alt="Top 10 songs played by Skyrock" height="274"></a></p><h3>Virgin</h3><p><a href="https://www.databricks.com/wp-content/uploads/2017/03/top-songs-virgin.png" data-lightbox=" "><img class="aligncenter size-full wp-image-10574" style="width:1607px;" src="https://www.databricks.com/wp-content/uploads/2017/03/top-songs-virgin.png" alt="Top 10 songs played by Virgin" height="308"></a></p><h2>Percentage of music by day</h2><p>If we take the average broadcasted songs by day and the mean duration of a song, 3.30 minutes, we can guess the percentage of music by day. The other percentage is likely to be talk shows, advertising or untracked songs.</p><figure><a href="https://www.databricks.com/wp-content/uploads/2017/03/station-percentage-of-music-per-day.png" data-lightbox><img class="size-full wp-image-10565" style="width:740px;" src="https://www.databricks.com/wp-content/uploads/2017/03/station-percentage-of-music-per-day.png" alt="Percentage of Music per Day" height="261"></a><figcaption>Percentage of music per day</figcaption></figure><p>To understand more these percentages, we should see what a normal day is for our analyzed radio stations.</p><h2>What is a typical Monday for our radio stations ?</h2><p>Let’s have a look to the average of number of songs for all radio stations for Mondays.</p><figure><a href="https://www.databricks.com/wp-content/uploads/2017/03/station-average-number-of-tracks-on-monday.png" data-lightbox><img class="size-full wp-image-10551" style="width:1415px;" src="https://www.databricks.com/wp-content/uploads/2017/03/station-average-number-of-tracks-on-monday.png" alt="Average Number of Songs for Mondays" height="375"></a><figcaption>Average number of songs for Mondays</figcaption></figure><p>We can distinguish 2 gaps during <strong>the morning and evening shows</strong> for every radio station. <em>Amazing</em>. More seriously, no discovery here; it’s a known fact that most radios have morning and evening shows during which there is less music and more talk.</p><h2>Advertising time</h2><p>If we recalculate the average percentage of music at noon, when there are no shows for all radio stations, we can estimate the percentage of advertising by radio by hour. We estimate that the radio hosts speak 5 minutes during the whole hour. <em>We have to note that radios may advertise more during prime time when they have a larger audience.</em></p><p>For 60 minutes, we get 7 minutes of advertising time, for Skyrock, to 15 minutes, for Virgin. In details, we have this table:</p><figure><a href="https://www.databricks.com/wp-content/uploads/2017/03/station-average-time-spent.png" data-lightbox><img class="size-full wp-image-10555" style="width:1104px;" src="https://www.databricks.com/wp-content/uploads/2017/03/station-average-time-spent.png" alt="Average Minute of Music and Advertising for Every Monday at Noon" height="136"></a><figcaption>Average minute of music and advertising for every Monday at noon</figcaption></figure><h2>Radios brainwashing?</h2><p>An annoying feeling we have sometimes with radios is <strong>we keep listening to the same songs over and over</strong>. As we are men and women who believe in science and not in our instinct, we are going to use basic <strong>statistics to verify this weird feeling</strong>.</p><h3>How many times is the same song aired on the same day?</h3><figure><a href="https://www.databricks.com/wp-content/uploads/2017/03/station-average-rebroadcast.png" data-lightbox><img class="size-full wp-image-10552" style="width:690px;" src="https://www.databricks.com/wp-content/uploads/2017/03/station-average-rebroadcast.png" alt height="237"></a><figcaption>Average number of times the same song is broadcasted by day</figcaption></figure><p>These pie charts below tell us a lot about radio stations’s habits; that is, more mainstream radios such as Virgin, NRJ or Skyrock are more about to broadcasts the same songs multiple times.</p><figure><a href="https://www.databricks.com/wp-content/uploads/2017/03/station-song-broadcast-frequency.png" data-lightbox><img class="size-full wp-image-10567" style="width:1170px;" src="https://www.databricks.com/wp-content/uploads/2017/03/station-song-broadcast-frequency.png" alt height="758"></a><figcaption>How many times is the same song broadcasted?</figcaption></figure><h3>When is the next time we will listen to the same song during the same day?</h3><figure><a href="https://www.databricks.com/wp-content/uploads/2017/03/station-hours-between-same-song.png" data-lightbox><img class="size-full wp-image-10561" style="width:1261px;" src="https://www.databricks.com/wp-content/uploads/2017/03/station-hours-between-same-song.png" alt height="830"></a><figcaption>Minimum difference in hours between the same songs broadcasted on same day</figcaption></figure><p>Again, the most mainstream radios, NRJ, Skyrock and Virgin tend to broadcast the same song most often for 2/3 hours since it was first aired. Nova’s value is more about 7/8 hours.</p><p>While we have different distribution, the average for our 4 radios is between 7 and 8 hours.</p><p><a href="https://www.databricks.com/wp-content/uploads/2017/03/station-average-hours-between-same-song.png" data-lightbox=" "><img class="aligncenter size-full wp-image-10549" style="width:811px;" src="https://www.databricks.com/wp-content/uploads/2017/03/station-average-hours-between-same-song.png" alt="Table showing the average number of hours between rebroadcasting the same song" height="140"></a></p><h3>How many new songs are added and when?</h3><p>“New songs” means songs that are not yet broadcasted in 2016.</p><figure><a href="https://www.databricks.com/wp-content/uploads/2017/03/station-new-songs-per-month-distribution.png" data-lightbox><img class="size-full wp-image-10563" style="width:1356px;" src="https://www.databricks.com/wp-content/uploads/2017/03/station-new-songs-per-month-distribution.png" alt height="258"></a><figcaption>New songs distributed by month</figcaption></figure><p>If we look at the average after April 2016, we see that Nova is ahead, but don’t forget that Nova plays 2500 different songs each month, so it’s normal, statistically speaking.</p><figure><a href="https://www.databricks.com/wp-content/uploads/2017/03/station-average-new-songs-per-month.png" data-lightbox><img class="size-full wp-image-10550" style="width:639px;" src="https://www.databricks.com/wp-content/uploads/2017/03/station-average-new-songs-per-month.png" alt height="242"></a><figcaption>Average new songs by month</figcaption></figure><p>New songs are distributed equally along the week for all radios.</p><p><a href="https://www.databricks.com/wp-content/uploads/2017/03/nrj-and-nova-new-songs-per-weekday.png" data-lightbox=" "><img class="aligncenter size-full wp-image-10538" style="width:843px;" src="https://www.databricks.com/wp-content/uploads/2017/03/nrj-and-nova-new-songs-per-weekday.png" alt="NRJ and Nova - new songs per weekday" height="393"></a></p>
Common songs between radio stations
On the table below, we can see NRJ has 25% of common songs with Virgin and 12% with Skyrock.
Virgin has 18% with NRJ while Skyrock has 9% of common songs with NRJ.

Nova has a few similar songs with the others radio; there are mostly legendary artists such as Bob Marley, Daft Punk, Aloe Blacc, Kavinsky, Beyoncé… If you are interested by the full list look for the “Similar songs between radios” cell in the “backstage” AKA the blog article’s Databricks notebook.
Our 4 radio stations are different, for sure, but do they have common songs among them? Surprisingly the answer is yes.
I would classify these songs as songs that everybody likes; you can play them at your party without any stress of being booed.
If we use a visualization for our previous table, it will look like this: the blue bar is the similar songs, the orange and the green bar are the total of different songs.

What are the secrets to be #1 ?
We have analyzed 4 radio stations based on the artist name, the title name and the day and time the songs were broadcasted. Beside letters and numbers, these 3 values mean nothing, if we want to make a deeper analysis, we have to learn more about the songs played: how popular is the song right now? what is the genre of the song? How many followers does the artist have?
Hopefully, by connecting each song to the Spotify API we will get a lot of data we can play with:
In 2016, we have collected 8000 different songs from the radios, so to get the artist, the track and the tracks’ audio features from the Spotify API we have to make:
From HTTP STATUS DOGS
That’s a lot. Plus, Spotify has a limit of request in time, so we have got to do it slowly, 20 request every 2 seconds, why not you know.
BUT, with this slow rate one thing I didn’t plan is we could see the number of followers change when we requested a song’s artist, as most artists have multiple songs been broadcasted, the artist information was asked from 2 to 10 times. No problemo, right? No…This will mess up our SQL join between artist and track data later, just because the DISTINCT on artists information were fake due to followers.total
I have to say this led me to craziness, because I had more songs after my join than before haha
Spotify API Stats from https://developer.spotify.com/my-applications
Songs Popularity By Radio
Definition by Spotify
The popularity is calculated by algorithm and is based, in the most part, on the total number of plays the track has had and how recent those plays were.

No surprises here, mainstream radios NRJ, Virgin or Skyrock, tend to play more popular songs; that’s why I use the term mainstream, clever, right?

But the real question is: was the song popular before it was broadcasted on the radio?
Audio features
The Spotify API gives audio features extracted from the song’s sound waves, thanks to these we can display a musical profile of each radio:
In my opinion, the most meaningful audio features are:
- danceability describes how suitable a track is for dancing based on a combination of musical elements including tempo, rhythm stability, beat strength, and overall regularity.
- energy is a measure from 0.0 to 1.0 and represents a perceptual measure of intensity and activity. Typically, energetic tracks feel fast, loud, and noisy.
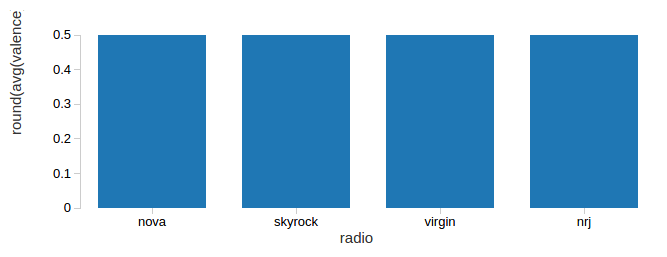
- valence describes the musical positiveness conveyed by a track. Tracks with high valence sound more positive (e.g. happy, cheerful, euphoric), while tracks with low valence sound more negative (e.g. sad, depressed, angry).
Let’s see their average and their distribution, as a average alone can be sometimes misleading, among the radios’ tracks. As Nova got more different songs than the others, we are going use percentage to compare our radios to add more context to our stats.
If you have read my Facebook Interview Journey, you know this is where I failed during my SQL interview, this code is specially for you, dear Mr. Interviewer, no hard feelings though :p
Brilliant SQL code (by @polomarcus
Energy

Mainstream radios tend to play more energetic songs, I guess they are easier to listen to? Some examples of song with a lot of energy are We Are Your Friends - JUSTICE, Steppin’ Stone - Davy Jones, and of course, the classics from Jerk It Out — Caesars, I’ve first heard it while playing SSX3 on GameCube 8)
Danceability
This chart tells us both radio broadcasts with the same kind of danceable songs. Some examples of danceable songs are Trick Me — Kelis, Around the World — Daft Punk or Anaconda — Nicki Minaj.
Valence / Positiveness

Same as the danceability, both radio broadcasts show the same kind of positive tracks. Some examples: September — Earth Wind & Fire,
Ska-Boo-Da-Ba — The Skatalites, or Hey Ya! — OutKast.
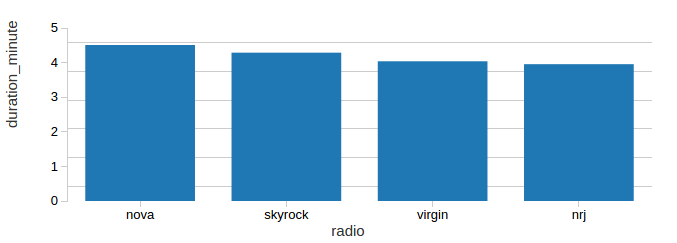
Two others interesting data points, which are not Spotify (Echo Nest) specific, are the BPM (beats per minute) and the songs duration.
Tempo / Beats per minute

Duration

Nova seems to be a bit different from the other radios by playing shorter or longer tracks. Virgin, NRJ and Skyrock are really into 3-minute tracks.
When I first saw this graph, I couldn’t help myself to think about this Hocus Pocus’ song called “Voyage Immobile” (motionless journey) and this sentence about our un-diversified musical environment:
“Je ne voyais que blocs longs de 3 minutes taillé dans le roc et dans le même but”
“I could only see 3-minute blocks from the same base with the same goal”
Music genres
Spotify got some pretty weird music genres. Have you noticed “post-teen pop”, “pop christmas”, pop songs you listen during christmas I guess? haha
We can clearly see that NRJ and Virgin, which are very alike, are more about pop/dance/electro music; their top 3 genres are: pop, dance pop and tropical house. Nova is about soul, funk and indie music, and Skyrock is more about rap, dance and pop.
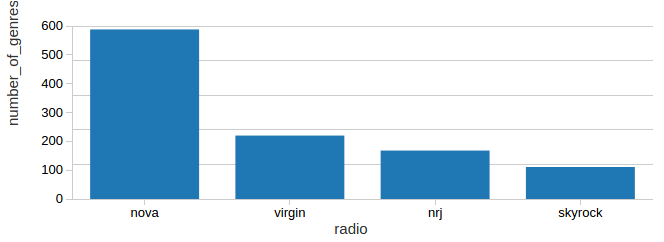
Hip hop genres
Skyrock is famous for its motto “1st on Rap”. Let’s compare Hip hop/Rap genres (genres with “rap”, “hip” or “hop” inside the name) with the others radios.

OK, that’s a close match between Skyrock and Nova. Let’s compare the internal hip hop genres now.
I don’t really care about genres, but there is a lot of confusion between Hip hop, which is a culture, and rap, which is the actual fact of rapping; if you want to learn more, check this Wikipedia Chapter, I also recommend the excellent Netflix’s documentary “Evolution of Hip Hop”

Nova, in orange, is more about indie/alternative/undergroup hip hop music, and Skyrock, in blue, is really more into French rap/trap/hiphop and also popular rap. So let’s fix Skyrock’s motto by “1st on French rap” haha.
Music classifier for Radios’ selection idea
In my last article, I explained how to create your own music recommendation system thanks to these audio features.
A fun project (the link is a tribute to the Scala Guru Martin Odersky, he tends to say too many times that his Scala exercises are fun whereas they are brain melt haha) would be to create an algorithm that will help music selectors to find radios style’s songs.
Spotify recommendation system
Spotify’s system is not only based on the audio features we saw earlier. It also analyzes what others similar users listen to. This slide contains a nice schema that explains their whole system.
What’s next?
Thanks to this project, I have built solid foundations to query the Spotify API in Scala; process it thanks to Spark SQL, and visualize it thanks to Databricks. I think more projects are about to come, plus Spotify has just released, March 2017, this new endpoint “Recently Played Tracks” and ideas are coming.
Databricks pros and cons
Pros
- Community Edition with 6Go RAM server
- Awesome and easy-to-use Data Viz
Cons (or more, what can be better)
- Can only visualize a maximum of 10 elements when using a GROUP BY; the others elements go to one category called “Others”
- Not possible to choose the color of an entity, so a Radio can be blue on a graph and red on another; it can be sometimes confusing
- Cannot export graph as iframe, so we have to export pictures from the interactive graphs
- Modify SQL on the Data Viz interface
Thanks
Databricks, for their awesome platform.
Spotify, for their easy-to-use API and their human-readable documentation
Radio Nova for being a top music selecta, I would not listen to the same music that I listen to today without you.
Marc H’LIMI, Radio Nova’s advisor, for our exchanges
Pierre Trussart, engineer and DJ, Benjamin Thuillier, scala rockstar, Nicolas Duforet, data science master, Justine Mouron, engineer.
My friends for hearing me talking about this project too often.
Bonus — Spotify Playlists
To thank for reading, I created 4 playlists of the most ~200 songs broadcasted sorted by the number of broadcast for:

