Guest Blog: How Virgin Hyperloop One Reduced Processing Time from Hours to Minutes with Koalas
by Patryk Oleniuk and Sandhya Raghavan
Watch the on-demand webinar to learn more: From pandas to Koalas: reducing Time-to-Insights for Virgin Hyperloop's Data
At Virgin Hyperloop One, we work on making Hyperloop a reality, so we can move passengers and cargo at airline speeds but at a fraction of the cost of air travel. In order to build a commercially viable system, we collect and analyze a large, diverse quantity of data, including Devloop Test Track runs, numerous test rigs, and various simulation, infrastructure and socio economic data. Most of our scripts handling that data are written using Python libraries with pandas as the main data processing tool that glues everything together. In this blog post, we want to share with you our experiences of scaling our data analytics using Koalas, achieving massive speedups with minor code changes.
As we continue to grow and build new stuff, so do our data processing needs. Due to the increasing scale and complexity of our data operations, our pandas-based Python scripts were too slow to meet our business needs. This led us to Spark, with the hopes of fast processing times and flexible data storage as well as on-demand scalability. We were, however, struggling with the "Spark switch" - we would have to make a lot of custom changes to migrate our pandas-based codebase to PySpark. We needed a solution that was not only much faster, but also would ideally not require rewriting code. These challenges drove us to research other options and we were very happy to discover that there exists an easy way to skip that tedious step: the Koalas package, recently open-sourced by Databricks.
As described in the Koalas Readme,
The Koalas project makes data scientists more productive when interacting with big data, by implementing the pandas DataFrame API on top of Apache Spark. (...) Be immediately productive with Spark, with no learning curve, if you are already familiar with pandas. Have a single codebase that works both with pandas (tests, smaller datasets) and with Spark (distributed datasets).
In this article I will try to show that this is (mostly) true and why Koalas is worth trying out. By making changes to less than 1% of our pandas lines, we were able to run our code with Koalas and Spark. We were able to reduce the execution times by more than 10x, from a few hours to just a few minutes, and since the environment is able to scale horizontally, we’re prepared for even more data.
Quick Start
Before installing Koalas, make sure that you have your Spark cluster set up and can use it with PySpark. Then, simply run:
pip install koalas
or, for conda users:
conda install koalas -c conda-forge
Refer to Koalas Readme for more details.
A quick sanity check after installation:
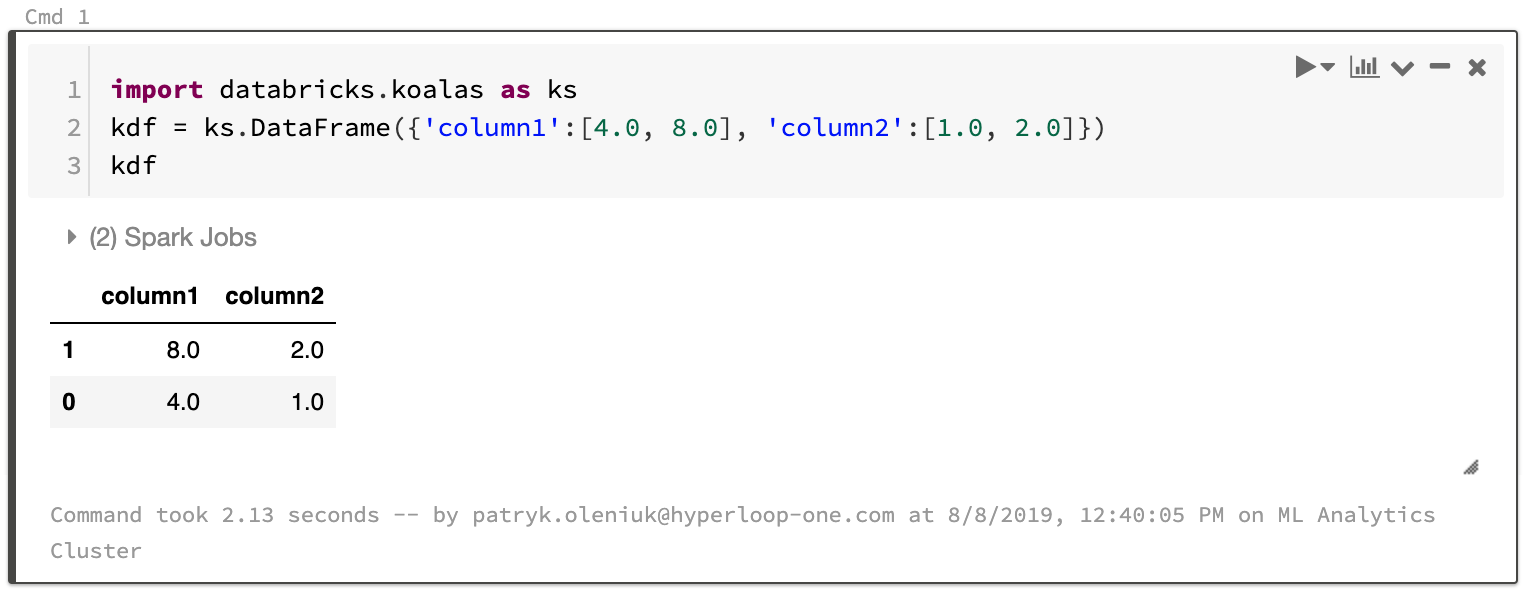
As you can see, Koalas can render pandas-like interactive tables. How convenient!
Example with basic operations
For the sake of this article, we generated some test data consisting of 4 columns and parameterized number of rows.
- Disclaimer: this is a randomly generated test file used for performance evaluation, related to the topic of Hyperloop, but not representing our data. The full test script used for this article can be found here: https://gist.github.com/patryk-oleniuk/043f97ae9c405cbd13b6977e7e6d6fbc .
We'd like to assess some key descriptive analytics across all pod-trips, for example: What is the trip time per pod-trip?
Operations needed:
- Group by
['pod_id','trip id'] - For every trip, calculate the
trip_timeas last timestamp - first timestamp. - Calculate distribution of the pod-trip times (mean, stddev)
The short & slow ( pandas ) way:
(snippet #1)
The long & fast ( PySpark ) way:
(snippet #2)
The short & fast ( Koalas ) way:
(snippet #3)
Note that for the snippets #1 and #3, the code is exactly the same, and so the "Spark switch" is seamless! For most of the pandas scripts, you can even try to change the import pandas databricks.koalas as pd, and some scripts will run fine with minor adjustments, with some limitations explained below.
Results
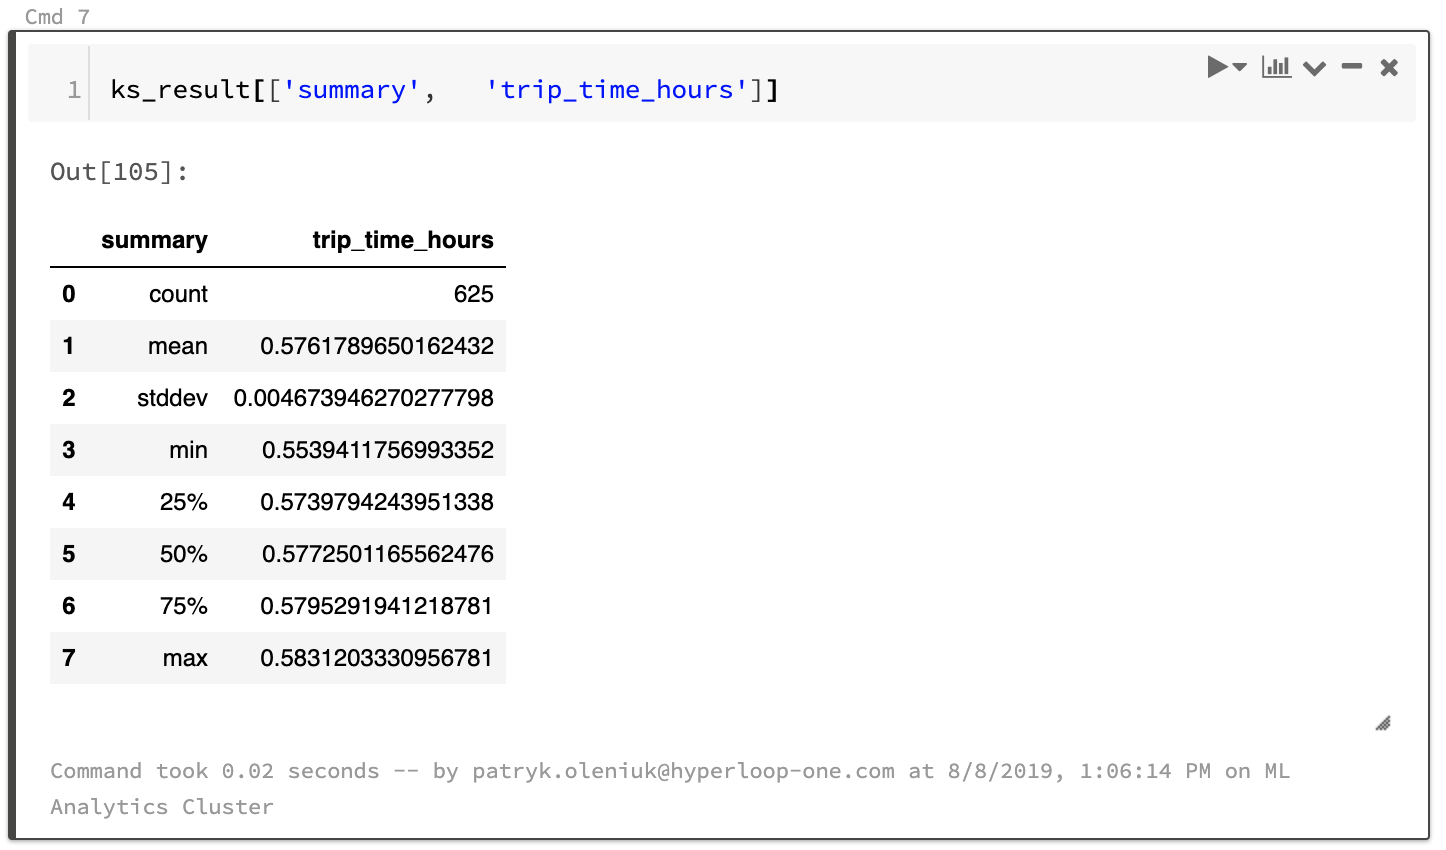
All the snippets have been verified to return the same pod-trip-times results. The describe and summary methods for pandas and Spark are slightly different, as explained here but this should not affect performance too much.
Sample results:
Advanced Example: UDFs and complicated operations
We're now going to try to solve a more complex problem with the same dataframe, and see how pandas and Koalas implementations differ.
Goal: Analyze the average speed per pod-trip:
- Group by
['pod_id','trip id'] - For every pod-trip calculate the total distance travelled by finding the area below the velocity (time) chart (method explained here):
- Sort the grouped df by
timestampcolumn. - Calculate diffs of timestamps.
- Multiply the diffs with the speed - this will result in the distance traveled in that time diff.
- Sum the
distance_travelledcolumn - this will give us total distance travelled per pod-trip. - Calculate the
trip timeastimestamp.last-timestamp.first(as in the previous paragraph). - Calculate the
average_speedasdistance_travelled/trip time. - Calculate distribution of the pod-trip times (mean, stddev).
We decided to implement this task using a custom apply function and UDF (user defined functions).
The pandas way:
(snippet #4)
The PySpark way:
(snippet #5)
The Koalas way:
(snippet #6)
Koalas’ implementation of apply is based on PySpark's pandas_udf which requires schema information, and this is why the definition of the function has to also define the type hint. The authors of the package introduced new custom type hints, ks.DataFrame and ks.Series. Unfortunately, the current implementation of the apply method is quite cumbersome, and it took a bit of an effort to arrive at the same result (column names change, groupby keys not returned). However, all the behaviors are appropriately explained in the package documentation.
Performance
To assess the performance of Koalas, we profiled the code snippets for different number of rows.
The profiling experiment was done on Databricks platform, using the following cluster configurations:
- Spark driver node (also used to execute the pandas scripts): 8 CPU cores, 61GB RAM.
-
15 Spark worker nodes: 4CPU cores, 30.5GB RAM each (sum: 60CPUs / 457.5GB ).
Every experiment was repeated 10 times, and the clips shown below are indicating the min and max times for the executions.
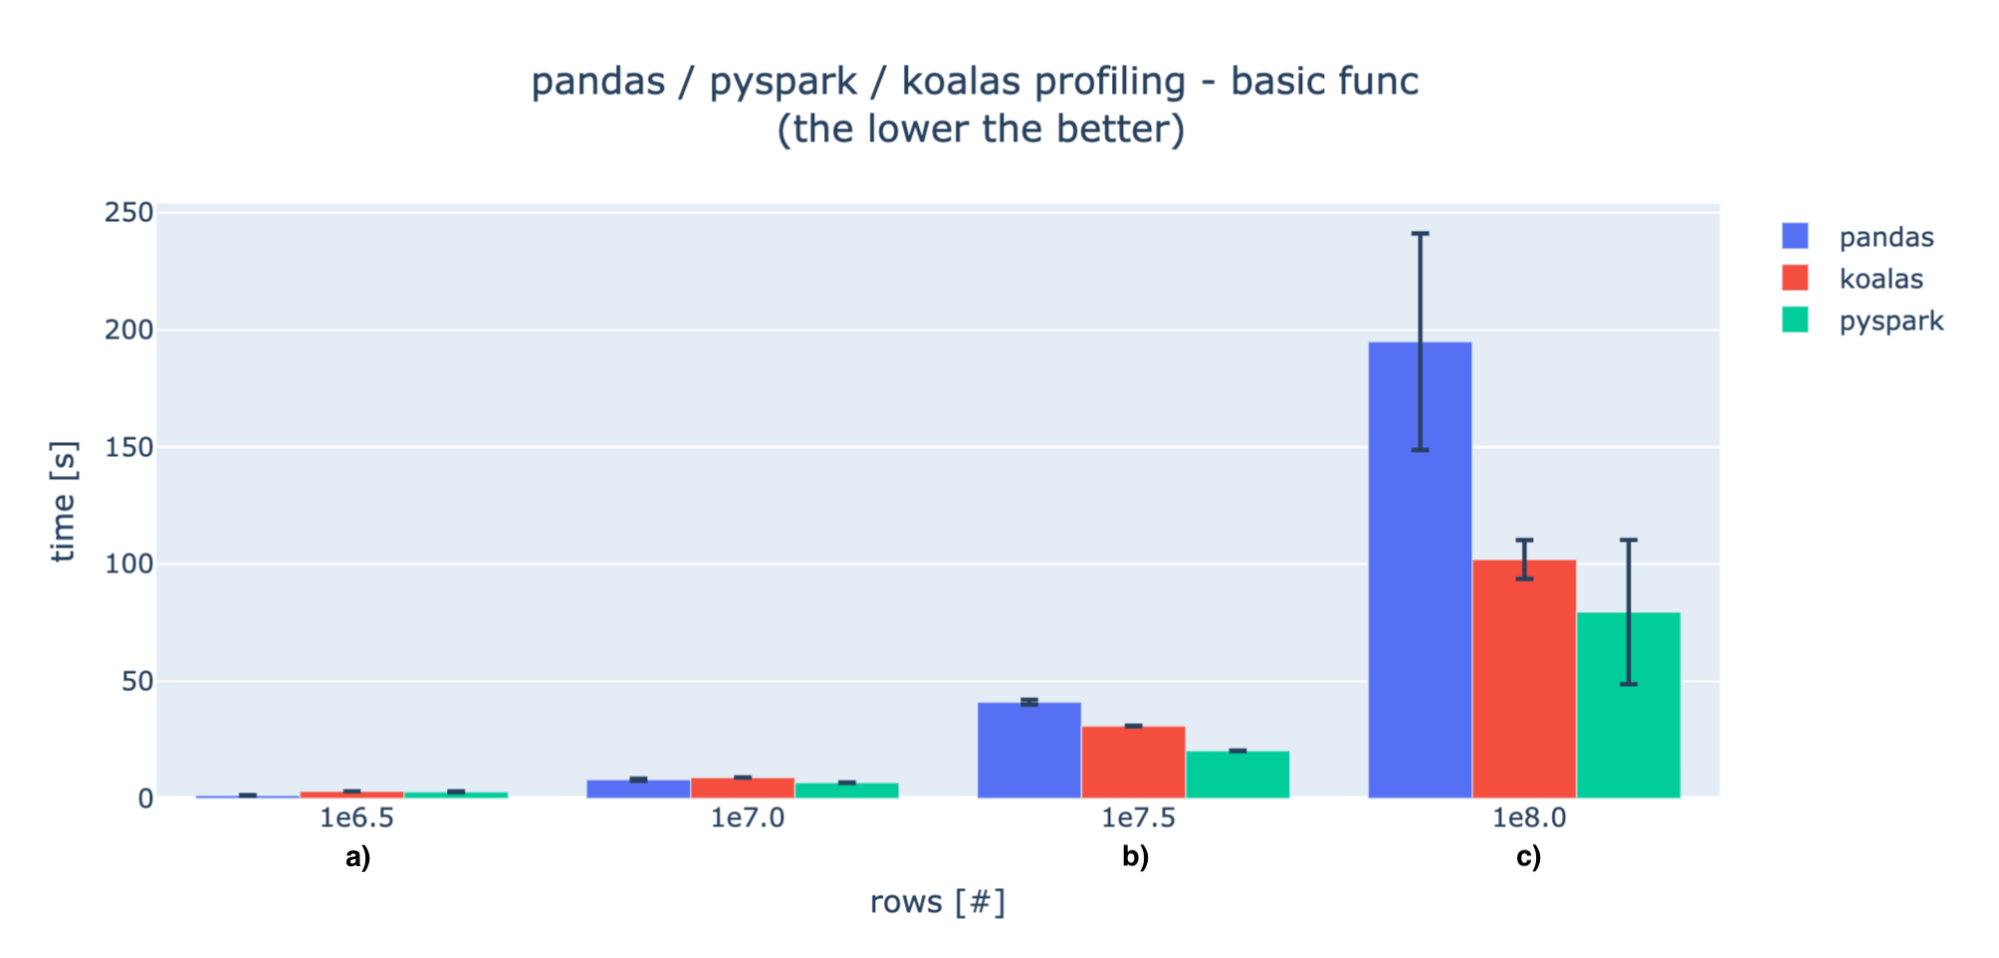
Basic ops
When the data is small, the initialization operations and data transfer are huge in comparison to the computations, so pandas is much faster (marker a). For larger amounts of data, pandas' processing times exceed distributed solutions (marker b). We can then observe some performance hits for Koalas, but it gets closer to PySpark as data increases (marker c).
UDFs
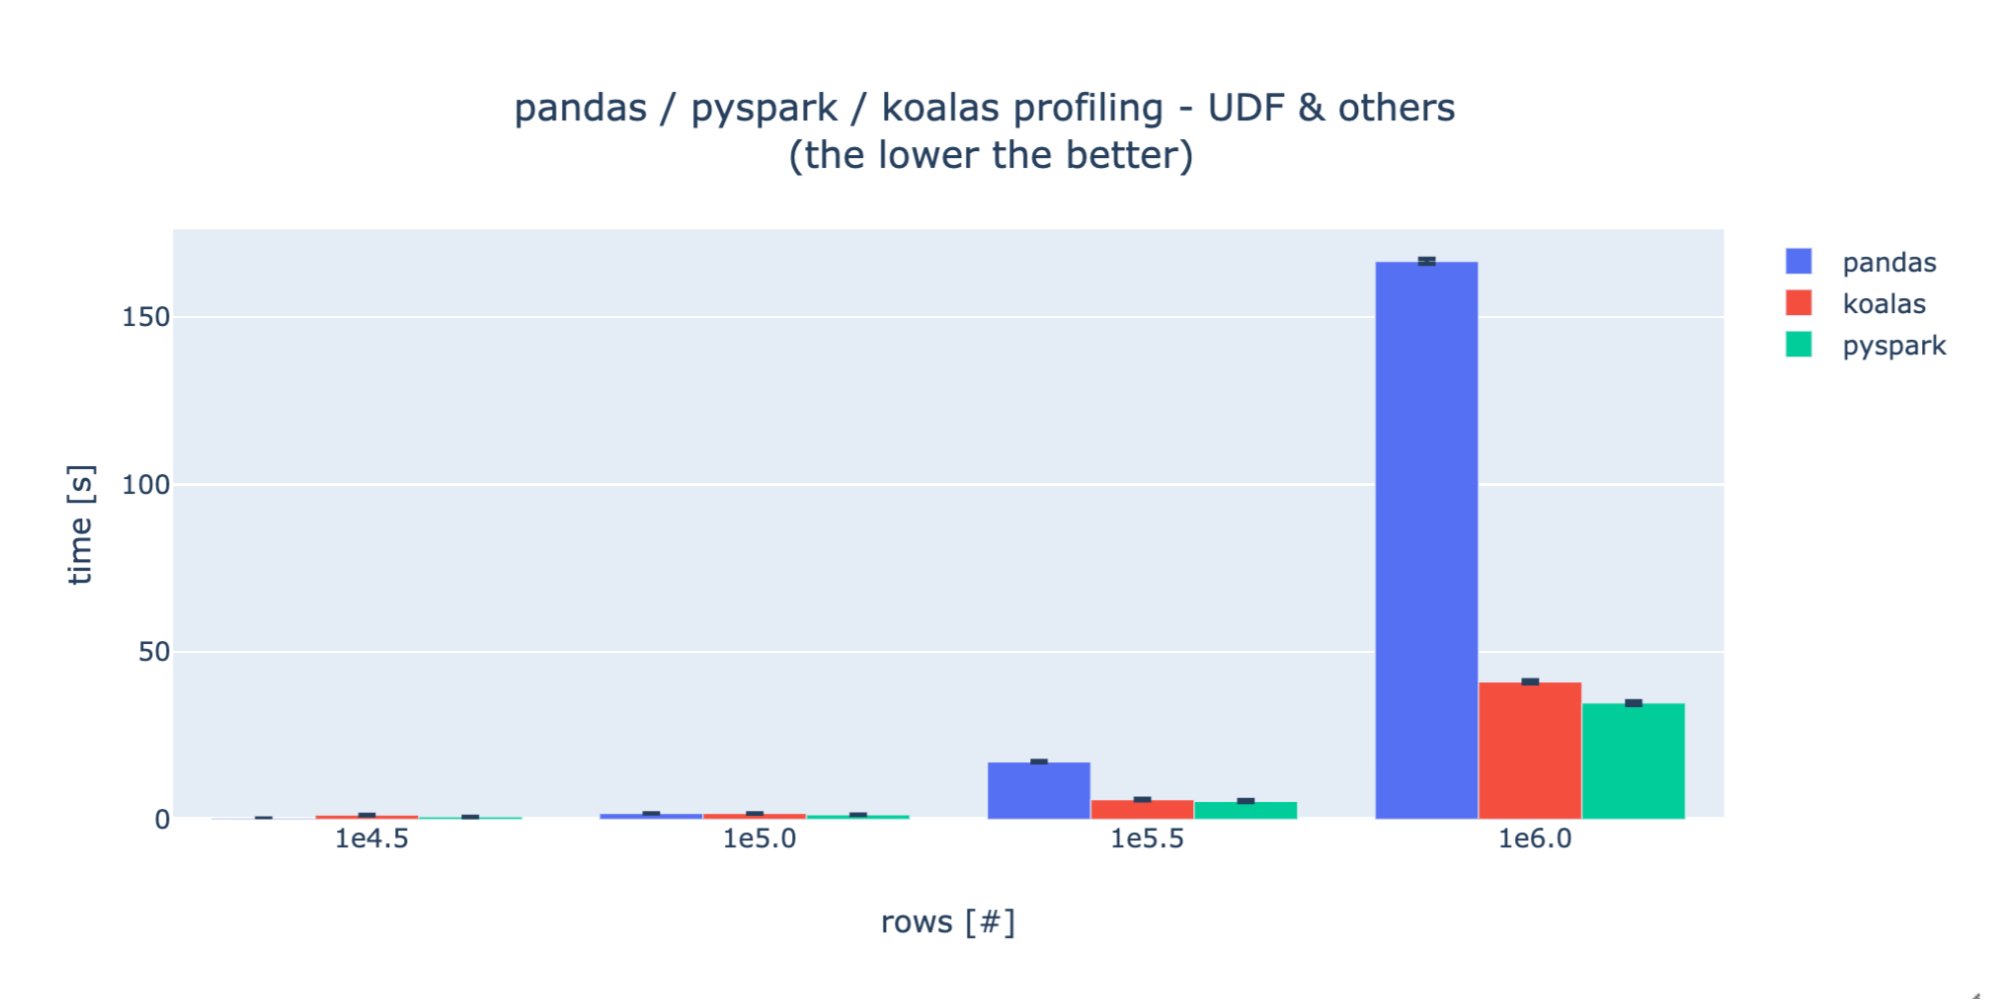
For the UDF profiling, as specified in PySpark and Koalas documentation, the performance decreases dramatically. This is why we needed to decrease the number of rows we tested with by 100x vs the basic ops case. For each test case, Koalas and PySpark show a striking similarity in performance, indicating a consistent underlying implementation. During experimentation, we discovered that there exists a much faster way of executing that set of operations using PySpark windows functionality, however this is not currently implemented in Koalas so we decided to only compare UDF versions.
Discussion
Koalas seems to be the right choice if you want to make your pandas code immediately scalable and executable on bigger datasets that are not possible to process on a single node. After the quick swap to Koalas, just by scaling your Spark cluster, you can allow bigger datasets and improve the processing times significantly. Your performance should be comparable (but 5 to 50% lower, depending on the dataset size and the cluster) with PySpark’s.
On the other hand, the Koalas API layer does cause a visible performance hit, especially in comparison to the native Spark. At the end of the day, if computational performance is your key priority, you should consider switching from Python to Scala.
Limitations and differences
During your first few hours with Koalas, you might wonder, "Why is this not implemented?!" Currently, the package is still under development and is missing some pandas API functionality, but much of it should be implemented in the next few months (for example groupby.diff() or kdf.rename()).
Also from my experience as a contributor to the project, some of the features are either too complicated to implement with Spark API or were skipped due to a significant performance hit. For example, DataFrame.values requires materializing the entire working set in a single node’s memory, and so is suboptimal and sometimes not even possible. Instead if you need to retrieve some final results on the driver, you can call DataFrame.to_pandas() or DataFrame.to_numpy().
Another important thing to mention is that Koalas’ execution chain is different from pandas’: when executing the operations on the dataframe, they are put on a queue of operations but not executed. Only when the results are needed, e.g. when calling kdf.head() or kdf.to_pandas() the operations will be executed. That could be misleading for somebody who never worked with Spark, since pandas does everything line-by-line.
Conclusions
Koalas helped us to reduce the burden to “Spark-ify” our pandas code. If you're also struggling with scaling your pandas code, you should try it too! If you are desperately missing any behavior or found inconsistencies with pandas, please open an issue so that as a community we can ensure that the package is actively and continually improved. Also, feel free to contribute!
Resources
- Koalas github: https://github.com/databricks/koalas
- Koalas documentation: https://koalas.readthedocs.io
- Code snippets from this article: https://gist.github.com/patryk-oleniuk/043f97ae9c405cbd13b6977e7e6d6fbc .
Get the latest posts in your inbox
Subscribe to our blog and get the latest posts delivered to your inbox.