Adventures in the TCP stack: Uncovering performance regressions in the TCP SACKs vulnerability fixes
by Chris Stevens, Michał Switakowski, Ivan Sadikov, Winglung Ngai and Evan Ye
Last month, we announced that the Databricks platform was experiencing network performance regressions due to Linux patches for the TCP SACKs vulnerabilities. The regressions were observed in less than 0.2% of cases when running the Databricks Runtime (DBR) on the Amazon Web Services (AWS) platform. In this post, we will dive deeper into our analysis that determined the TCP stack was the source of the degradation. We will discuss the symptoms we were seeing, walk through how we debugged the TCP connections, and explain the root cause in the Linux source.
As a quick note before we jump in, Canonical is working on an Ubuntu 16.04 image that resolves these performance regressions. We plan to update the Databricks platform once that image is available and has passed our regression tests.
A failing benchmark
We were first alerted when one of our benchmarks became 6x slower. The regression appeared after upgrading the Amazon Machine Image (AMI) we use to incorporate Ubuntu’s fixes for the TCP SACKs vulnerabilities.
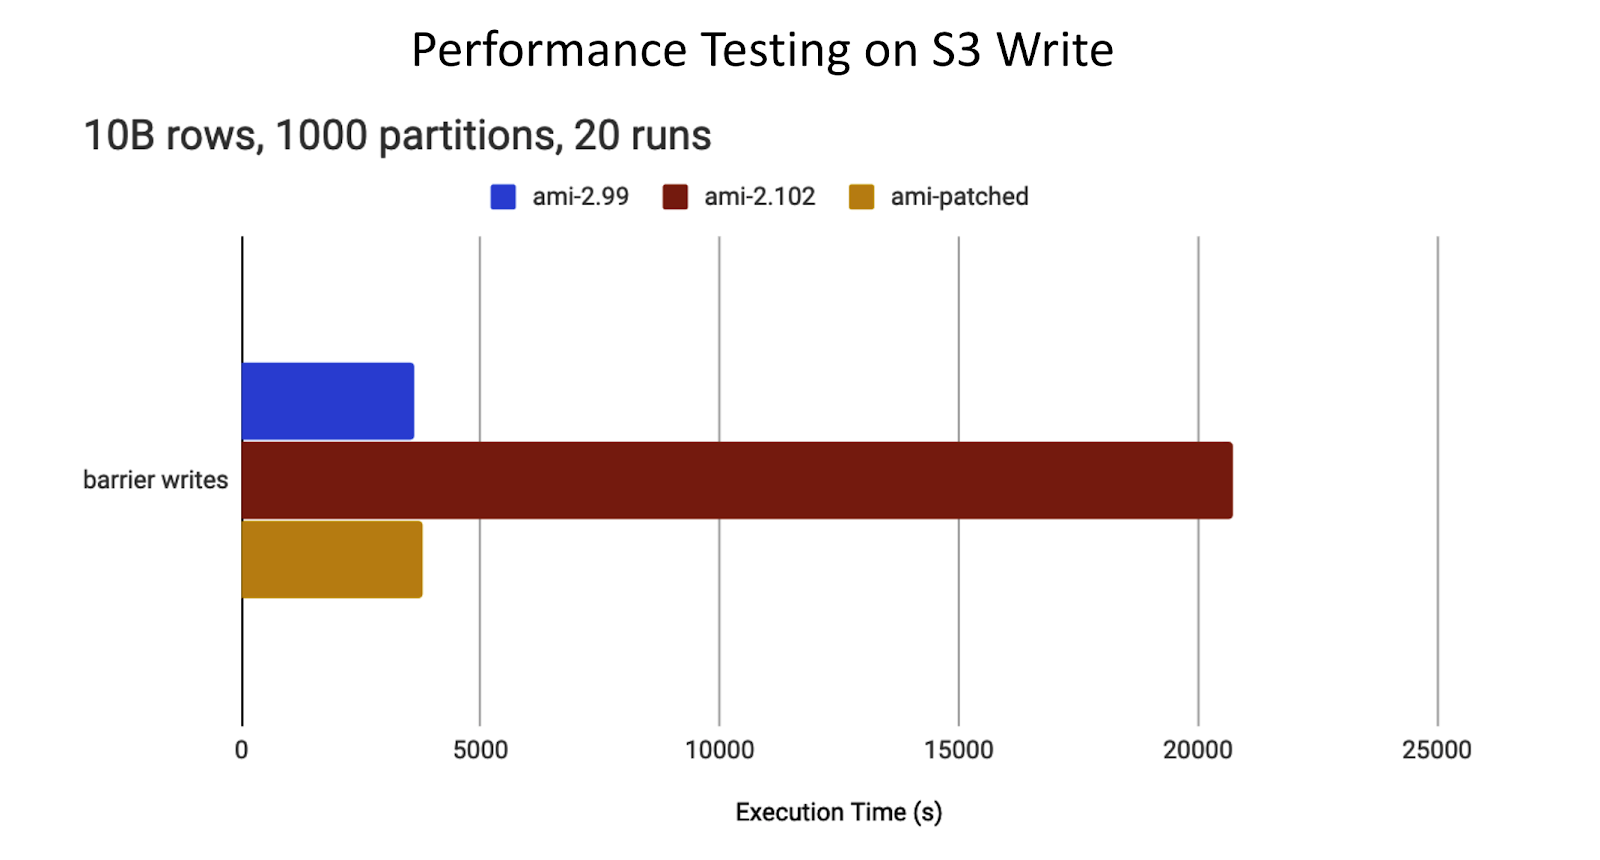
The failing benchmark writes a large DataFrame to S3 via the Databricks File System (DBFS) using Apache Spark’s save function.
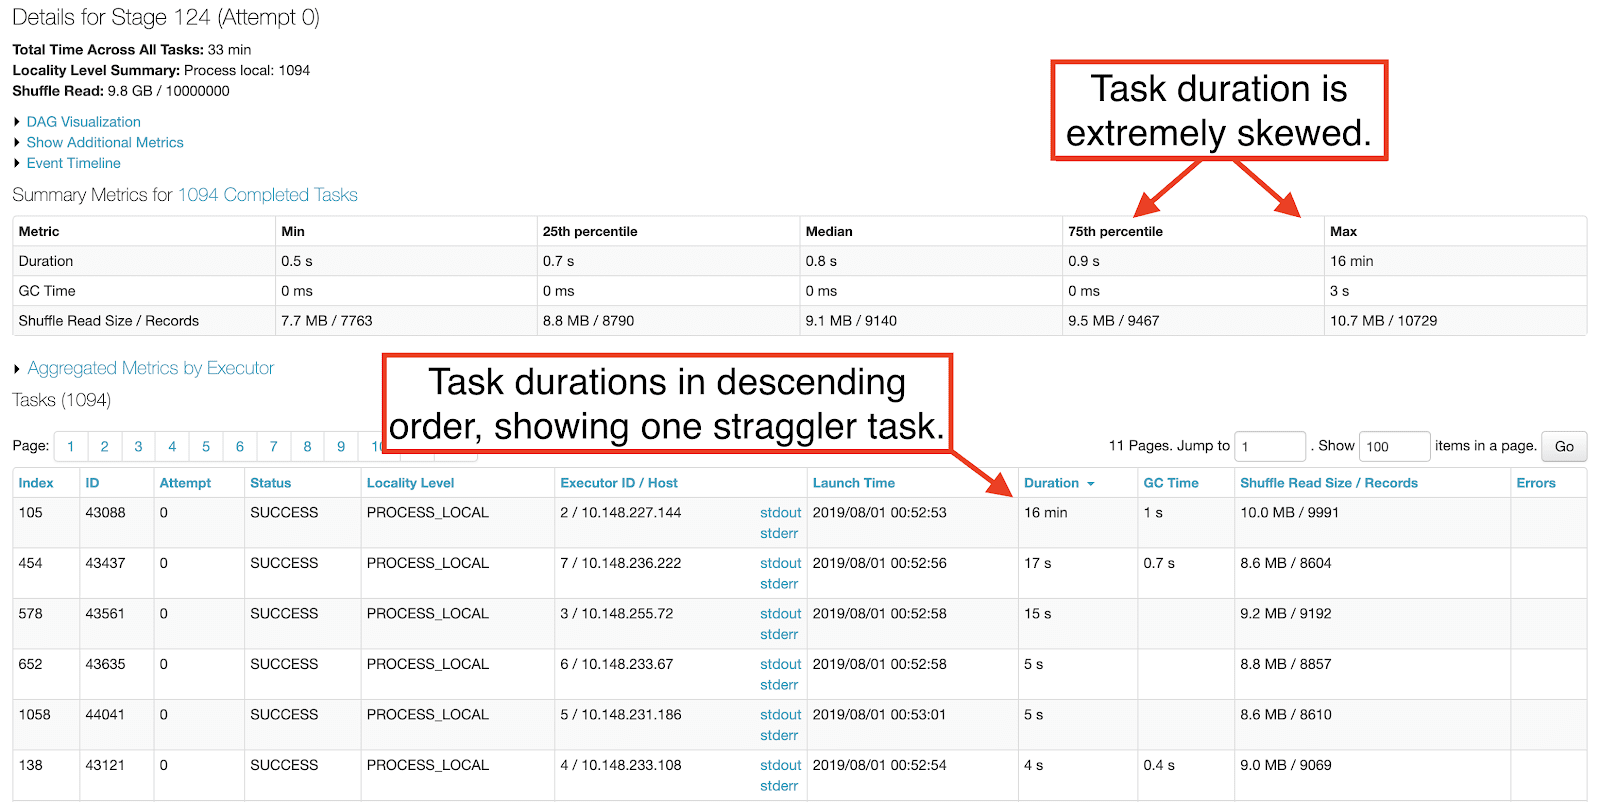
The Apache Spark stage performing the save operation had extreme task skew. One straggler task took about 15 minutes, while the rest completed in less than 1 second.
The problem disappeared when rolling back to the insecure AMI without the TCP SACKs vulnerability fixes.
Debugging TCP connections
In order to figure out why the straggler task took 15 minutes, we needed to catch it in the act. We reran the benchmark while monitoring the Spark UI, knowing that all but one of the tasks for the save operation would complete within a few minutes. Sorting the tasks in that stage by the Status column, it did not take long for there to be only one task in the RUNNING state. We had found our skewed task and the IP address in the Host column pointed us at the executor experiencing the regression.
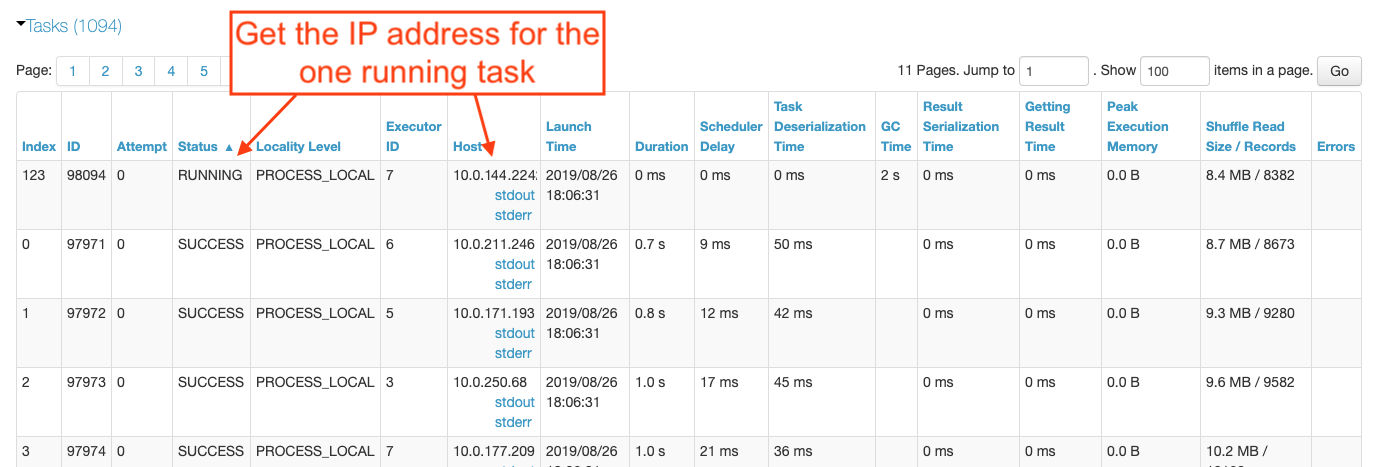
With the IP address in hand, we ssh’d into that executor to see what was going on. Suspecting a networking problem due to the AmazonS3Exception errors we’d previously seen in the cluster logs, we ran netstat to look at the active network connections.
One TCP connection to an S3 server was stuck in the CLOSE_WAIT state. This state indicates that the server is done transmitting data and has closed the connection, but the client still has more data to send. The socket for this connection had 97KB of data waiting to be sent.
While monitoring the state of that socket until the save operation completed after 15 minutes, we noticed the size of the send queue never changed. It remained at 97KB. The S3 server was either not acknowledging the data or the executor node was failing to send the data. We used ss to get more details about the socket.
Using ss allowed us to look at the socket’s memory usage (-m), TCP specific information (--info) and timer information (-o). Let’s take a look at the important numbers for this investigation:
- timer:(on,1min37sec,13) - The time until the next retransmission (1 min 37 secs) and the completed retransmission attempts (13).
- tb46080 - The socket’s current send buffer size in bytes (45KB). This maps to
sk_sndbufin the Linux socket structure. - w103971 - The memory consumed by the socket’s write buffers in bytes (101KB). This maps to
sk_wmem_queuedin the Linux socket structure. - mss:1412 - The connection’s maximum segment size in bytes.
- lastsnd:591672 - The time since the last packet was sent in milliseconds (9 mins 51 secs).
This snapshot of the socket’s state indicated that it had made 13 unsuccessful retransmission attempts and the next attempt would be made in 1 minute and 37 seconds. This was odd, however, given that the maximum time between TCP retransmissions in Linux is 2 minutes and the socket had not sent a packet in the last 9 minutes and 51 seconds. The server wasn’t failing to acknowledge the retransmissions; the client’s retransmissions weren’t even making it out over the wire!
While the socket was stuck in this state, we watched the retransmission counter tick up to 15 (the default setting for net.ipv4.tcp_retries2) until the socket was closed. The send queue and write queue sizes never changed and the time since the last packet was sent never decreased, indicating that the socket continued to fail sending the data. Once the socket was closed, the S3 client’s retry mechanism kicked in and the data transfer succeeded.
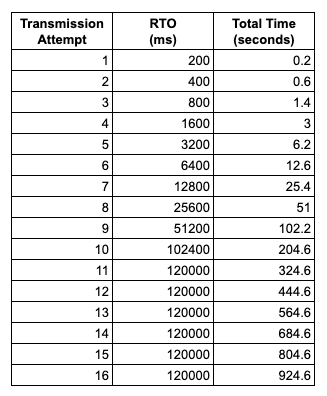
This behavior matches up nicely with the 15 minutes it was taking our benchmark’s straggler task to complete. With tcp_retries2 set to 15, TCP_RTO_MIN set to 200 milliseconds, TCP_RTO_MAX set to 120 seconds, and an exponential backoff in between retries, it takes 924.6 seconds, or just over 15 minutes, for a connection to time out.
SACKs in the TCP trace
With the 15 minute task skew explained by the retransmission timeout, we needed to understand why the client was failing to retransmit packets to the S3 server. We had been collecting TCP traces on all executors while debugging the benchmark and looked there for answers.
The tcpdump command above captures all traffic to and from the S3 subnet (52.218.0.0/16). We downloaded the .pcap file from the executor with the skewed task and analyzed it using Wireshark.
For the TCP connection with local port 42464 - the one that had been stuck in the CLOSE_WAIT state - the S3 client had attempted to send 1.4MB of data. The first 1.3MB transferred successfully within 600 milliseconds, but then the S3 server missed some segments and sent a SACK. The SACK indicated that 22,138 bytes were missed (the difference between the ACK base and the SACK’s left edge).
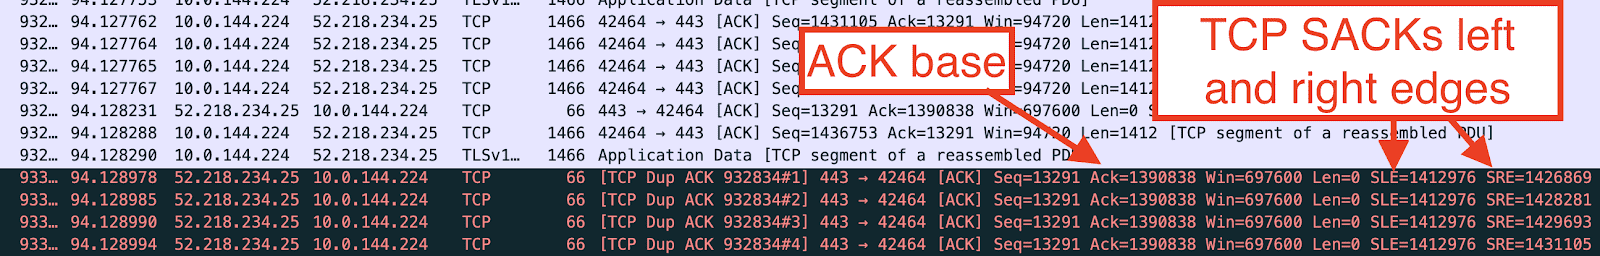
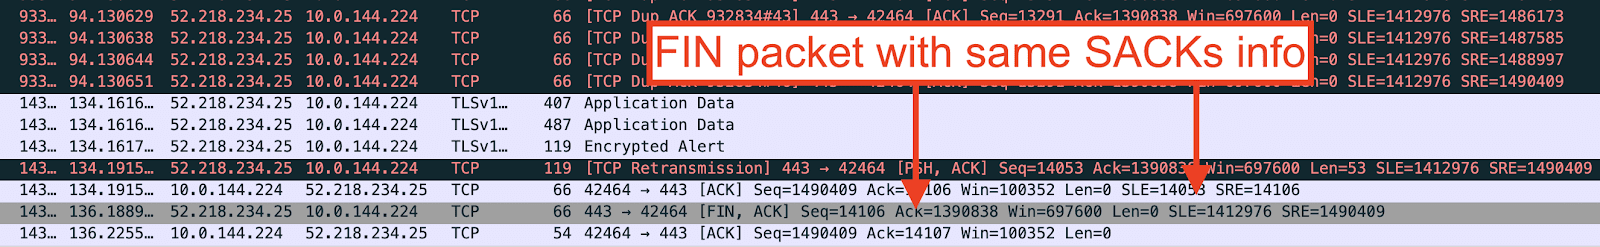
After the client sent its first transmission for all 1.4MB worth of outgoing TCP segments, the connection was silent for 40 seconds. The first 7 retransmission attempts for the missing 21KB should have triggered within that time, lending further proof that the client was failing to send packets over the wire. The server finally sent a FIN packet with the same SACK information, indicating that it had not received the missing data. This caused the client to enter the CLOSE_WAIT state and even though the client was allowed to transmit data in this state, it did not. The TCP trace showed no more packets for this connection. The unacknowledged 22,138 bytes were never retransmitted.
Adding these 22,138 bytes to the 77,433 SACKed bytes (subtract right edge from left edge), we get 99,571 bytes. This number should look familiar. It is the size of the socket’s send queue listed in the netstat output. This raised a second question. Why wasn’t the 75KB of SACKed data ever removed from the socket’s send queue? The server had confirmed reception; the client didn’t need to keep it.
Unfortunately, the TCP trace didn’t tell us why the retransmissions failed and only added an additional question to be answered. We opened the Ubuntu 16.04 source to learn more.
Dissecting the TCP stack
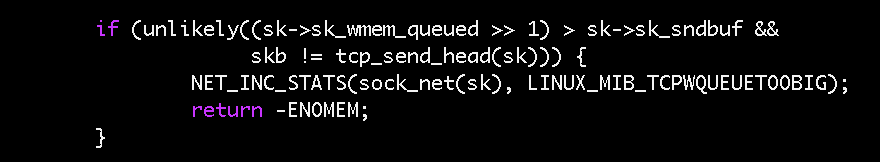
One Linux patch meant to fix the TCP SACKs vulnerability added an if-statement to the tcp_fragment() function. It was meant to restrict the conditions under which the TCP stack fragments a socket’s retransmission queue to protect against maliciously crafted SACKs packets. It was the first place we looked because it had already been fixed once.
Even with this fix, we were still seeing problems. At the end of July, yet another fix was published for newer versions of Linux. As our AMIs use Ubuntu 16.04 with Canonical’s 4.4.0 Linux kernel, we backported that patch and built a custom Ubuntu kernel. Our performance problem disappeared.
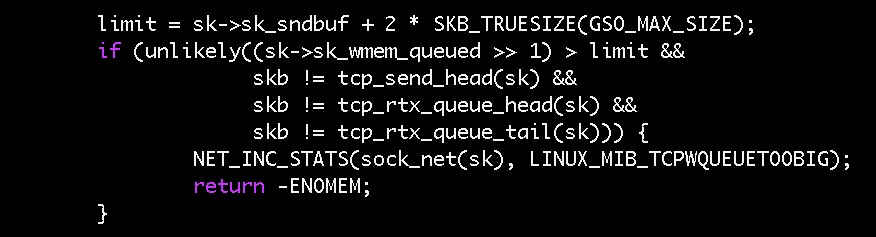
Still blind to the root cause, as we didn’t know which of the four conditions in the if-statement fixed our problem, we built multiple custom images, isolating each condition. The image with just the first condition - the modifications to the sk_wmem_queued check - proved sufficient to solve our issues.
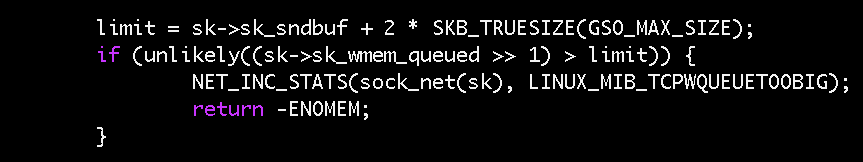
The commit message for that change says that a 128KB overhead was added to sk_sndbuf to form the limit because “tcp_sendmsg() and tcp_sendpage() might overshoot sk_wmem_queued by about one full TSO skb (64KB size).” This means that sk_wmem_queued can legitimately exceed sk_sndbuf by as much as 64KB. This is what we were seeing in our socket. If you recall the ss output above, the send buffer was 46,080 bytes and the write queue size was 103,971 bytes (a difference of 56KB). As half of our write queue (note the right shift in the condition) was bigger than the send buffer, we were satisfying the original fix’s if-condition. nstat confirmed this, as we saw the TCPWQUEUETOOBIG count recorded as 179.
With confirmation that we were indeed failing in tcp_fragment(), we wanted to figure out why this could cause retransmission to fail. Looking up the stack at the retransmit code path, we saw that if a socket buffer’s length is larger than the current MSS (1412 bytes in our case), tcp_fragment() is invoked before retransmission. If this fails, retransmission increments the TCPRETRANSFAIL counter (ours was at 143) and aborts the retransmission attempt for the entire queue of socket buffers. This is the reason why we did not observe any retransmissions of the 21KB of unacknowledged data.
This leaves the 75KB of SACKed data. Why wasn’t the memory from those packets reclaimed? It would have reduced the size of the write queue and allowed the fragmentation attempts during retransmission to succeed. Alas, SACK handling also calls tcp_fragment() when a socket buffer is not completely within the SACK boundaries so that it can free the acknowledged portion. When one fragmentation fails, the handler actually breaks out without checking the rest of the socket buffers. This is likely why the 75KB of acknowledged data was never released. If the unacknowledged 21KB shared a socket buffer with the first portion of the SACKed data, it would have required fragmentation to reclaim. Failing on the same if-condition in tcp_fragment(), the SACK handler would have aborted.
Lessons learned
Reflecting on our journey through discovery, investigation and root cause analysis, a few points stand out:
- Consider the whole stack. We take for granted that Ubuntu offers a secure and stable platform for our clusters. When our benchmark initially failed, we naturally started looking for clues in our own recent changes. It was only after discovering the subsequent Linux TCP patches that we started questioning bits lower down the stack.
- Benchmarks are just numbers; logging is vital. We already knew this, but it’s worth reiterating. Our benchmark simply told us the platform was 6x slower. It didn’t tell us where to look. The Spark logs reporting S3 socket timeout exceptions gave us our first real hint. A benchmark that alerted on such logging abnormalities would have greatly reduced the initial investigation time.
- Use the right tools. The 15 minute socket timeout stumped us for a while. We knew about
netstat, but only later learned aboutss. The latter provides far more detail about a socket’s state and made the retransmission failures obvious. It also helped us make better sense of the TCP trace as it too was missing the expected retransmissions.
We also learned a lot about the Linux TCP stack during this deep dive. While Databricks isn’t looking to start submitting Linux patches anytime soon, we owed it to our customers and the Linux community to back up our earlier claim that an OS-level patch would be required to fix our performance regression. The good news is that the latest 4.4.0 patch resolves the issue and an official Ubuntu 16.04 fix is in sight.
Get the latest posts in your inbox
Subscribe to our blog and get the latest posts delivered to your inbox.