Scaling Financial Time Series Analysis Beyond PCs and Pandas: On-Demand Webinar, Slides and FAQ Now Available!

On Oct 9th, 2019, we hosted a live webinar —Scaling Financial Time Series Analysis Beyond PCs and Pandas — with Junta Nakai, Industry Leader Financial Services at Databricks, and Ricardo Portilla, Solution Architect at Databricks. This was a live webinar showcasing the content in this blog- Democratizing Financial Time Series Analysis with Databricks.
Please find the slide deck for this webinar here.
Fundamental economic data, financial stock tick data and alternative data sets such as geospatial or transactional data are all indexed by time, often at irregular intervals. Solving business problems in finance such as investment risk, fraud, transaction costs analysis and compliance ultimately rests on being able to analyze millions of time series in parallel. Older technologies, which are RDBMS-based, do not easily scale when analyzing trading strategies or conducting regulatory analyses over years of historical data.
In this webinar we reviewed:
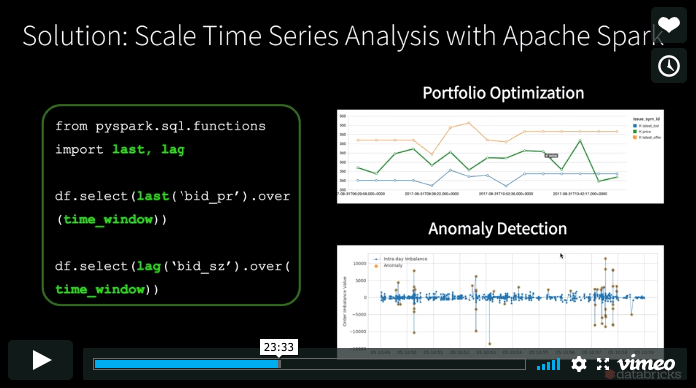
- How to build time series functions on hundreds of thousands of tickers in parallel using Apache Spark™.
- Lastly, if you are a Pandas (Python Data Analysis Library) user looking to scale data preparation which feeds into financial anomaly detection or other statistical analyses, we used a market manipulation example to show how Koalas makes scaling transparent to the typical data science workflow.
We demonstrated these concepts using this notebook in Databricks
If you’d like free access to the Unified Data Analytics Platform and try our notebooks on it, you can access a free trial here.
Toward the end, we held a Q&A and below are the questions and answers.
Q: BI Tools traditionally query data warehouses, can they now connect to Databricks?
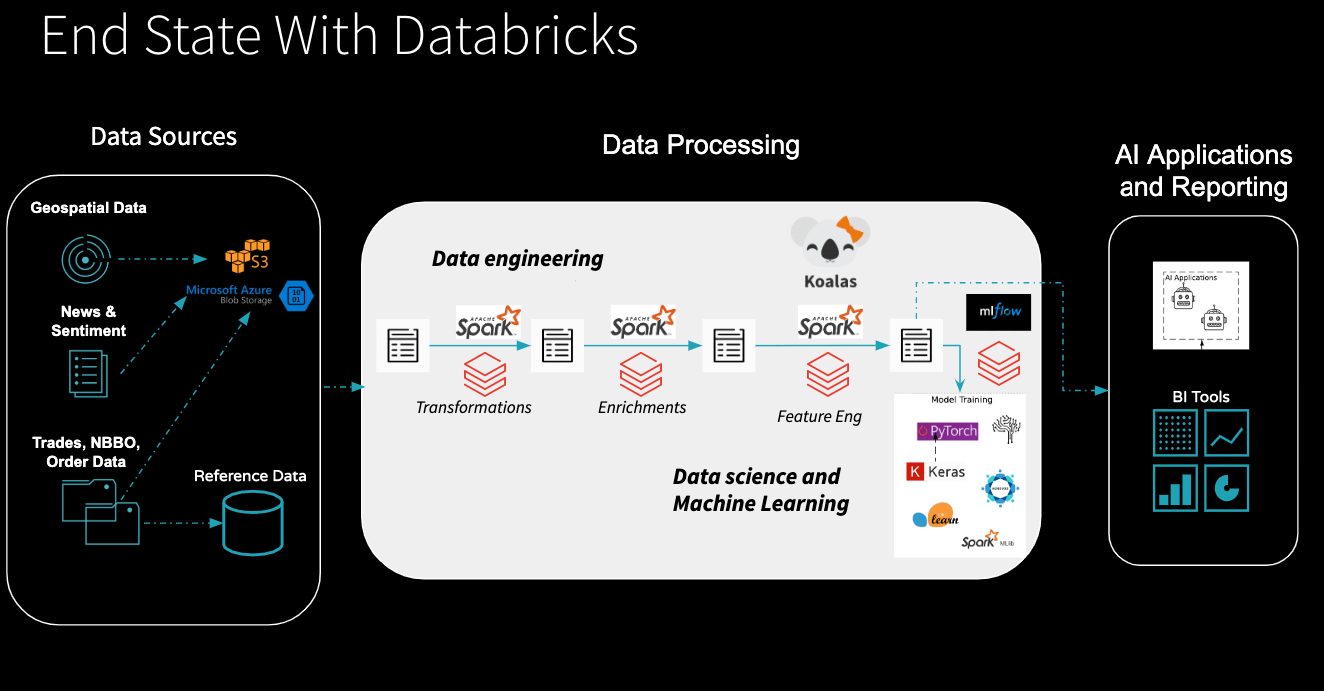
A: Great question. There are two approaches to this. Yes, you can connect your BI tools to Databricks directly to query the data lake. Let’s look at this slide below.
If you look at the diagram, BI tools are pointed to one of the managed tables created by Apache Spark. If you have an aggregate table that is specific to a line business (let’s say you created a table with aggregated trade windows throughout the day), this can be queried with a BI tool such as Tableau, Looker, etc. If you need very low latency, for example, say you need to create dashboards for the C-level, then you can query a data warehouse.
Q: Is there a way to effectively distribute the modeling of time series, or is this only distributed pandas based data manipulation to prepare the data set. Specifically, I use quite a bit of SARIMAX. I am trying to figure out how to distribute cross-validation of candidate SARIMAX models.
A: This presentation was more focused on the manipulation aspect, but Spark can absolutely distribute things like hyperparameter tuning and cross-validation. So if you have a grid defined or you want to do a random bayesian search, what you need to do is, define independent problems or partitioning of your problems. So a good example is forecasting. Let's say, I want to iterate through a 100 different combinations, where I want to change whether we specify daily seasonality or yearly seasonality, and multiply that by all the different parameters that I am using for an ARIMA model. Then all I need to do is define that grid and Spark can basically execute one task per different input vector parameter. So effectively you are running up to 1000 or 5000 forecasts all in parallel. This would be the go-to method to actually parallelize things like forecasting.
Q: Is Koala open source? Do Koalas works with scikit-learn?
Yes, Koalas is open-source software. Koalas definitely works with scikit-learn. If you go through the notebook in the blog here, you can effectively convert any of those data structures and can feed it directly into scikit-learn. The only difference is you may have to convert the structure directly before you put it into a machine learning model .ie you may have to convert to pandas in the final step. But it should work otherwise. The two numpy data structures act as the bridge.
Q: As a team how can we do code review or version control, if we work on Databricks?
The blog article actually points out the mechanism to do that. If you want to leverage Databricks for the performance aspect, compute aspect, MLFlow and all of that. We released something called Databricks Connect. It allows you to work on your local IDE. If you do that, you can always check in your code to version control using your standard tools and then deploy using Jenkins as you usually do. The second option is Databricks notebooks themselves integrate with Git, so you can directly save the work, as you are going along, in a notebook as well.
Q: Any resources, demo, tutorial to handle geospatially oriented time series data? For example, something that could look at the past 5 years of real estate data and combine that with traffic data to show how housing density affects traffic patterns.
A: The techniques that were highlighted here were multi-purpose. For the AS-OF join, you can certainly use the data sets you are describing. It is a matter of just aligning the right time stamps and then choosing a partitioning column. We will consider having subsequent blogs on geospatial in particular, that will likely go deeper into the techniques or libraries that can be used to effectively join geospatial data. But right now AS-OF join should work for any data set you want to use, as long as you are just trying to merge them to get contextual AS-OF data.


