How to build a Quality of Service (QoS) analytics solution for streaming video services
by Andrei Avramescu and Hector Leano
Click on the following link to view and download the QoS notebooks discussed below in this article.
Contents
- The Importance of Quality to Streaming Video Services
- Databricks QoS Solution Overview
- Video QoS Solution Architecture
- Making Your Data Ready for Analytics
- Creating the Dashboard / Virtual Network Operations Center
- Creating (Near) Real Time Alerts
- Next steps: Machine learning
- Getting Started with the Databricks Streaming Video Solution
The Importance of Quality to Streaming Video Services
As traditional pay TV continues to stagnate, content owners have embraced direct-to-consumer (D2C) subscription and ad-supported streaming for monetizing their libraries of content. For companies whose entire business model revolved around producing great content which they then licensed to distributors, the shift to now owning the entire glass-to-glass experience has required new capabilities such as building media supply chains for content delivery to consumers, supporting apps for a myriad of devices and operating systems, and performing customer relationship functions like billing and customer service.
With most vMVPD (virtual multichannel video programming distributor) and SVOD (streaming video on demand) services renewing on a monthly basis, subscription service operators need to prove value to their subscribers every month/week/day (the barriers to a viewer for leaving AVOD (ad-supported video on demand) are even lower - simply opening a different app or channel). General quality of streaming video issues (encompassing buffering, latency, pixelation, jitter, packet loss, and the blank screen) have significant business impacts, whether it’s increased subscriber churn or decreased video engagement.
When you start streaming you realize there are so many places where breaks can happen and the viewer experience can suffer, whether it be an issue at the source in the servers on-prem or in the cloud; in transit at either the CDN level or ISP level or the viewer’s home network; or at the playout level with player/client issues. What breaks at n x 104 concurrent streamers is different from what breaks at n x 105 or n x 106. There is no pre-release testing that can quite replicate real-world users and their ability to push even the most redundant systems to their breaking point as they channel surf, click in and out of the app, sign on from different devices simultaneously, and so on. And because of the nature of TV, things will go wrong during the most important, high profile events drawing the largest audiences. If you start receiving complaints on social media, how can you tell if they are unique to that one user or rather regional or a national issue? If national, is it across all devices or only certain types (e.g., possibly the OEM updated the OS on an older device type which ended up causing compatibility issues with the client)?
>Identifying, remediating, and preventing viewer quality of experience issues becomes a big data problem when you consider the number of users, the number of actions they are taking, and the number of handoffs in the experience (servers to CDN to ISP to home network to client). Quality of Service (QoS) helps make sense of these streams of data so you can understand what is going wrong, where, and why. Eventually you can get into predictive analytics around what could go wrong and how to remediate it before anything breaks.
Databricks QoS Solution Overview
The aim of this solution is to provide the core for any streaming video platform that wants to improve their QoS system. It is based on the AWS Streaming Media Analytics Solution provided by AWS Labs which we then built on top of to add Databricks as a unified data analytics platform for both the real time insights and the advanced analytics capabilities.
By using Databricks, streaming platforms can get faster insights leveraging always the most complete and recent datasets powered by robust and reliable data pipelines, decreased time to market for new features by accelerating data science using a collaborative environment with support for managing the end-to-end machine learning lifecycle, reduced operational costs across all cycles of software development by having a unified platform for both data engineering and data science.
Video QoS Solution Architecture
With complexities like low-latency monitoring alerts and highly scalable infrastructure required for peak video traffic hours, the straightforward architectural choice was the Delta Architecture - both standard big data architectures like Lambda and Kappa Architectures having disadvantages around operational effort required to maintain multiple types of pipelines (streaming and batch) and lack of support for unified Data Engineering & Data Science approach.
The Delta Architecture is the next generation paradigm that enables all the types of Data Personas in your organisation to be more productive:
- Data Engineers can develop data pipelines in a cost efficient manner continuously without having to choose between batch and streaming
- Data Analysts can get near real-time insights and faster answers to their BI queries
- Data Scientists can develop better machine learning models using more reliable datasets with support for time travel that facilitates reproducible experiments and reports
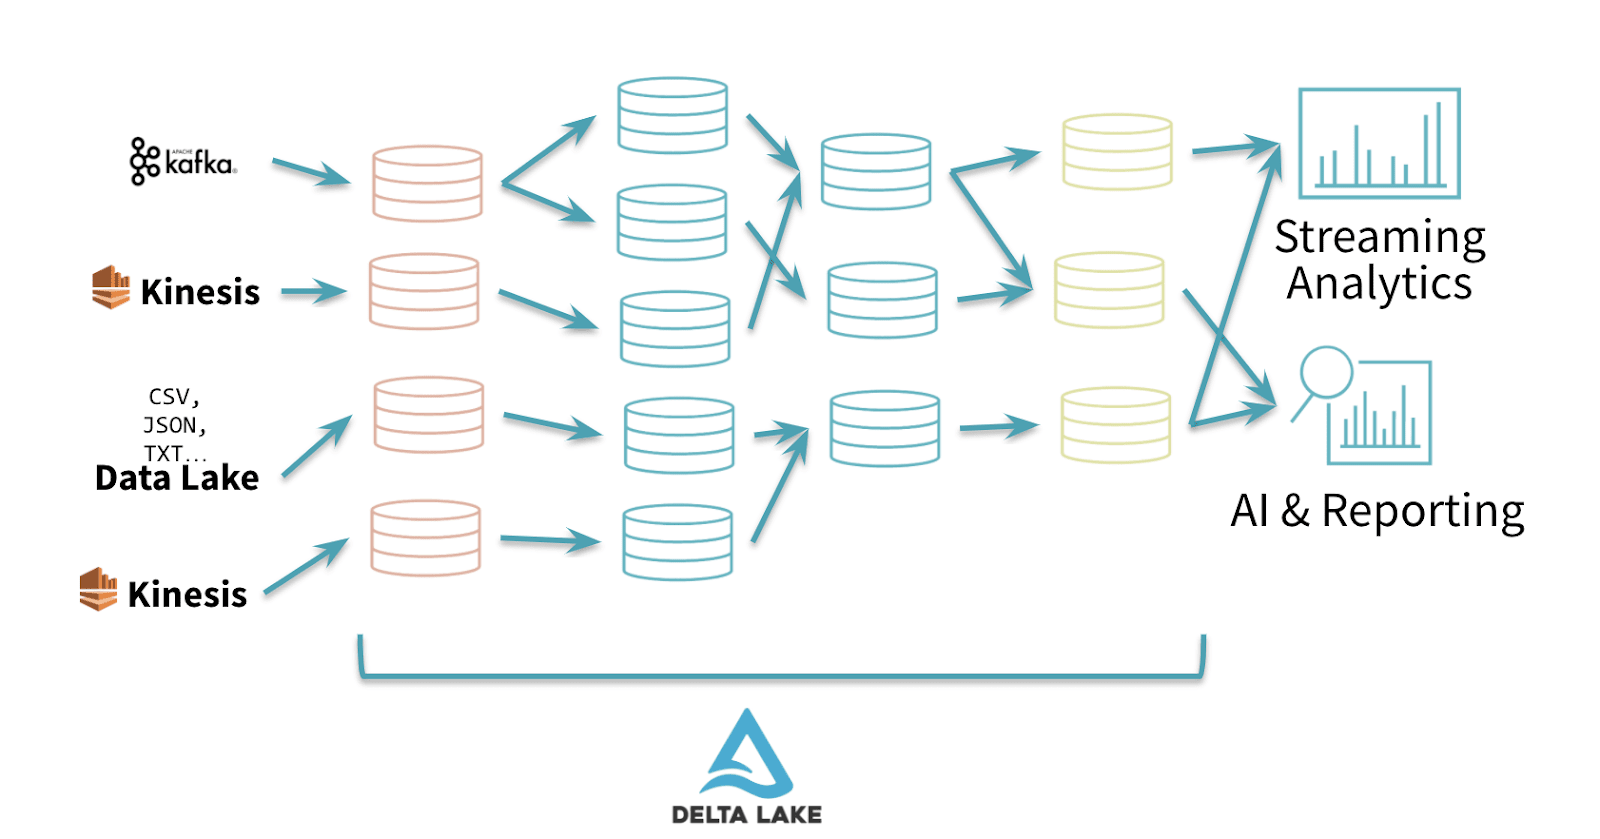
Fig. 1 Delta Architecture using the “multi-hop” approach for data pipelines
Writing data pipelines using the Delta Architecture follows the best practices of having a multi-layer “multi-hop” approach where we progressively add structure to data: “Bronze” tables or Ingestion tables are usually raw datasets in the native format (JSON, CSV or txt), “Silver” Tables represent cleaned/transformed datasets ready for reporting or data science and “Gold” tables are the final presentation layer.
For the pure streaming use cases, the option of materializing the Dataframes in intermediate Delta tables is basically just a tradeoff between latency/SLAs and cost (an example being real time monitoring alerts vs updates of the recommender system based on new content).

Fig. 2 A streaming architecture can still be achieved while materializing dataframes in Delta tables
The number of “hops” in this approach is directly impacted by the number of consumers downstream, complexity of the aggregations ( e.g. structured streaming enforces certain limitations around chaining multiple aggregations) and the maximisation of operational efficiency.
The QoS solution architecture is focused around best practices for data processing and is not a full VOD (video-on-demand) solution - some standard components like the “front door” service Amazon API Gateway being avoided from the high level architecture in order to keep the focus on data and analytics.
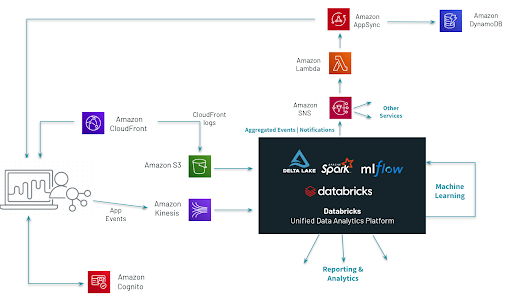
Fig. 3 High-Level Architecture for the QoS platform
Making your data ready for analytics
Both sources of data included in the QoS Solution ( application events and CDN logs ) are using the JSON format, great for data exchange - allowing you to represent complex nested structures, but not scalable and difficult to maintain as a storage format for your data lake / analytics system.
In order to make the data directly queryable across the entire organisation, the Bronze to Silver pipeline (the “make your data available to everyone” pipeline) should transform any raw formats into Delta and include all the quality checks or data masking required by any regulatory agencies.
Video Applications Events
Based on the architecture, the video application events are pushed directly to Kinesis Streams and then just ingested to a Delta append only table without any changes to the schema.

Fig. 4 Raw format of the app events
Using this pattern allows a high number of consumers downstream to process the data in a streaming paradigm without having to scale the throughput of the Kinesis stream. As a side effect of using a Delta table as a sink ( which supports optimize! ), we don’t have to worry about the way the size of the processing window will impact the number of files in your target table - known as the “small files” issue in the big data world.
Both the timestamp and the type of message are being extracted from the JSON event in order to be able to partition the data and allow consumers to choose the type of events they want to process. Again combining a single Kinesis stream for the events with a Delta “Events” table reduces the operational complexity while making things easier for scaling during peak hours.
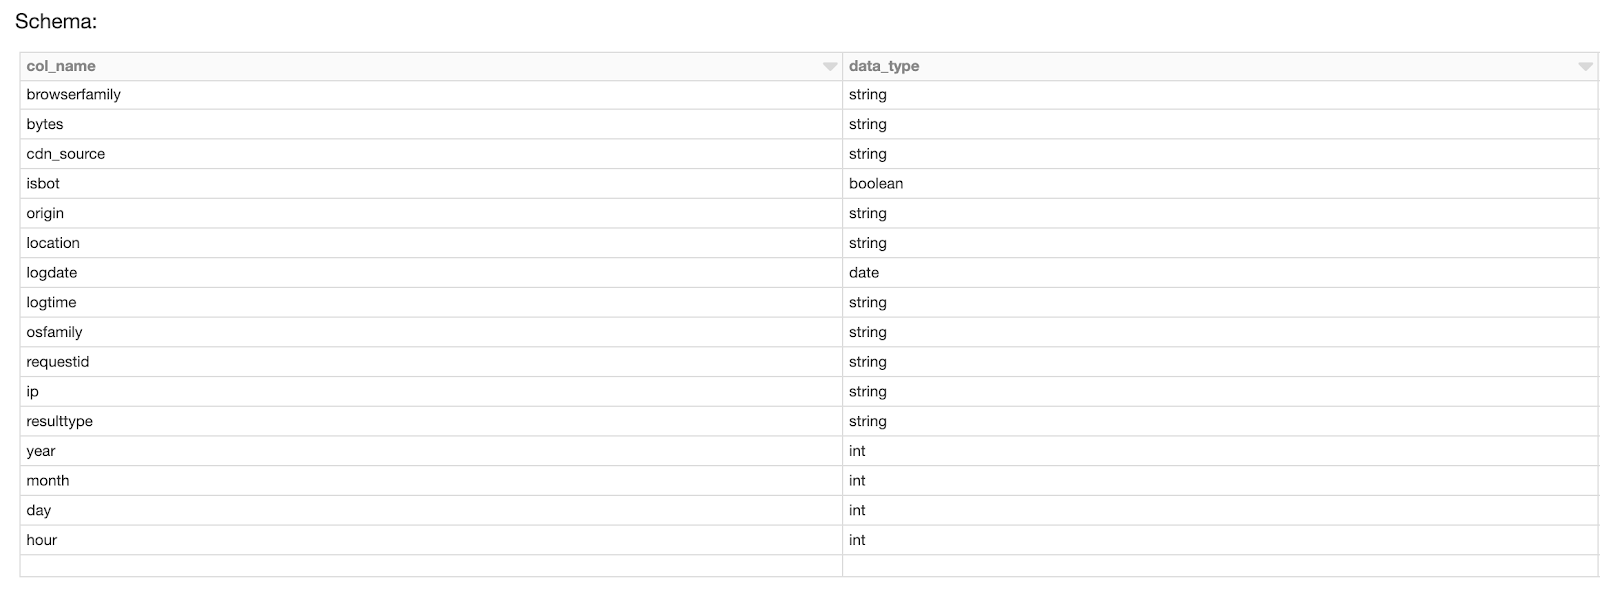
Fig. 5 All the details are extracted from JSON for the Silver table
CDN Logs
The CDN Logs are delivered to S3, so the easiest way to process them is the Databricks Auto Loader, which incrementally and efficiently processes new data files as they arrive in S3 without any additional setup.
As the logs contain IPs - considered personal data under the GDPR regulations - the “make your data available to everyone” pipeline has to include an anonymisation step. Different techniques can be used but we decided to just strip the last octet from IPv4 and the last 80 bits from IPv6. On top, the dataset is also enriched with information around the origin country and the ISP provider which will be used later in the Network Operation Centers for localisation.
Creating the dashboard / virtual Network Operation Centers
Streaming companies need to monitor network performance and the user experience as near real time as possible, tracking down to the individual level with the ability to abstract at the segment level, easily defining new segments such as those defined by geos, devices, networks, and/or current and historical viewing behavior. For streaming companies that has meant adopting the concept of Network Operation Centers (NOC) from telco networks for monitoring the health of the streaming experience for their users at a macro level, flagging and responding to any issues early on. At their most basic, NOCs should have dashboards that compare the current experience for users against a performance baseline so that the product teams can quickly and easily identify and attend to any service anomalies.
In the QoS Solution we have incorporated a Databricks dashboard. BI Tools can also be effortlessly connected in order to build more complex visualisations, but based on customer feedback, built-in dashboards are most of the time the fastest way to present the insights to business users.
The aggregated tables for the NoC will basically be the Gold layer of our Delta Architecture - a combination of CDN logs and the application events.
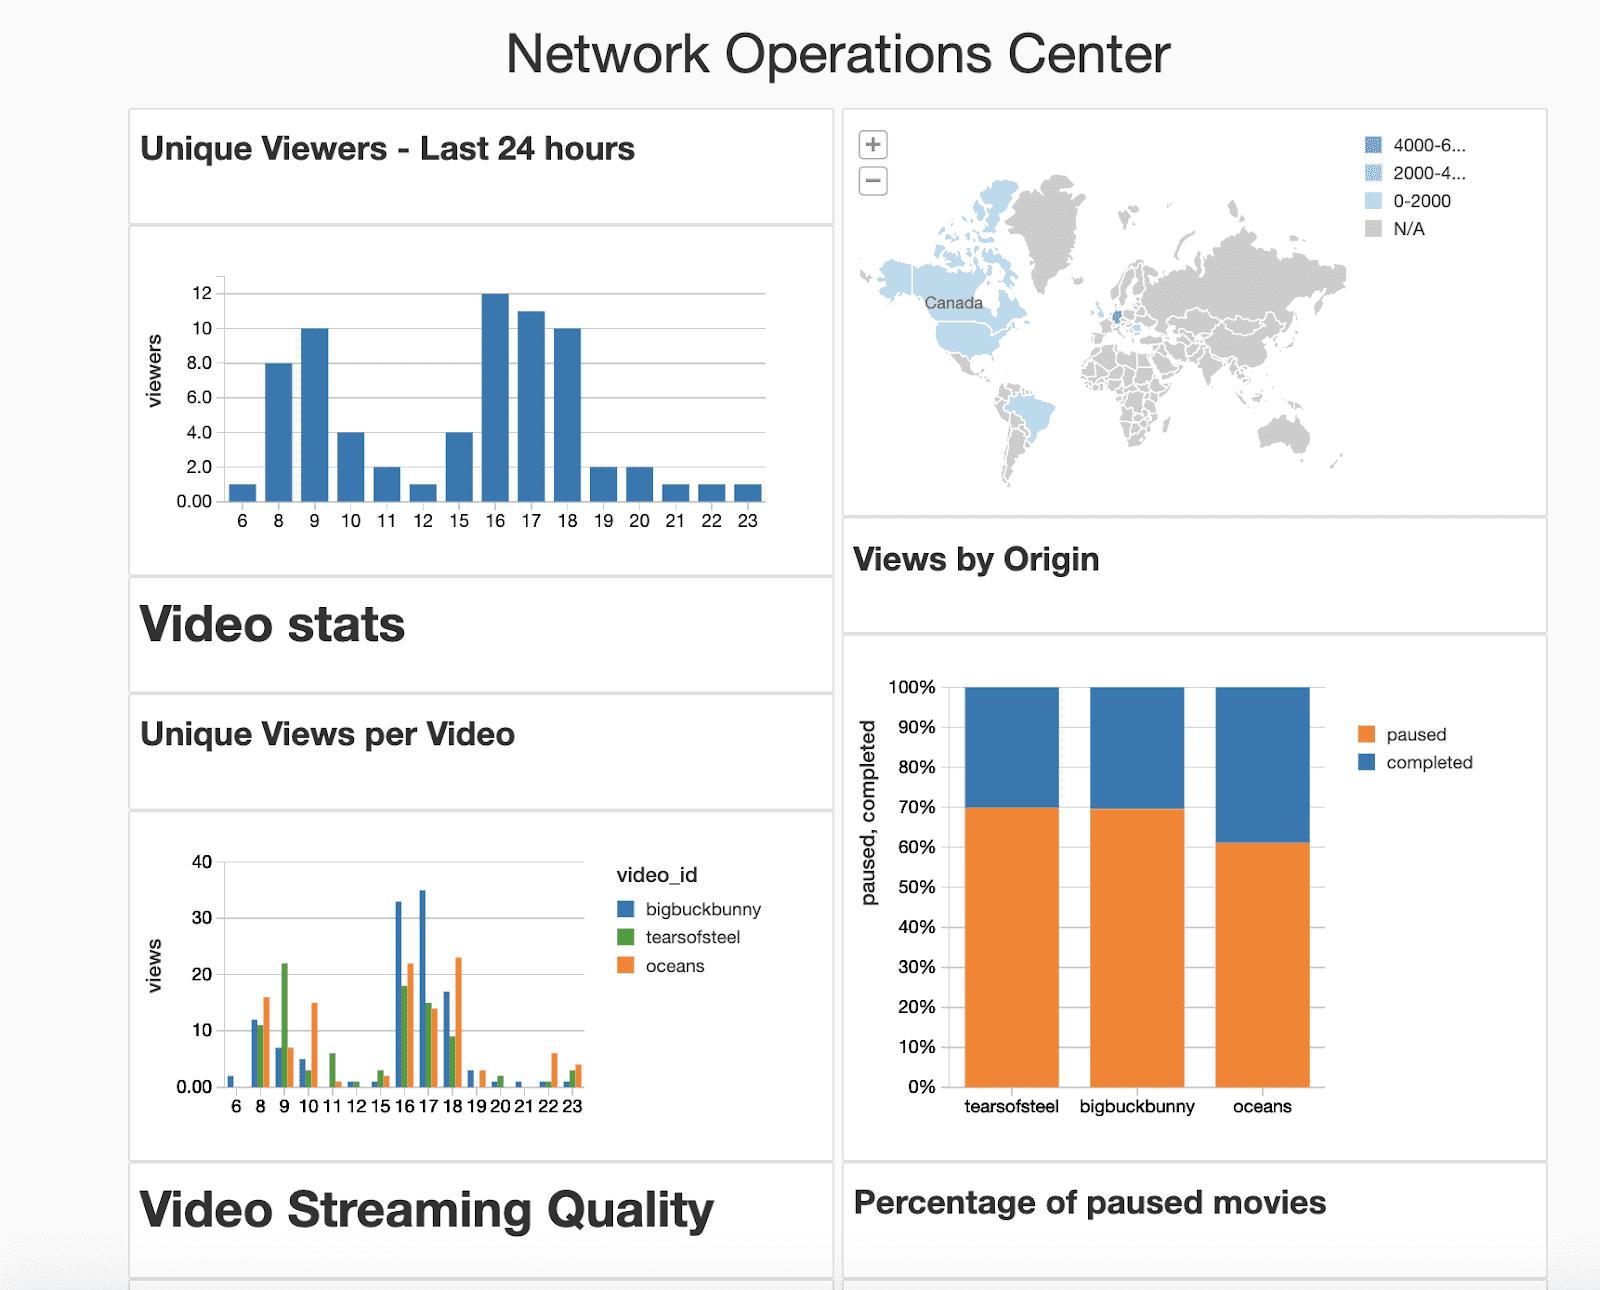
Fig.6 Example of Network Operations Center Dashboard
The dashboard is just a way to visually package the results of SQL queries or Python / R transformation - each Notebook supports multiple Dashboards so in case of multiple end users with different requirements we don’t have to duplicate the code - as a bonus the refresh can also be scheduled as a Databricks job.
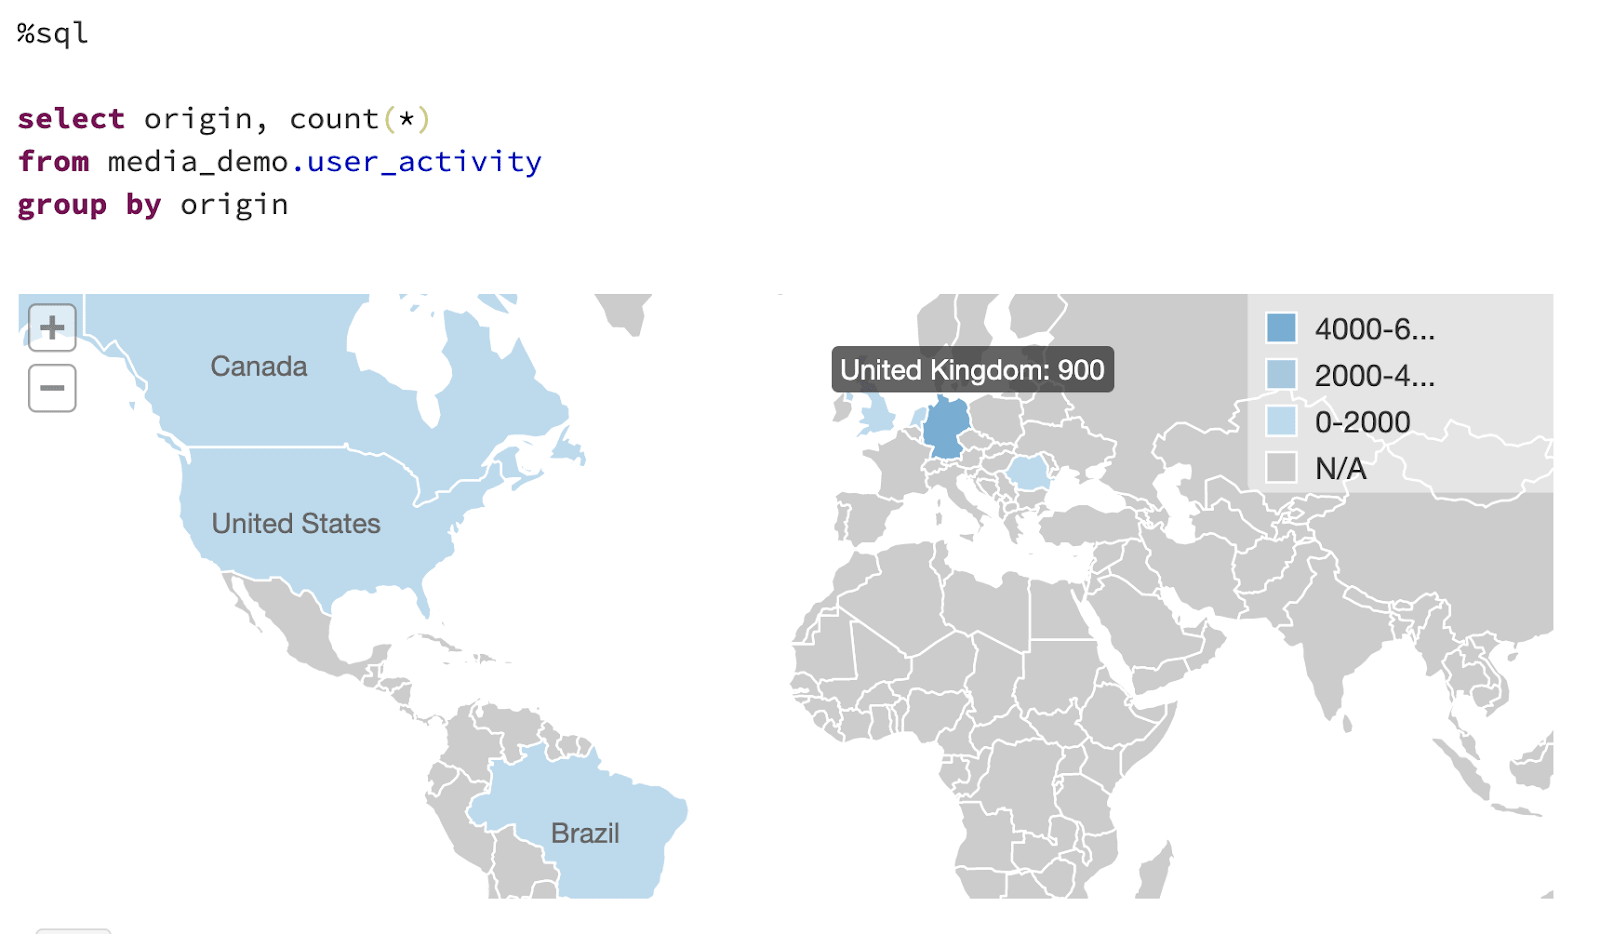
Fig.7 Visualization of the results of a SQL query
Loading time for videos (time to first frame) allows better understanding of the performance for individual locations of your CDN - in this case the AWS CloudFront Edge nodes - which has a direct impact in your strategy for improving this KPI - either by spreading the user traffic over multi-CDNs or maybe just implementing a dynamic origin selection in case of AWS CloudFront using Lambda@Edge.

Failure to understand the reasons for high levels of buffering - and the poor video quality experience that it brings - has a significant impact on subscriber churn rate. On top of that, advertisers are not willing to spend money on ads responsible for reducing the viewer engagement - as they add extra buffering on top, so the profits on the advertising business usually are impacted too. In this context, collecting as much information as possible from the application side is crucial to allow the analysis to be done not only at video level but also browser or even type / version of application.

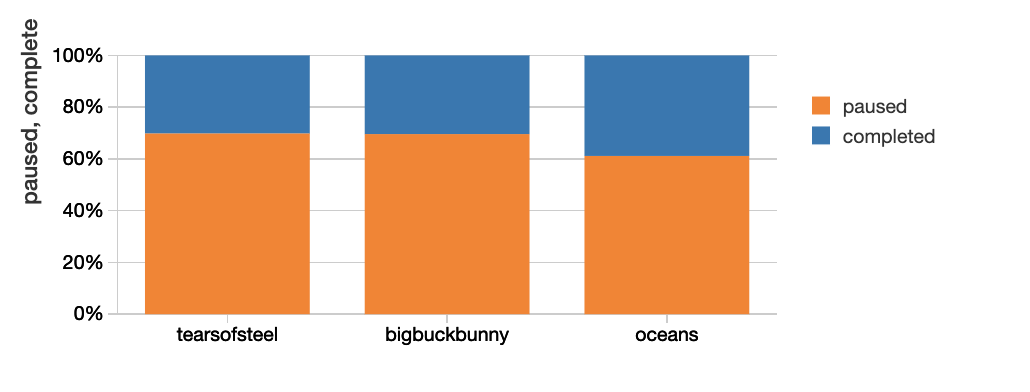
On the content side, events for the application can provide useful information about user behaviour and overall quality of experience. How many people that paused a video have actually finished watching that episode / video? Is the cause for stopping the quality of the content or are there delivery issues ? Of course further analyses can be done by linking all the sources together (user behaviour, performance of CDNs / ISPs) to not only create a user profile but also to forecast churn.
Creating (Near) Real Time Alerts
When dealing with the velocity, volume, and variety of data generated in video streaming from millions of concurrent users, dashboard complexity can make it harder for human operators in the NOC to focus on the most important data at the moment and zero in on root cause issues. With this solution, you can easily set up automated alerts when performance crosses certain thresholds that can help the human operators of the network as well as set off automatic remediation protocols via a Lambda function. For example:
- If a CDN is having latency much higher than baseline (e.g., if it’s more than 10% latency versus baseline average), initiate automatic CDN traffic shifts.
- If more than [some threshold e.g., 5%] of clients report playback errors, alert the product team that there is likely a client issue for a specific device.
- If viewers on a certain ISP are having higher than average buffering and pixelation issues, alert frontline customer representatives on responses and ways to decrease issues (e.g., set stream quality lower).
From a technical perspective generating real-time alerts requires a streaming engine capable of processing data real time and publish-subscribe service to push notifications.

Fig.8 Integrating microservices using Amazon SNS and Amazon SQS
The QoS solution implements the AWS best practices for integrating microservices by using Amazon SNS and its integrations with Amazon Lambda ( see below the updates of web applications ) or Amazon SQS for other consumers. The custom foreach writer option makes the writing of a pipeline to send email notifications based on a rule based engine ( e.g validating the percentage of errors for each individual type of app over a period of time) really straightforward.
Fig.9 Sending email notifications using AWS SNS
On top of the basic email use case, the Demo Player includes three widgets updated real time using AWS AppSync: number of active users, most popular videos, number of users watching concurrently a video.
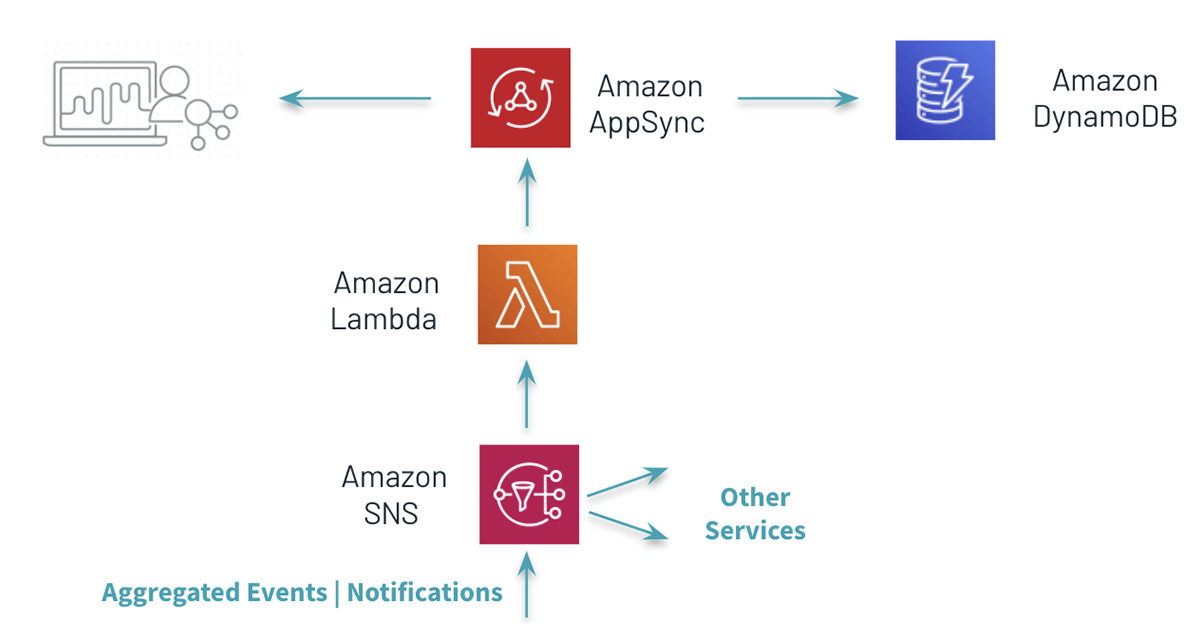
Fig.10 Updating the application with the results of real-time aggregations
The QoS Solution is applying a similar approach - Structured Streaming and Amazon SNS - to update all the values allowing for extra consumers to be plugged in using AWS SQS - a common pattern when huge volumes of events have to be enhanced and analysed - pre-aggregate data once and allow each service (consumer) to make its own decision downstream.
Next Steps: Machine Learning
Manually making sense of the historical data is important but is also very slow - if we want to be able to make automated decisions in the future, we have to integrate machine learning algorithms.
As a Unified Data Analytics Platform, Databricks empowers Data Scientists to build better Data Science products using features like the ML Runtime with the built-in support for Hyperopt / Horvod / AutoML or the integration with MLFlow, the end-to-end machine learning lifecycle management tool.
We have already explored a few important use cases across our customers base while focusing on the possible extensions to the QoS Solution.
Point-of-failure prediction & remediation
As D2C streamers reach more users, the costs of even momentary loss of service increases. ML can help operators move from reporting to prevention by forecasting where issues could come up and remediating before anything goes wrong (e.g., a spike in concurrent viewers leads to switching CDNs to one with more capacity automatically).
Customer Churn
Critical to growing subscription services is keeping the subscribers you have. By understanding the quality of service at the individual level, you can add QoS as a variable in churn and customer lifetime value models. Additionally, you can create customer cohorts for those who have had video quality issues in order to test proactive messaging and save offers.
Getting Started with the Databricks Streaming Video QoS Solution
Providing consistent quality in the streaming video experience is table stakes at this point to keep fickle audiences with ample entertainment options to stay on your platform. With this solution we have sought to create a quick start for most streaming video platform environments to embed this QoS real-time streaming analytics solution in a way that:
- Scales to any audience size
- Quickly flags quality performance issues at key parts of the distribution workflow
- Is flexible and modular enough to easily customize for your audience and your needs such as creating new automated alerts or enabling data scientists to test and roll-out predictive analytics and machine learning.
To get started, download the notebooks for the Databricks streaming video QoS solution. For more guidance on how to unify batch and streaming data into a single system, view the Delta Architecture webinar.
Get the latest posts in your inbox
Subscribe to our blog and get the latest posts delivered to your inbox.