Fatal Force: Exploring Police Shootings With SQL Analytics
by Chengyin Eng and Brooke Wenig
Introduction
Data has shown that police in the United States kill civilians at a rate far higher than police in other wealthy countries.1 In 2019, law enforcement in the U.S. killed 33.5 civilians per 10 million people, compared to 1.3 in Germany and 0.5 in the U.K.2 This use of deadly force falls disproportionately on people of color and has become a flashpoint as videos surface and protesters take to the streets demanding change. As data scientists, we examine data, offer insights gleaned from data, and add our voice to this conversation by using the new SQL Analytics workspace in Databricks.
Check out the Why the Data Lakehouse is Your Next Data Warehouse ebook to discover the inner workings of the Databricks Lakehouse Platform.
For our data source, we set out to track down a federal database of police shootings, which turned out to be much trickier than anticipated. Prior to 2016, there was no federal database on the use of force by law enforcement officers. Since then, the FBI has compiled its own database, however leading newspapers have found that the FBI numbers routinely underreport fatalities by law-enforcement officers by as much as a factor of two.
In the absence of a robust federal database of police shootings, we turned to the database compiled by The Washington Post,3 which holds verified and regularly updated information on fatal shootings by on-duty police officers since January 1, 2015 (our snapshot includes data through October 29, 2020). It is important to note, however, that the Post data does not include deaths of people while in police custody, fatal shootings by off-duty officers, or deaths not caused by a firearm. We joined this data set with state population and demographic data to normalize per capita across states.4
Dashboard overview video
In this blog post, we analyze national and state-level trends around police use of fatal force. We will guide you through the insights we have derived from the interactive dashboard we created. After analyzing national statistics, we will do a deep dive comparison of three states in particular -- New York, Alaska and California -- as they spend the most on law enforcement per capita out of all the states.5 However, despite their similar spending, our data analysis reveals drastically different outcomes.
All of our analyses are available in this Github repository for you to reproduce and expand upon. We stored our data in Delta Lake for faster query performance and version control given the frequent updates to The Washington Post data set.
Demographic breakdown of shootings
In terms of absolute numbers, more white people were fatally shot by police than any other race, with 2,591 fatalities since 2015. However, when normalizing the number of fatalities by demographics, Native American and Black people suffered almost three times more fatal police shootings than white people, as shown in the graph below. If we were to look at 2017 alone, roughly 1 out of 100,000 Native Americans were fatally shot by police, compared to 0.2 out of 100,000 white people.
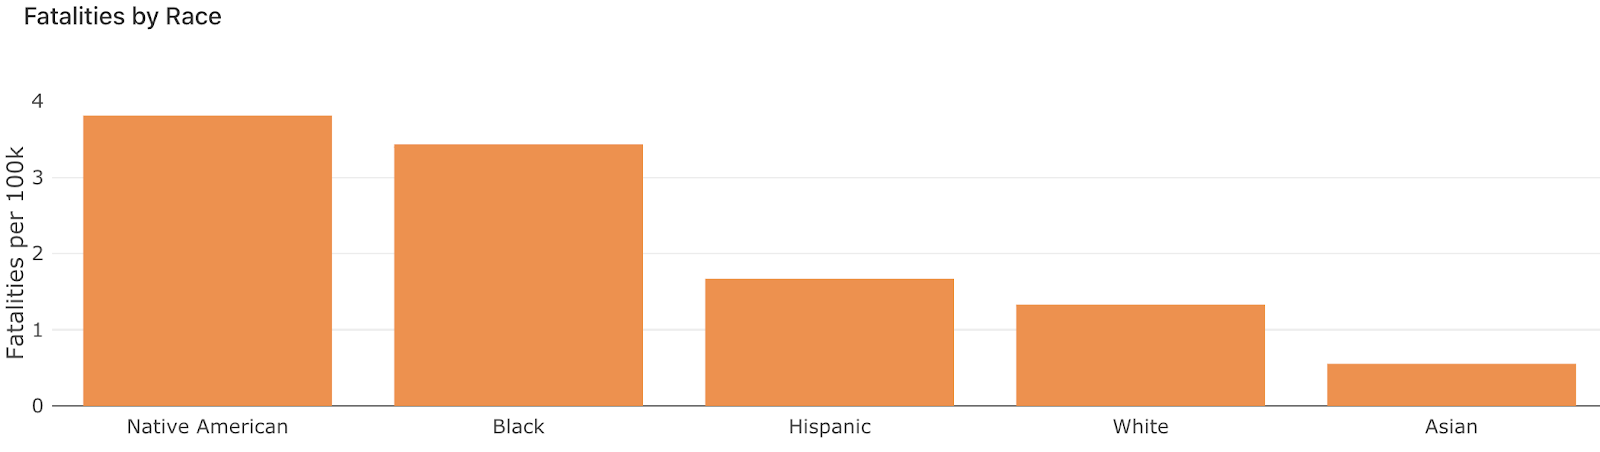
Fatal shootings by race in 2015–2020
In Utah, this race-based discrepancy is even more pronounced. Although Black people make up only 1% of Utah’s population, they accounted for 10% of police fatalities. The same trend persists in Illinois, where the fatality rate for Black people is almost 10 times higher than for white people. And these are just two examples on a long list of states exhibiting disproportionately higher rates of fatal shootings by race. To help address these concerns of racial bias, police departments across the country have instituted unconscious bias training, only to find it had no impact on the numbers in the field.6
We can look at the Sankey diagram below to look at the various breakdowns of fatal shootings. Going from left to right:
- 4% of victims are female
- 51% White, 26% Black, 19% Hispanic, 2% Asian, and 2% Native American victims
- 23% of victims showed signs of mental illness, indicated by on-scene mental health crises or news reports
- 91% of victims were determined to be armed, with objects ranging from toy weapons to pepper spray to tasers to guns
- 12% of incidents may have been recorded by body cameras
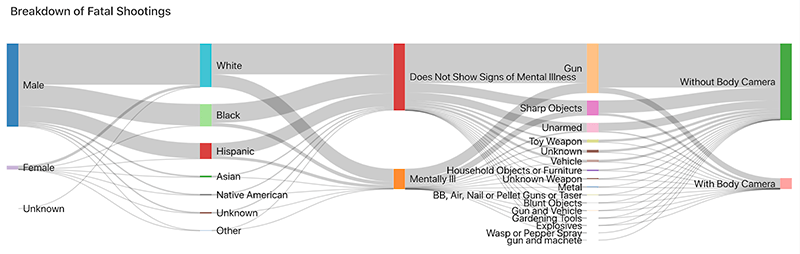
2015–2020 breakdown of fatal shootings in the U.S.
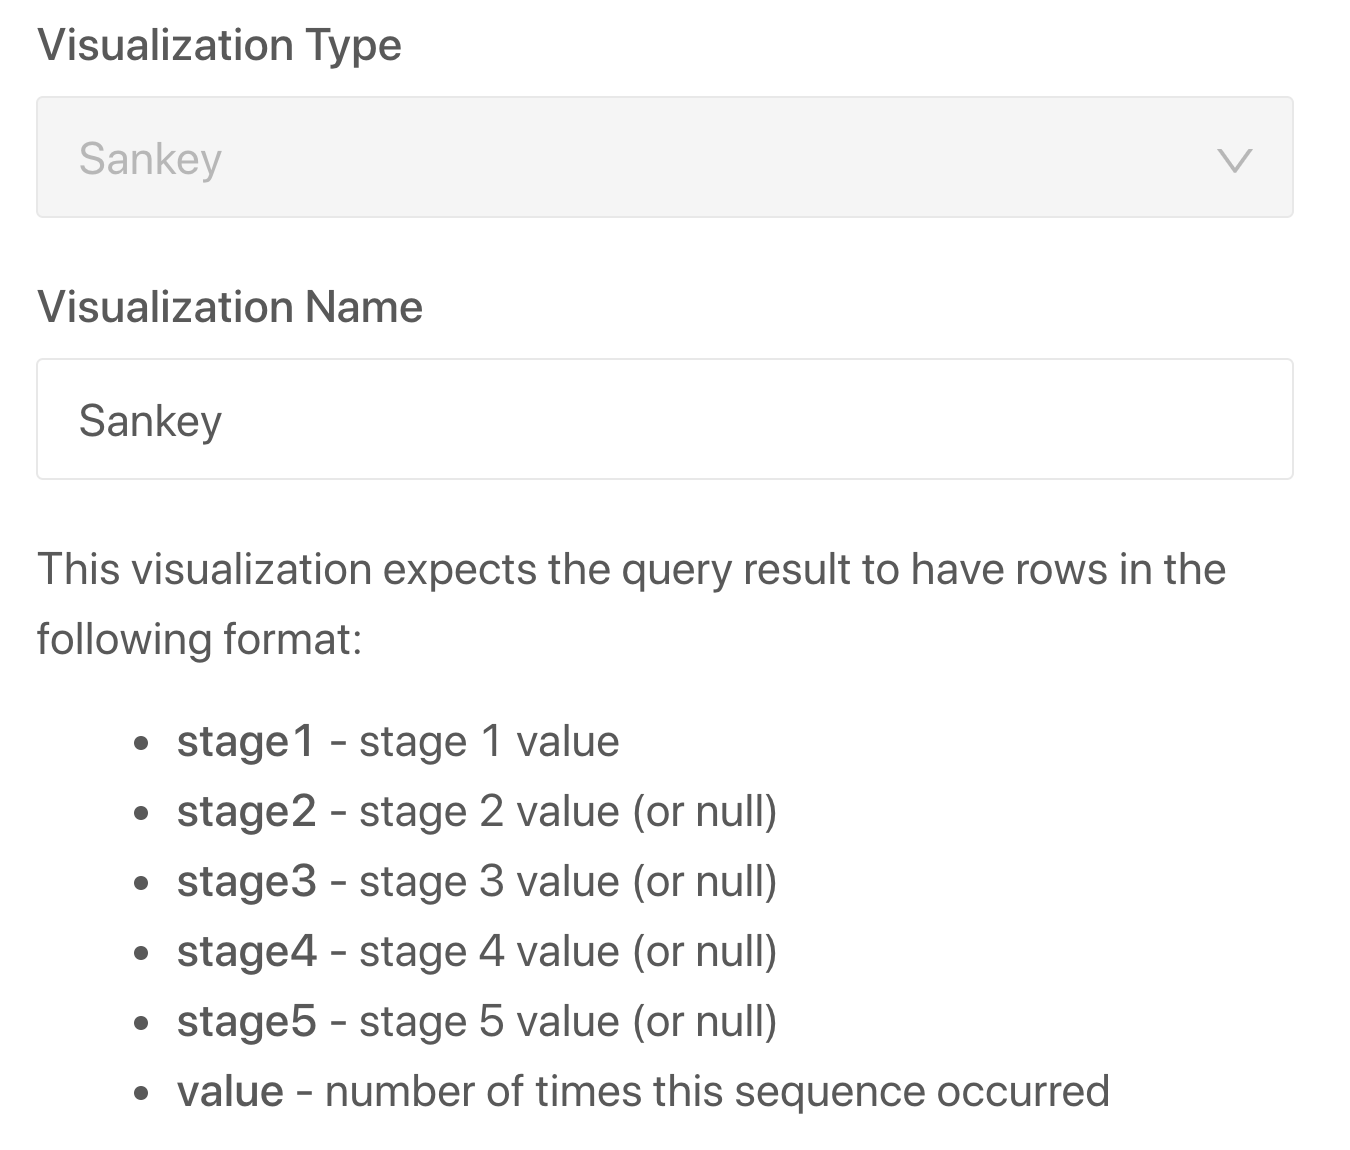
All that it takes to generate these visualizations in the SQL Analytics workspace is a few lines of SQL.
Use of body cameras is actually declining
Since 2015, the United States has averaged 986 fatal shootings by on-duty police per year. As of this writing, there have only been 14 days in 2020 without a fatality by law enforcement.7 Despite the public outcry for police officers to wear body cameras, we found that body camera recordings of such incidents have actually decreased since 2016, as illustrated in the funnel chart below.
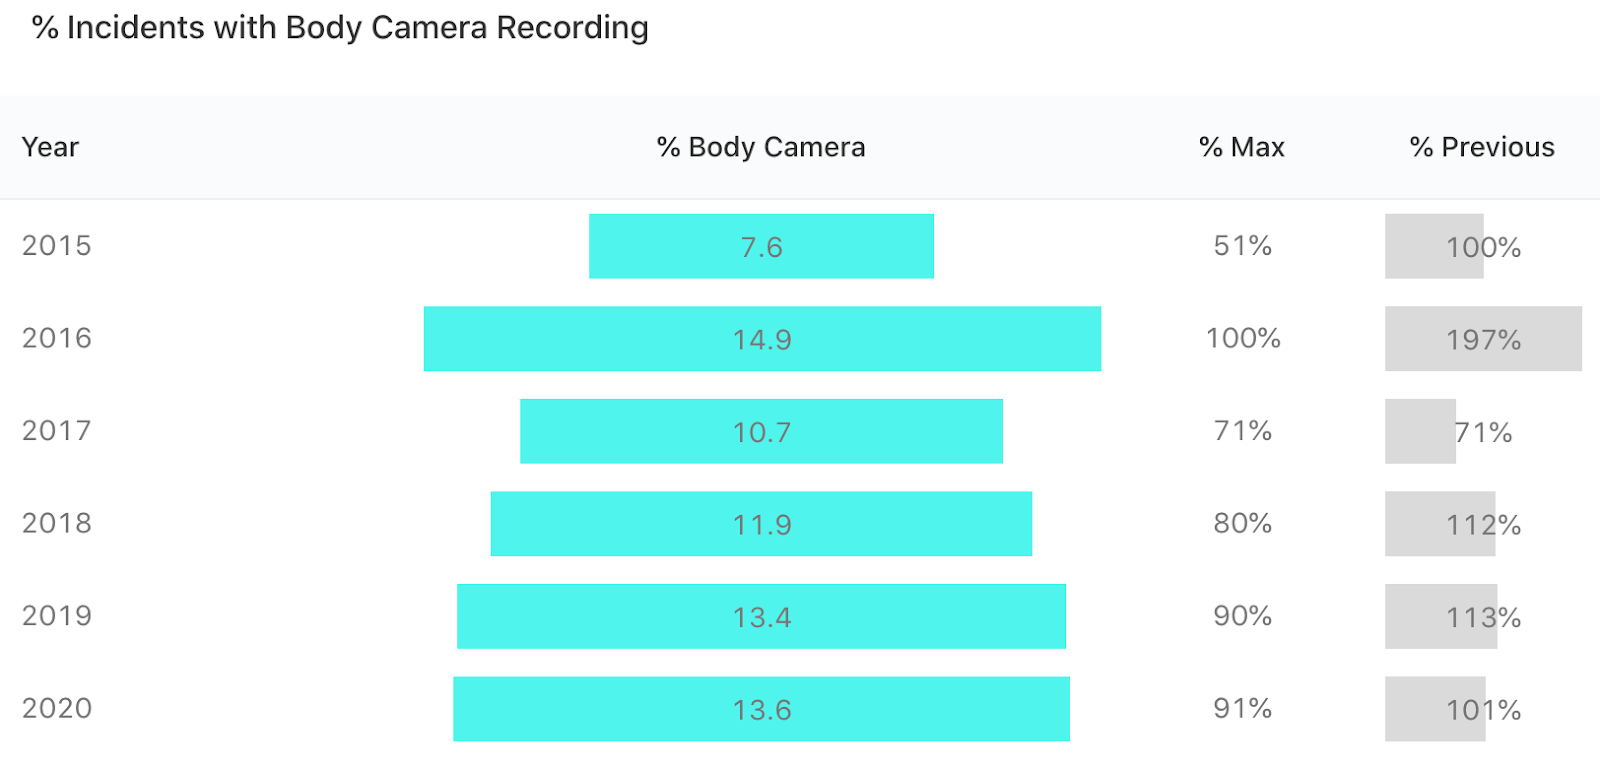
Percentage of incidents with body camera recordings
In 2016, 14.9% of fatal shootings had body camera recordings, and every year since then has had a lower rate of body camera recordings, despite the annual fatality rate remaining constant. How is it that 96% of Americans own a cellphone of some kind,8 but only 1 in 7 fatal shootings had any police recording of the incident? When six-year-old Jeremy Mardis was killed by police in 2015, “evidence from a police body-worn video camera was cited as being contributory to the speed of the arrests.”9 Without the body cameras, law enforcement would not have been able to make an arrest as justly and quickly as without it. According to the Bureau of Justice Statistics, 47% of general-purpose law enforcement agencies in 2016 had acquired body-worn cameras yet the percentage of fatal encounters where body camera recordings were present is far below that number.10
Now that we have established nationwide trends of fatal encounters, let’s compare how Alaska, California and New York -- the three states with the highest police funding per capita -- differ in terms of racial disparities, body camera coverage of incidents, and mental health episodes at the scene of interaction with police.
State Comparison: Alaska, California and New York
Alaska ranks first in police fatalities per capita
In the bar chart below, we can visually compare how each state ranks, and we can see there is a roughly 10x difference in per capita fatalities with the states on the left- and right-hand sides of the chart. Alaska has the dubious distinction of ranking first among U.S. states in police fatalities per capita in 2017, 2019 and 2020 (it still remained in the top five in 2015, 2016 and 2018). By comparison, in 2020, California is midrange at 20th highest, whereas New York is near the bottom with the sixth lowest fatality rate per capita.
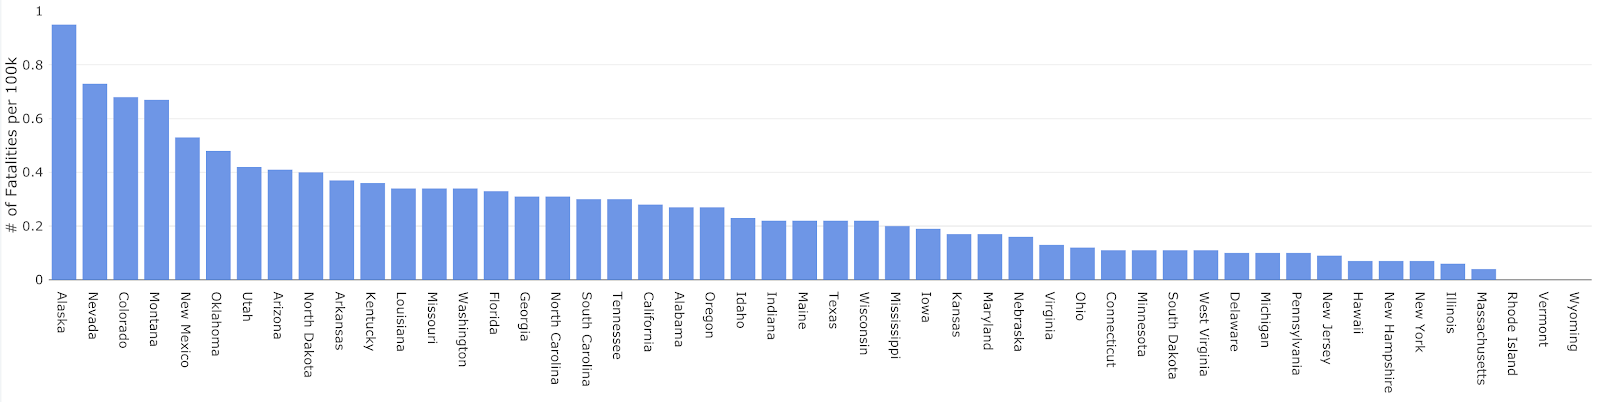
Fatalities per 100K individuals in 2020
So how is it that these three states spend the most on law enforcement per capita, but have very different outcomes? Following up on the previous section, let’s start by taking a closer look at the breakdown of fatalities by race in these three states as well as their overall fatalities. The table below shows the total fatalities from 2015–2020 per 100,000 individuals.
| State | Black | Native American | Hispanic | White | Asian | Overall |
| Alaska | 14.2 | 8.6 | – | 4.9 | 4.1 | 5.5 |
| California | 6.0 | 2.7 | 2.1 | 1.6 | 0.5 | 2.2 |
| New York | 1.7 | – | 0.2 | 0.3 | 0.1 | 0.5 |
Fatality rates from 2015–2020 per 100,000 individuals
Comparing these fatality rates overall, we see that the magnitude of the fatal officer-involved shootings is the highest in Alaska. Alaska has 11x more fatalities per capita than New York, and California has over 4x more fatalities than New York. FiveThirtyEight found that while police fatal shootings are decreasing in urban areas, they are offset by the increase in fatalities in suburban and rural areas.11 One plausible explanation for why the rates are dropping in urban areas is due to “reforms to use-of-force policies implemented in the wake of high-profile deaths.” Additionally, the increase in rural and suburban areas could be due to the increase in police budgets and the transfer of surplus military equipment to local police departments since 1997.12
What is also interesting to note is that Alaska has the highest gun ownership per capita,13 while New York has the third-lowest and California the ninth-lowest gun ownership per capita, respectively. There is a statistically significant, positive correlation between gun ownership and shootings by police, with a correlation strength value at 0.64 and a p-value of 10-7. The more individuals per capita who own guns, the more police shootings there are — this is not due to random chance alone. At the time of the fatal incident, 57% of all victims in our data set were armed with a gun.
California has the highest racial disparity
When taking a look at the disparities by race and ethnicity, Black people in Alaska are 8x more likely to be killed by police than Black people in New York, and that figure jumps to 41x when comparing Asian people in Alaska to Asian people in New York. However, if we were to aggregate the non-white fatalities per capita (Black, Hispanic, Asian and Native American), California actually exhibited the highest racial disparity ratio: 11.3 fatalities per 100,000 non-white individuals vs. 1.6 per 100,000 white individuals, with a difference of 7x. In contrast, New York had a 6.7x difference, and Alaska, 5.4x. For a progressive state, California has a very large divide among victims of police violence and brutality.
New York has 15% more victims with mental illness than the U.S. average
Another concerning finding we uncovered is the alarmingly high rates of victims suffering from mental illness. Recall from the Sankey diagram above that the nationwide percentage of individuals with a mental health history or those who show mental distress at the scene of interaction with police is 23%. In New York, 38% of victims showed signs of mental illness, compared to 15% in Alaska and 23% in California. In a study released by the Treatment Advocacy Center,14 people with untreated mental illnesses are “16 times more likely to be killed during a police encounter than other civilians approached or stopped by law enforcement.” In the United States, over 240 million calls are made to 911 per year,15 and 1 out of 10 represent mental health–related reports.16 However, only 15% of police departments require officers to go through Crisis Intervention Training (CIT) that involves training on de-escalating situations and identifying mental health distress signs.17
On the other hand, police officers are first responders who receive perturbing calls for service for a variety of traumatic events, including homicides and domestic abuse. The repeated exposure to these stressors can lead to burnout, post-traumatic stress disorder (PTSD) and other mental illnesses. In fact, a study by Ruderman Family Foundation in 2017 found that more police died by suicide than in the line of duty. In addition, according to a survey conducted by NBC4 I-Team on over 600 police officers at the Los Angeles Police Department, a staggering 90% of police officers said seeking mental health assistance and therapy is stigmatizing. As a community, we ought to ask, how can we better support both civilians and police officers experiencing mental health illnesses?
Alaska has 0% body camera coverage of fatal encounters in 2015, 2019 and 2020
Let’s now compare the percentage of body camera recordings in these states. Back in 2015, New York had 0 body camera recordings of their 19 fatal encounters that year. Since 2016, body camera coverage of incidents has increased and is now at 36%. California has steadily increased its body camera usage, but its rate is two-thirds that of New York. Alaska, on the other hand, has actually seen a sharp decline in body camera coverage after 2017. Alaska has 0% body camera coverage in 2015, 2019 and 2020, despite the fatality rate remaining disturbingly high. Only four out of 40 fatalities in the past five years in Alaska have any body camera evidence. In an article from the Anchorage Daily News published in September 2020, they cited “funding as a primary reason for the delay” in adopting body cameras. However, Anchorage police have never applied for grants to fund body cameras. The Anchorage police force has 430 officers and a budget of $121 million, but none of that money is currently going toward body cameras.
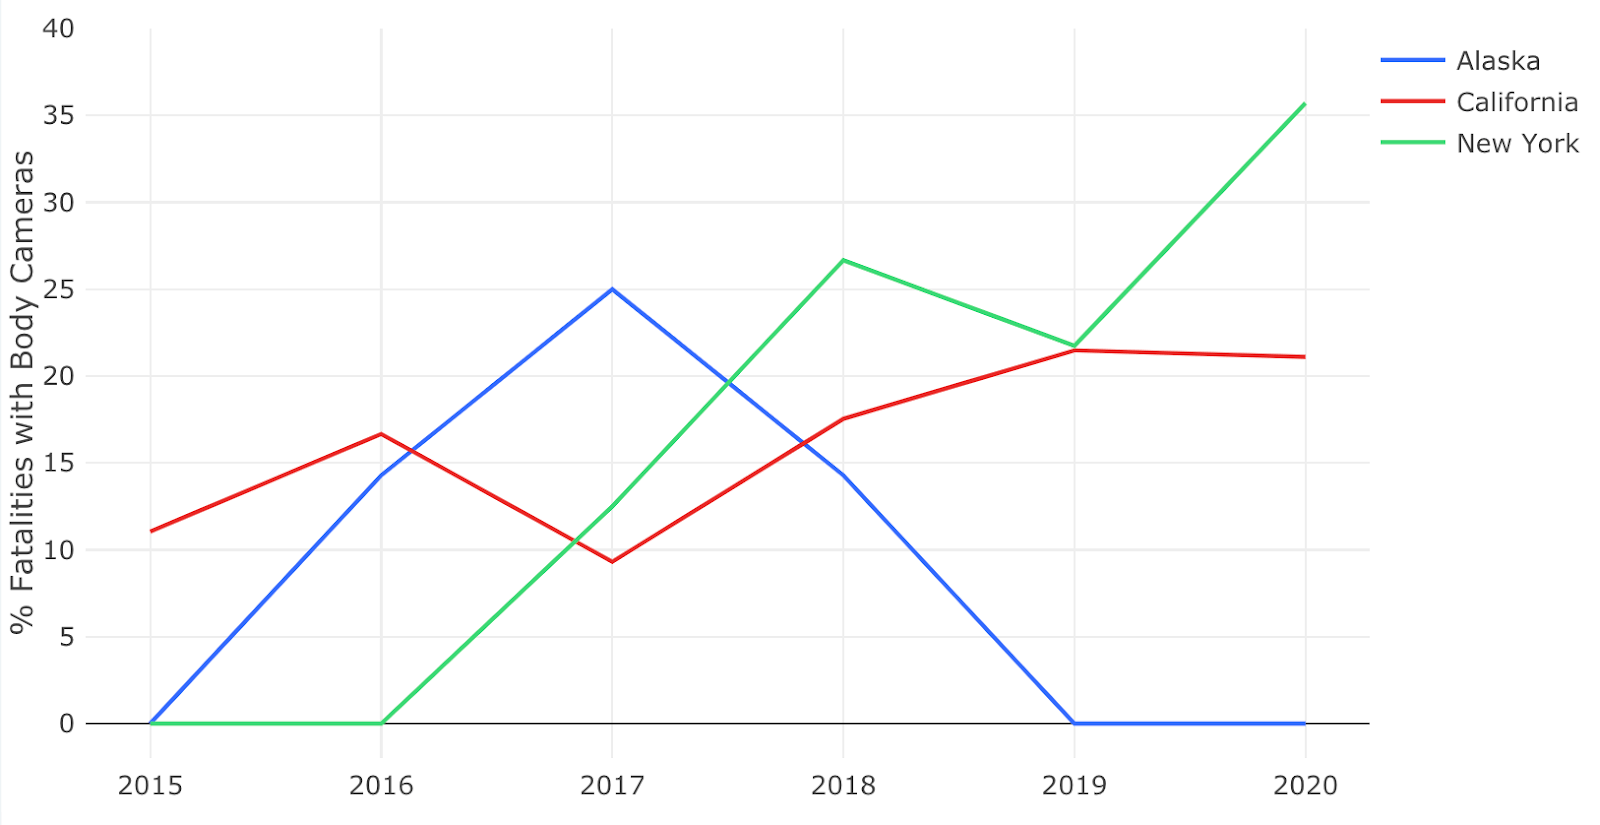
Body camera rates in Alaska vs. California vs. New York
What the data does NOT tell us
Recognizing the limitations of the data and our analysis is important. The database we accessed to analyze police fatalities is far from complete. It is worth noting that it currently does not include any officer information (e.g., number of officers, tenure, past complaints, racial group, gender, etc.), and it excludes any deaths that resulted from non-shootings as well as non-fatal shootings. The Citizens Police Data Project collects and publishes information about police misconduct in Chicago, and some officers have been accused of misconduct over 100 times, and 1 out of 5 allegations are related to the use of excessive force. We could not locate a data set that includes officer information.
Looking ahead
Through our analysis of police shootings and law-enforcement funding, we hope that more people will be empowered to analyze current events with a more critical, data-driven eye. We also encourage the community to recognize the current limitations to our available data, be inspired to create space for conversations, and push toward movements that demand greater data transparency and availability from law enforcement agencies. As the old adage goes, “What gets measured, gets improved.” If the data on deadly encounters with police remains incomplete, incomprehensive and difficult to obtain, it will remain challenging to enact effective procedures to reduce use of force and improve trust between civilians and police.
How to reproduce and expand upon our analyses
The built-in visualizations in the SQL Analytics workspace helped to quickly derive insight from this data. We have provided a collection of notebooks that contains all of the queries used to generate our findings and visualizations. We encourage you to expand upon our analyses and share the results with your family, friends and colleagues. Further, we will host a tech talk on December 10, 2020, at 9:00 AM PST to show you how to create these dashboards in SQL Analytics.
References
1“What the data says about police shootings,” Nature, September 4, 2019
2“Not just ‘a few bad apples’: U.S. police kill civilians at much higher rates than other countries,” Prison Policy Initiative, June 5, 2020.
3“How The Washington Post is examining police shootings in the United States,” The Washington Post, July 7, 2016.
4“State Population By Race, Ethnicity Data,” Governing: The Future of States and Localities.
5“State and Local Finance Initiative: Police and Corrections Expenditures, 2011 to present.
6“NYPD Study: Implicit Bias Training Changes Minds, Not Necessarily Behavior,” NPR, September 10, 2020.
7“Police Violence Map,” Mapping Police Violence.
8“Mobile Fact Sheet,” Pew Research Center, June 12, 2019.
9“Shooting of Jeremy Mardis,” Wikipedia.
10“Body-Worn Cameras in Law Enforcement Agencies, 2016,” Bureau of Justice Statistics, November 2018.
11“Police Are Killing Fewer People In Big Cities, But More In Suburban And Rural America,” FiveThirtyEight, June 1, 2020.
12“How police departments got billions of dollars of tactical military equipment,” Marketplace, June 12, 2020.
13“Gun Ownership by State 2020,” World Population Review.
14“People with Untreated Mental Illness 16 Times More Likely to Be Killed by Law Enforcement,” Treatment Advocacy Center.
15“Understanding Police Enforcement: A 911 Data Analysis,” Vera Institute of Justice.
16“The Daily Crisis Cops Aren’t Trained to Handle,” Governing, May 2016.
17“Police have shot people experiencing a mental health crisis. Who should you call instead?,” USA Today, September 18, 2020.
Get the latest posts in your inbox
Subscribe to our blog and get the latest posts delivered to your inbox.