Creating an IP Lookup Table of Activities in a SIEM Architecture
by Sepideh Ebrahimi and Andy Hutchinson
When working with cyber security data, one thing is for sure: there is no shortage of available data sources. If anything, there are too many data sources with overlapping data. Your traditional SIEM (security information and event management) tool is not really fit to handle the complex transformation and stitching of multiple data sources in an efficient manner. Besides, it is not cost-effective to process terabytes or petabytes of event data on a daily basis in a SIEM system.
One common network security use case requiring marrying multiple data sources is the attribution of an IP address to a certain user. When working with a traditional SIEM tool, to determine malicious or suspicious activities on the network, SOC (security operation center) analysts have to launch multiple queries against different data sources (VPN, DHCP, etc.) and manually stitch them together to find out the timeline and actions of an IP address. This could take up to 15 minutes per IP address. Precious time in the event of a security incident that could be saved if you automated aggregation and curation of data before landing it in the SIEM solution.
In this blog, we will cover a simplistic approach to data collection, combining multiple data sources and automation to create an IP lookup table. This table is a fundamental building block of threat intelligence to create a holistic picture of the activities in your network. It will enable you to query IP addresses in a given time window, attribute them to users/ MAC addresses and track events in the order they happened.
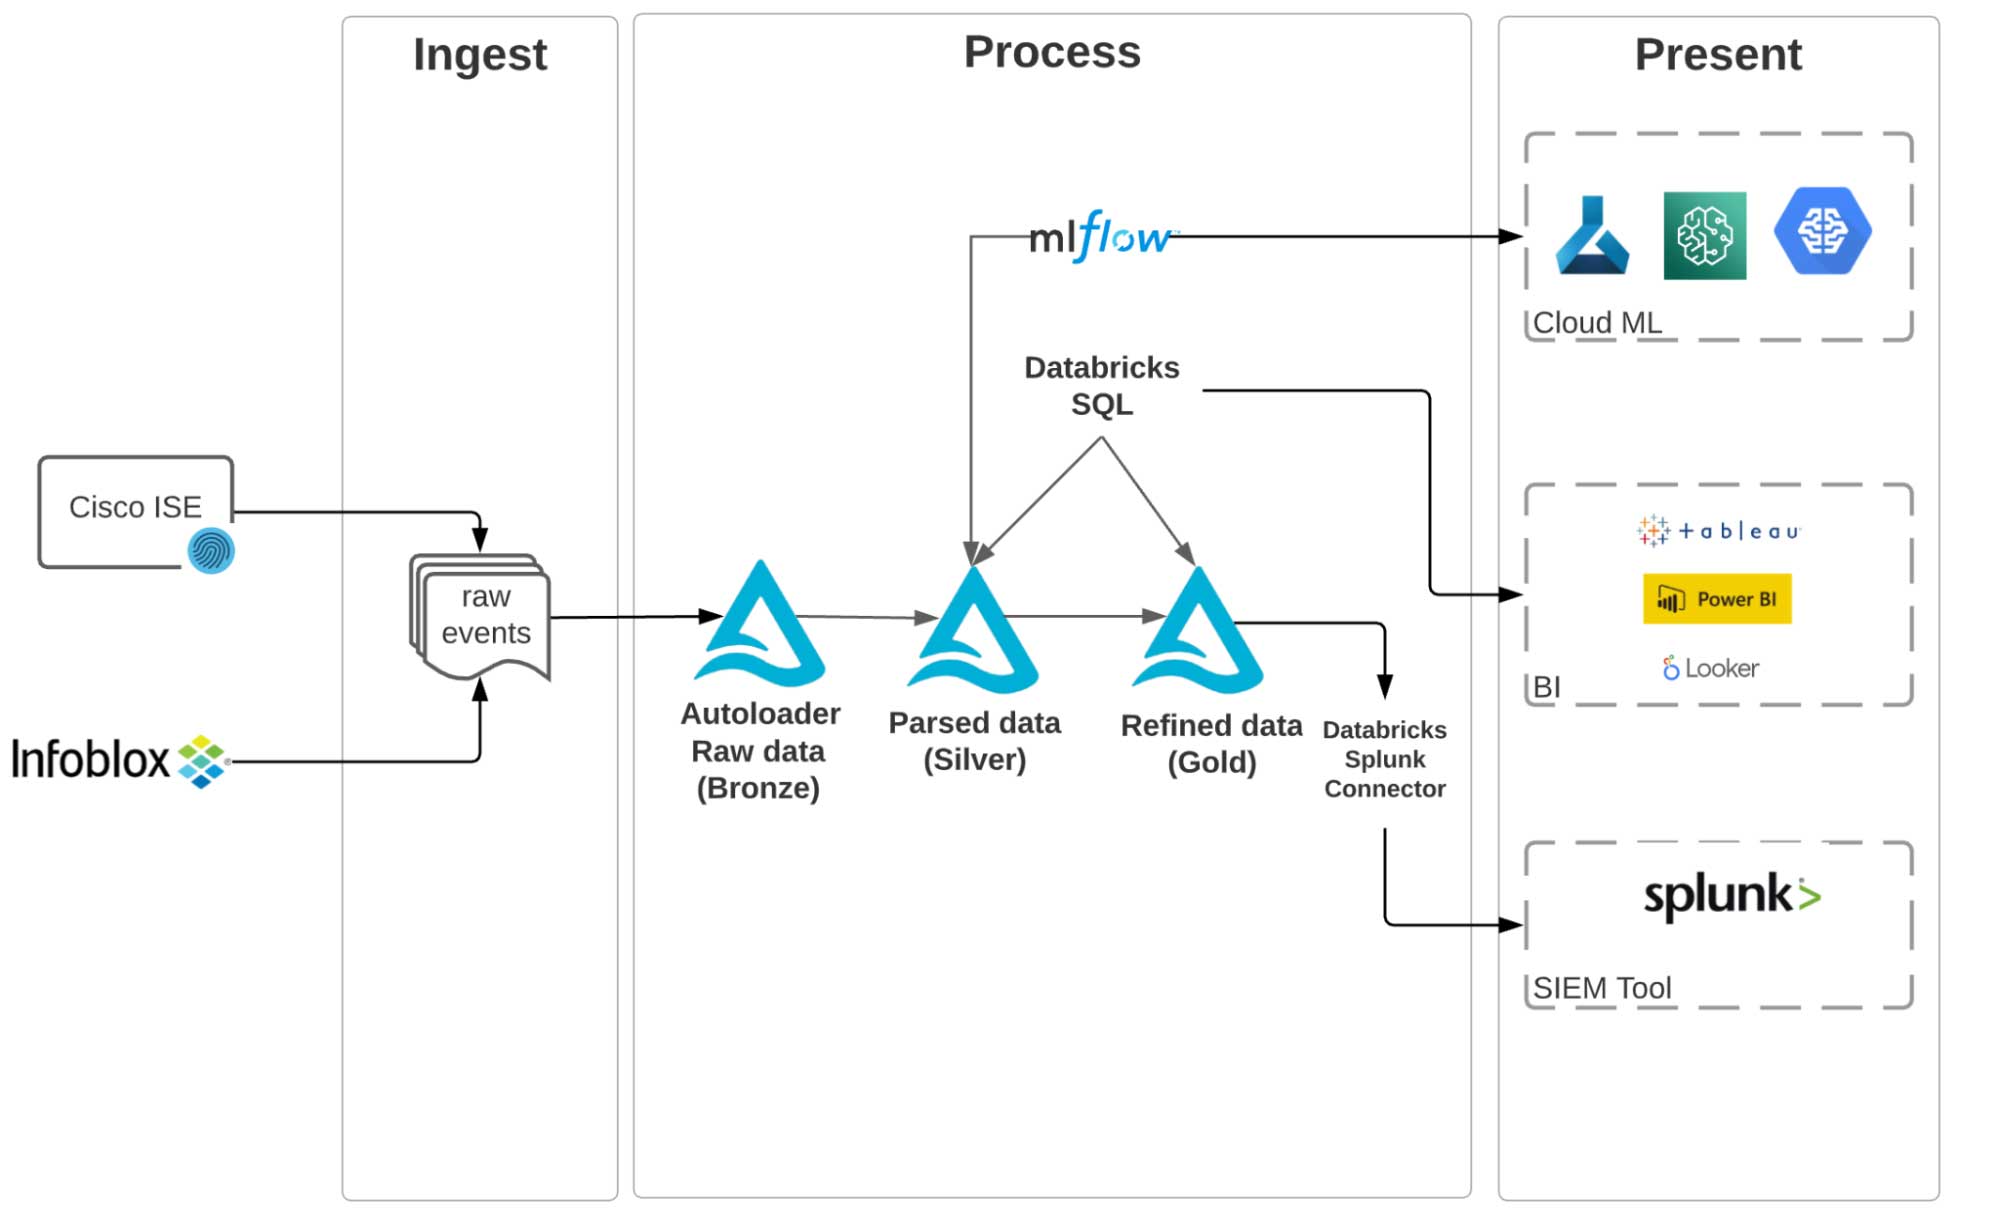
We will use Cisco ISE Posture and Profiler events as VPN logs and Infoblox DHCP logs for off-VPN activities. We are using Databricks Labs Data Generator to simulate these event logs and push them into an S3 bucket. In a real-world scenario, you can use a real-time streaming service such as Kinesis Firehose to push such logs from on-premise servers into S3. These logs are then ingested using the Databricks Lakehouse Platform. We have built the entire end-to-end pipeline using Delta Live Tables, which allows us to ensure data quality in each stage of the incremental data curation, as well as lineage for the end-to-end pipeline. Once data is curated into a master IP lookup table, a SIEM tool such as Splunk (using Databricks Splunk add-on) or a BI tool or dashboard such as Tableau, PowerBI or Looker can be used as the presentation layer.
Cyber security lakehouse architecture
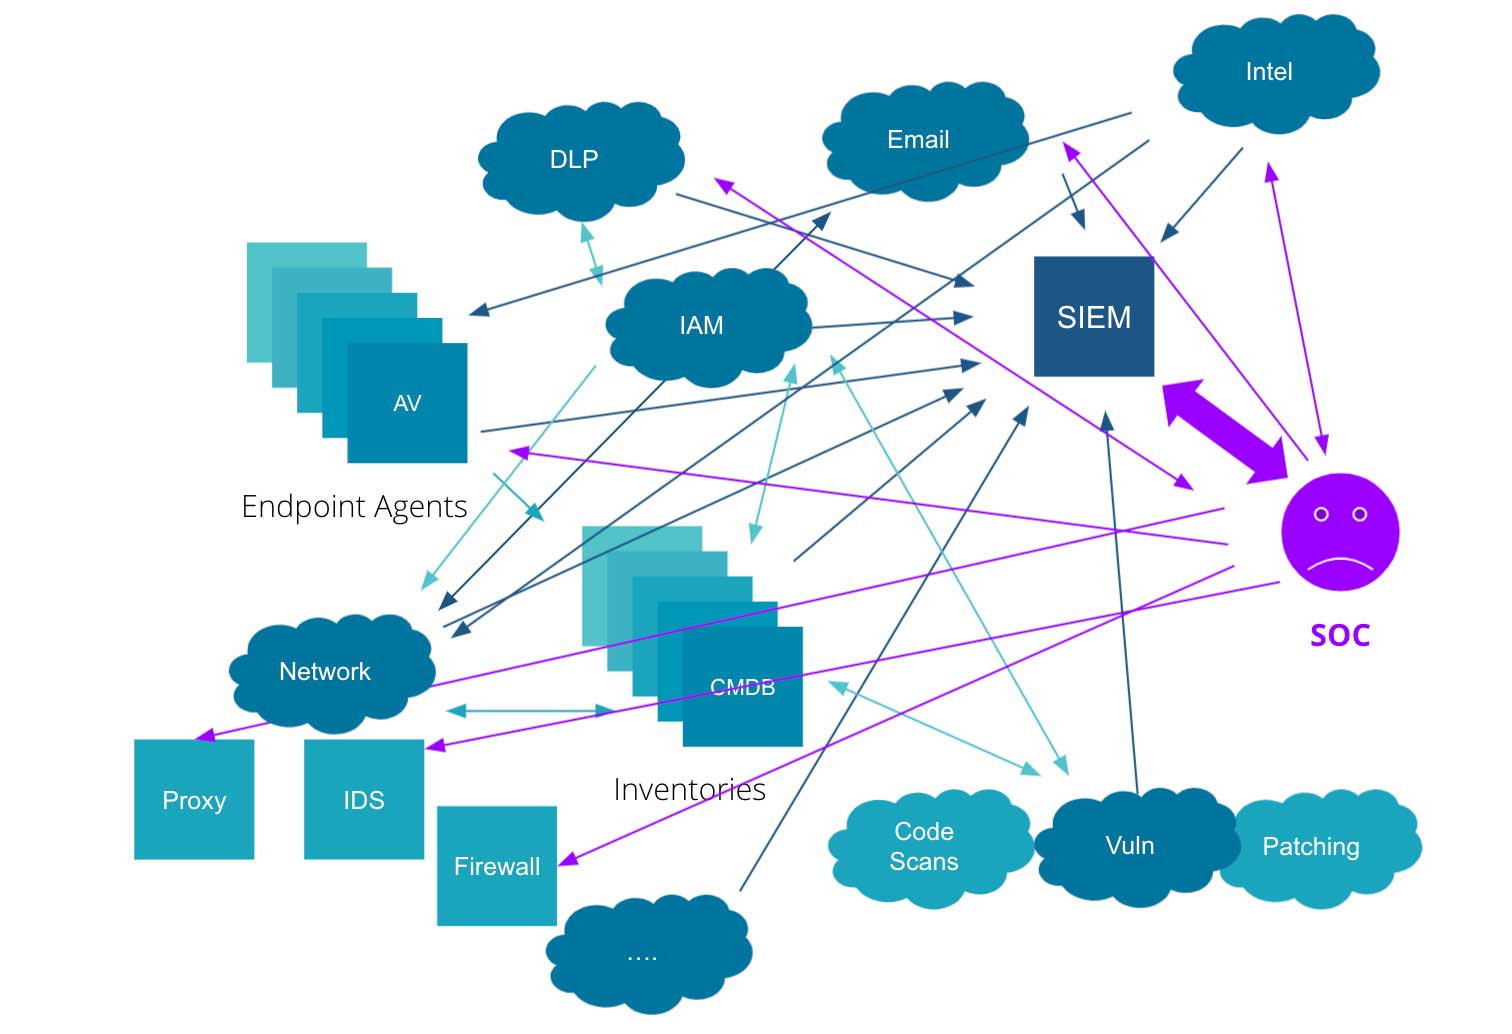
Figure 1 illustrates an example of a typical cyber security ecosystem. It is an entangled web of different data sources and systems with a SIEM tool in the mix. The SOC analyst has to query different sources and stitch results together to get meaningful insights, which gets even more complicated with increasing volumes of event data. An average enterprise will have petabytes of data to comb through, and without the right tools to handle these massive datasets, this task could be quite tedious, if not impossible.
We propose an alternative cyber security lakehouse architecture, as illustrated in figure 2 below. The key steps to realize this architecture are:
- Land data from all sources into cheap object storage
- Shift the heavy lifting into a highly-optimized Big Data platform: Process and curate and stitch data using Delta Lake
- Only move curated data once it is ready to be consumed into your SIEM solution
Among other advantages, the Lakehouse architecture delivers the following benefits:
- Breaking silos: As data is available to everyone on the same platform, each data persona can use their favorite tools (Notebooks, DBSQL, etc.) on top of Delta Lake to access a single source of truth. Furthermore, they can easily review code, pair program and collaborate on the same platform without having to export code or data somewhere else.
- Combining batch and streaming: Batch and streaming queries are made almost identical using Delta Lake. You can build your pipelines once and make them future-proof in case processing mode changes in the future.
- Quality assurance: You can set data quality constraints in different stages of your processing pipeline using EXPECTATIONS. This will allow you to choose how to react to unexpected data.
Building cyber security data pipelines with Delta Live Tables
From Delta Live Tables official documentation:
Delta Live Tables is a framework for building reliable, maintainable, and testable data processing pipelines. You define the transformations to perform on your data, and Delta Live Tables manages task orchestration, cluster management, monitoring, data quality, and error handling.
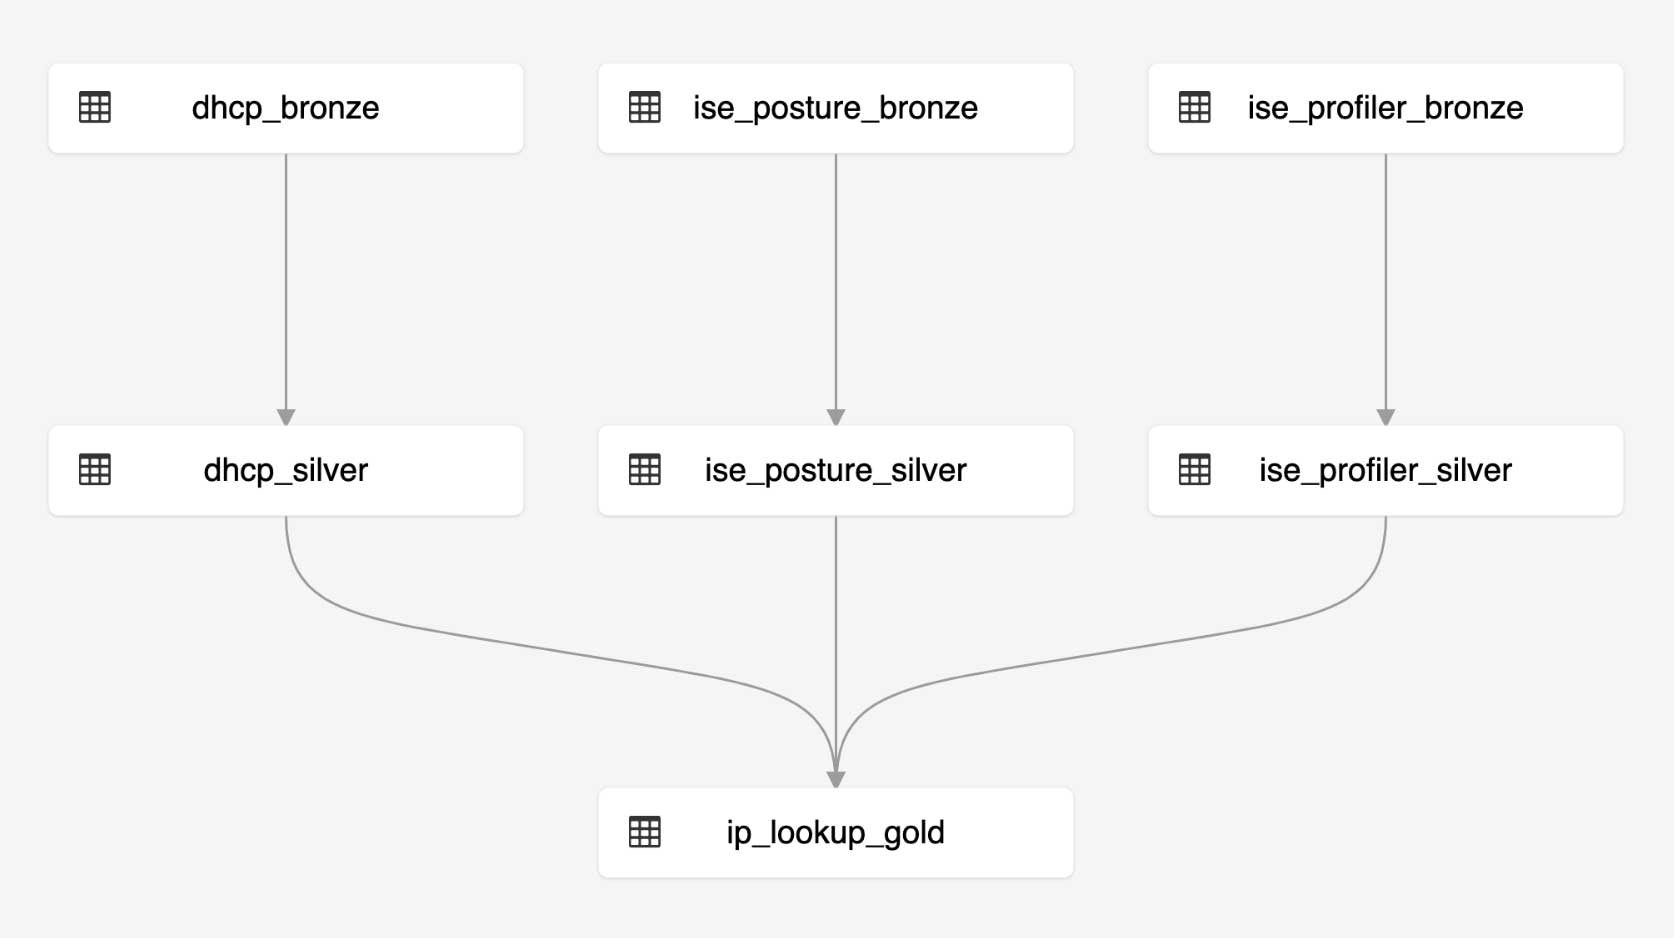
The diagram below shows the end-to-end pipeline to create an IP Lookup table from VPN and DHCP logs. We chose to use Delta Live Tables (DLT) to build the pipeline because of its simplicity, the data quality assurance measures it provides and the ability to track the lineage of the entire pipeline. With DLT, you can easily build your ETL pipelines using either Python or SQL. The below shows the DAG of the ETL pipeline we built to create an IP Lookup table.
Code walkthrough
You can find the notebooks here. As illustrated in diagram 1, we land each data source in a raw (Bronze) layer. Then we parse the raw logs using appropriate parsers into a Silver layer. Finally, we get the columns of interest (IpAddress, MacAddress, Username, etc.) from the parsed tables and combine them into a curated, ready to consume IP Lookup table (Gold).
To parse Cisco ISE Profiler events, as they come in a semi key-value style, we can use PySpark’s from_json method. In addition, we have extracted event timestamps from metadata (header) accompanying the logs. We have used a similar method to parse CISCO ISE Posture events.
We use regex mapping (PySpark’s regexp_extract method) to parse DHCP logs. Each message type (DHCPACK, DHCPREQUEST, etc.) is parsed using its expected regex pattern. We have chosen to parse DHCP messages of types ACK,NACK, OFFER, REQUEST, RELEASE, DECLINE, and EXPIRE for simplicity.
This is what DHCP records look like before parsing:
And here is what the schema of the parsed Delta table looks like:
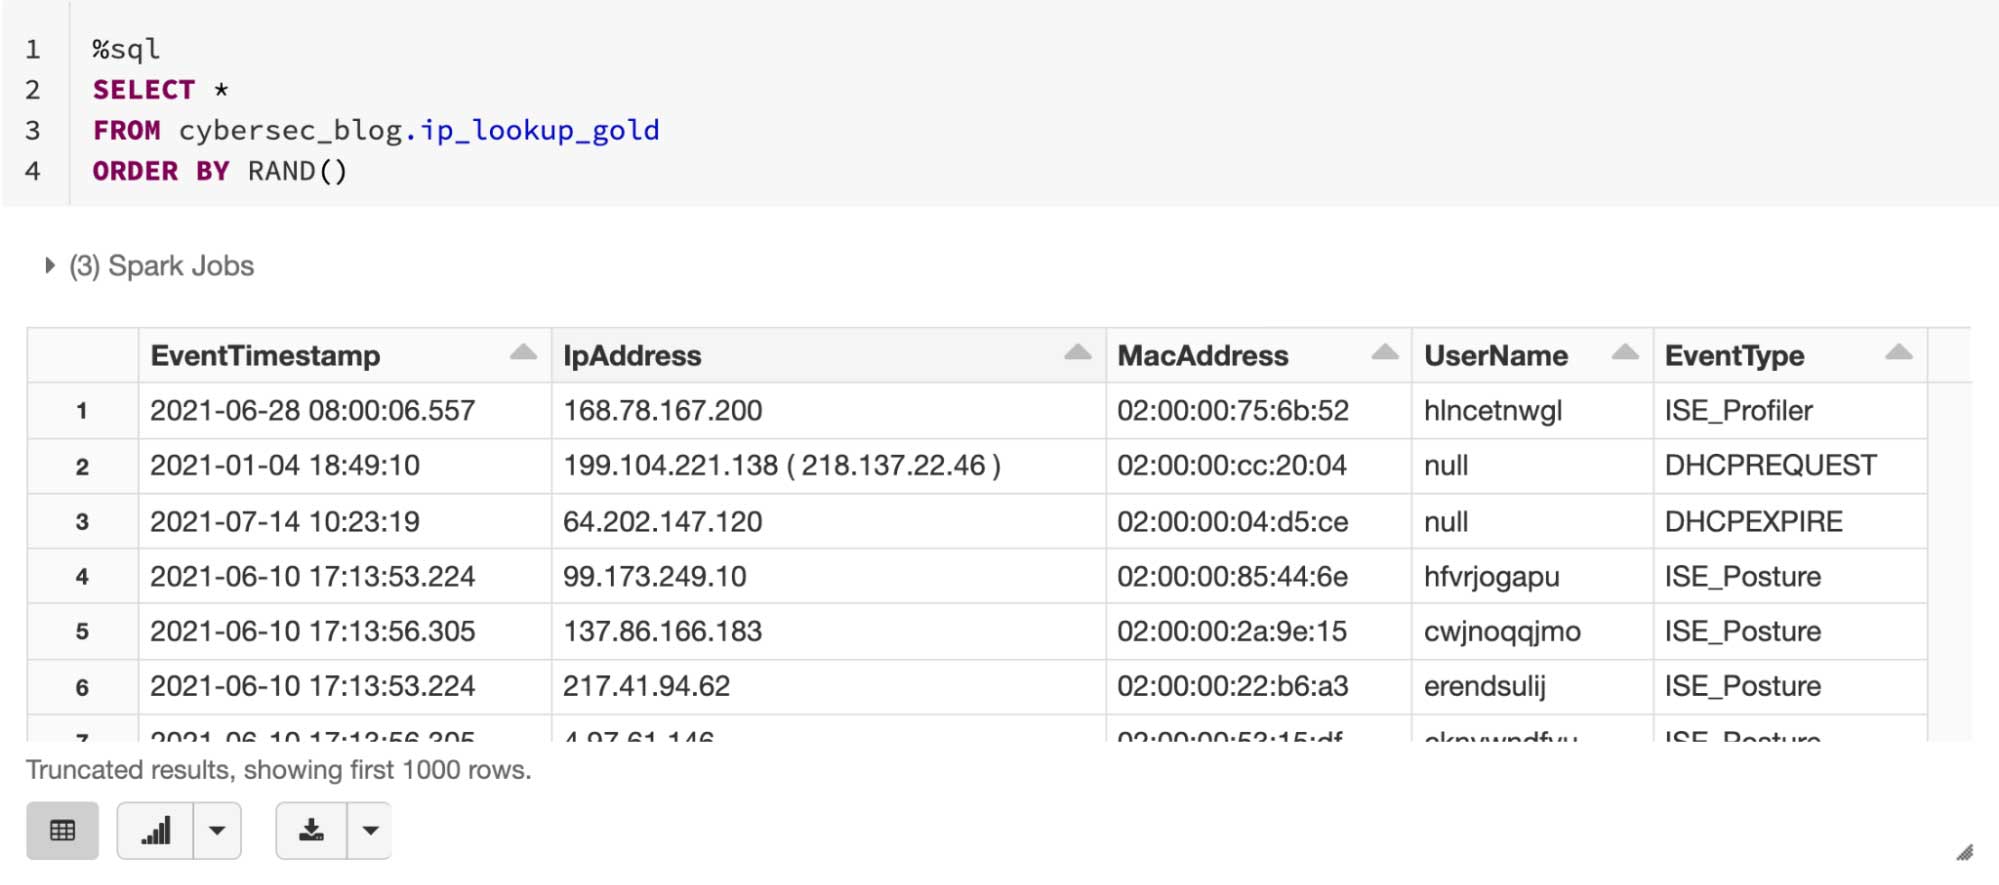
Finally, once the three data sources are parsed and combined, we have access to IP activities and their timelines, as illustrated in figure 3:
Next steps
In this blog post, we have walked you through the steps to build a simple IP attribution table. This table is the first building block to construct a holistic picture of activities in your network for threat detection and incident response at all times. A sensible next step is to onboard more data sources and add more columns to this table.
As you have more and more information about IP addresses in your table, you can start extracting patterns of “normal” behavior for an IP in your network using machine learning algorithms. Then you can detect anomalies and flag an IP if it behaves outside the normal boundaries.
You can run the accompanying notebooks by following the links posted directly below:
For more Cyber Security content, check out Building a Cybersecurity Lakehouse for CrowdStrike Falcon Events and Detecting Criminals and Nation States through DNS Analytics blogs.
Get the latest posts in your inbox
Subscribe to our blog and get the latest posts delivered to your inbox.