Orchestrating Databricks Workloads on AWS With Managed Workflows for Apache Airflow
by Naseer Ahmed and Igor Alekseev
In this blog, we explore how to leverage Databricks’ powerful jobs API with Amazon Managed Apache Airflow (MWAA) and integrate with Cloudwatch to monitor Directed Acyclic Graphs (DAG) with Databricks-based tasks. Additionally, we will show how to create alerts based on DAG performance metrics.
Before we get into the how-to section of this guidance, let’s quickly understand what are Databricks job orchestration and Amazon Managed Airflow (MWAA)?
Databricks orchestration and alerting
Job orchestration in Databricks is a fully integrated feature. Customers can use the Jobs API or UI to create and manage jobs and features, such as email alerts for monitoring. With this powerful API-driven approach, Databricks jobs can orchestrate anything that has an API ( e.g., pull data from a CRM). Databricks orchestration can support jobs with single or multi-task option, as well as newly added jobs with Delta Live Tables.
Amazon Managed Airflow
Amazon Managed Workflows for Apache Airflow (MWAA) is a managed orchestration service for Apache Airflow. MWAA manages the open-source Apache Airflow platform on the customers’ behalf with the security, availability, and scalability of AWS. MWAA gives customers additional benefits of easy integration with AWS Services and a variety of third-party services via pre-existing plugins, allowing customers to create complex data processing pipelines.
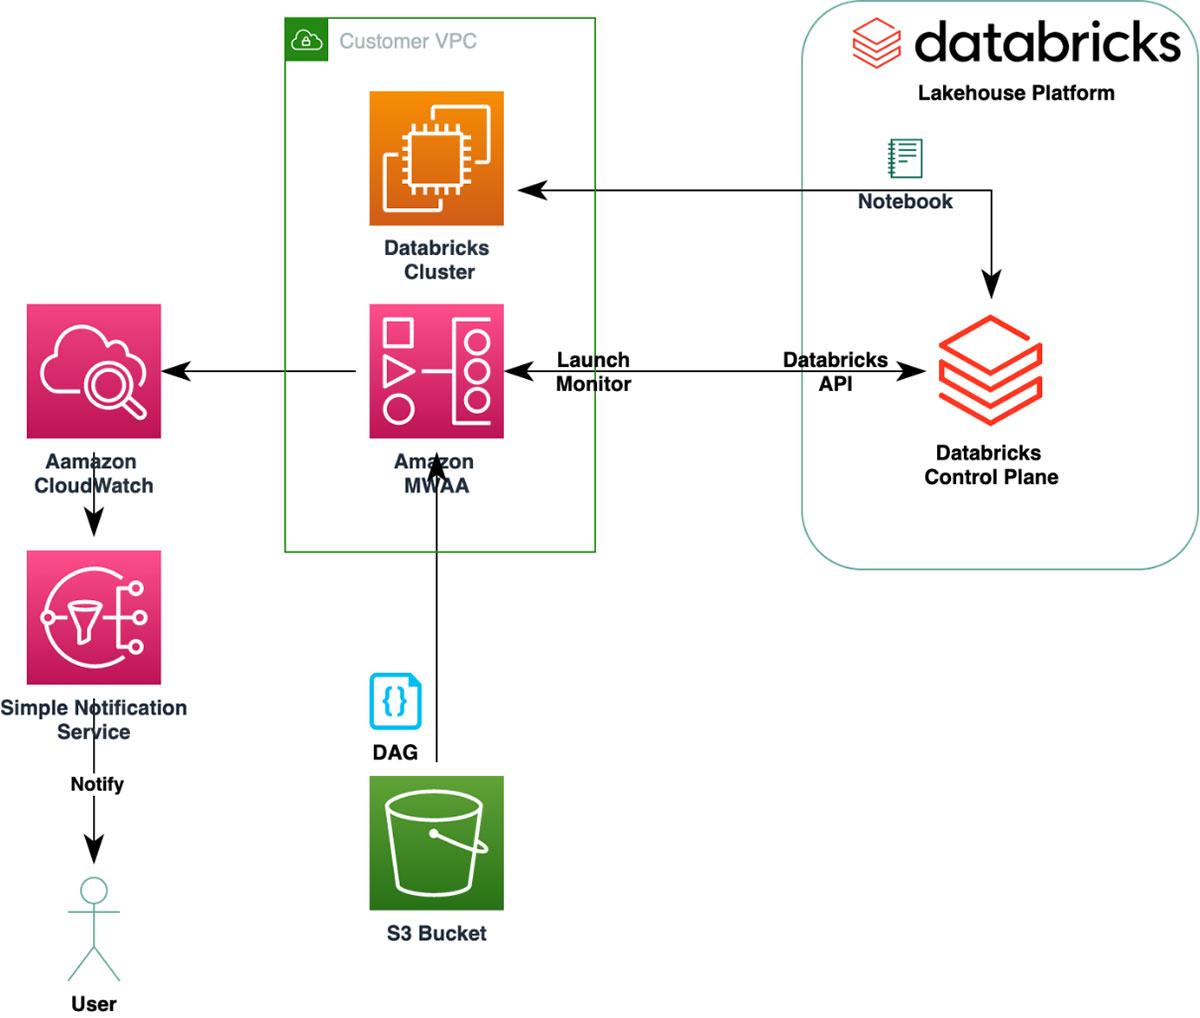
High-Level architecture diagram
We will create a simple DAG that launches a Databricks Cluster and executes a notebook. MWAA monitors the execution. Note: we have a simple job definition, but MWAA can orchestrate a variety of complex workloads.
Setting up the environment
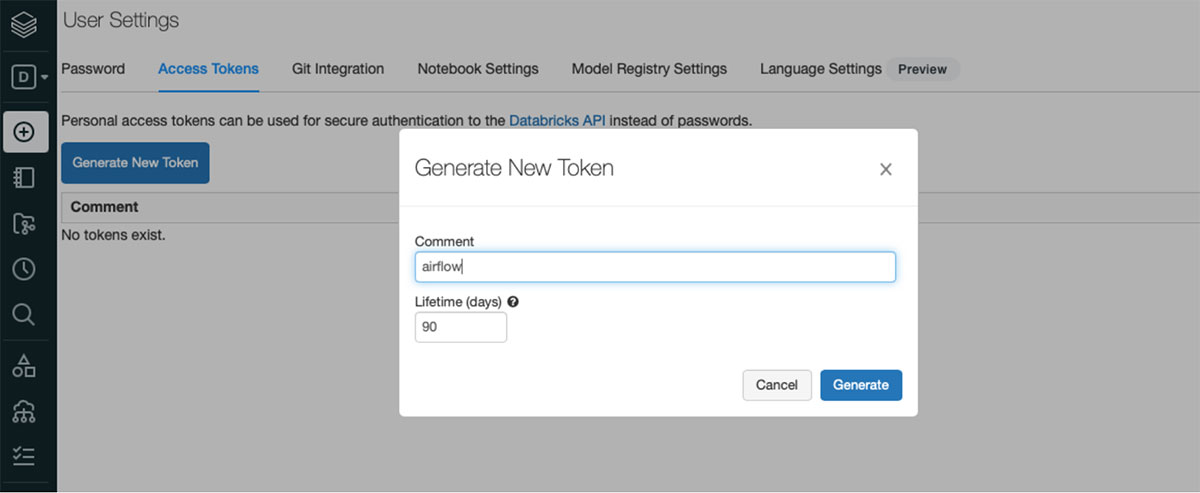
The blog assumes you have access to Databricks workspace. Sign up for a free one here and configure a Databricks cluster. Additionally, create an API token to be used to configure connection in MWAA.
To create an MWAA environment follow these instructions.
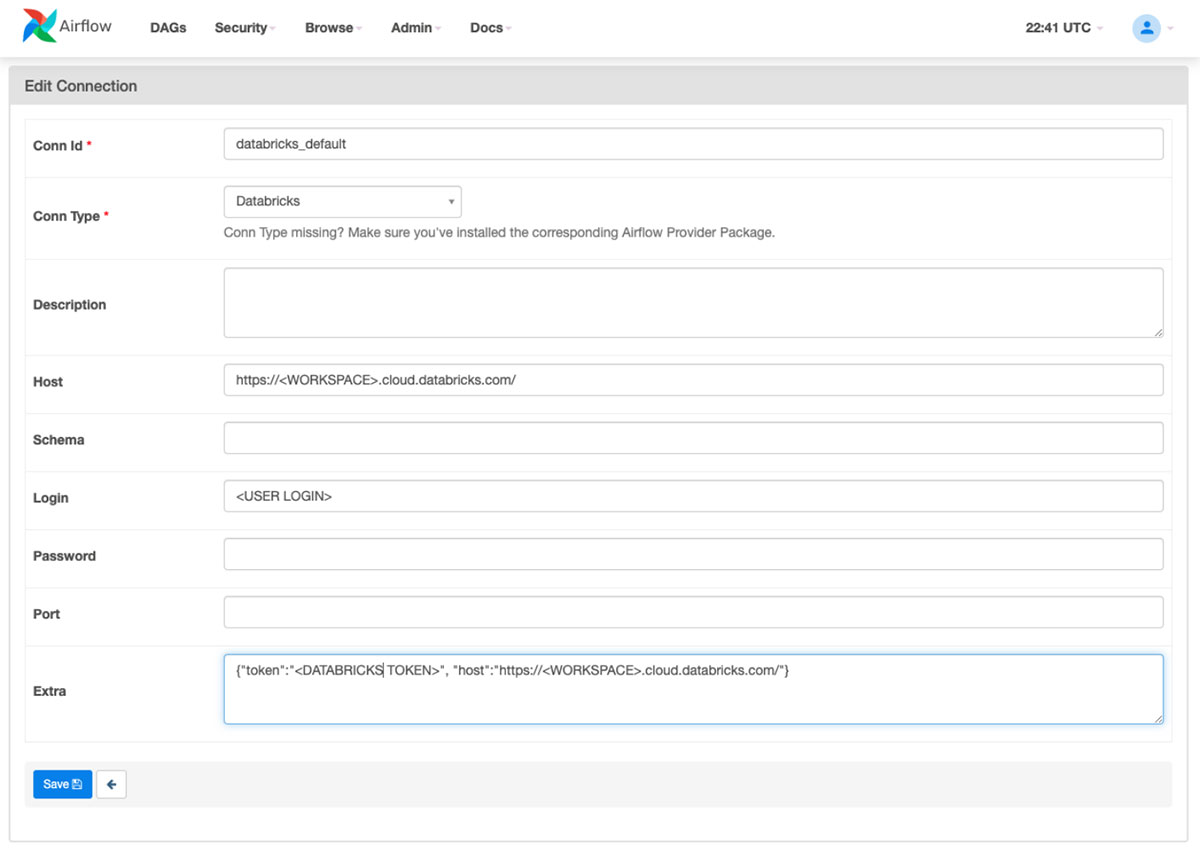
How to create a Databricks connection
The first step is to configure the Databricks connection in MWAA.
Example DAG
Next upload your DAG into the S3 bucket folder you specified when creating the MWAA environment. Your DAG will automatically appear on the MWAA UI.

Here’s an example of an Airflow DAG, which creates configuration for a new Databricks jobs cluster, Databricks notebook task, and submits the notebook task for execution in Databricks.
Get the latest version of the file from the GitHub link.
Trigger the DAG in MWAA.

Once triggered you can see the job cluster on the Databricks cluster UI page.

Troubleshooting
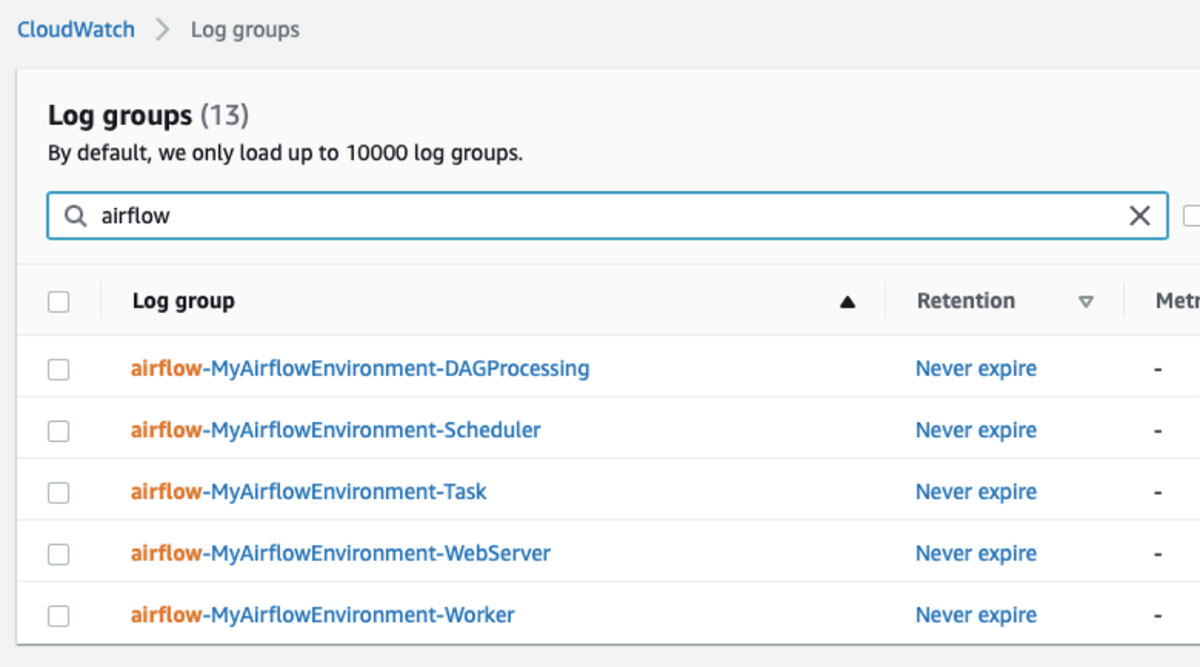
Amazon MWAA uses Amazon CloudWatch for all Airflow logs. These are helpful troubleshooting DAG failures.
CloudWatch metrics and alerts
Next, we create a metric to monitor the successful completion of the DAG. Amazon MWAA supports many metrics.

We use TaskInstanceFailures to create an alarm.
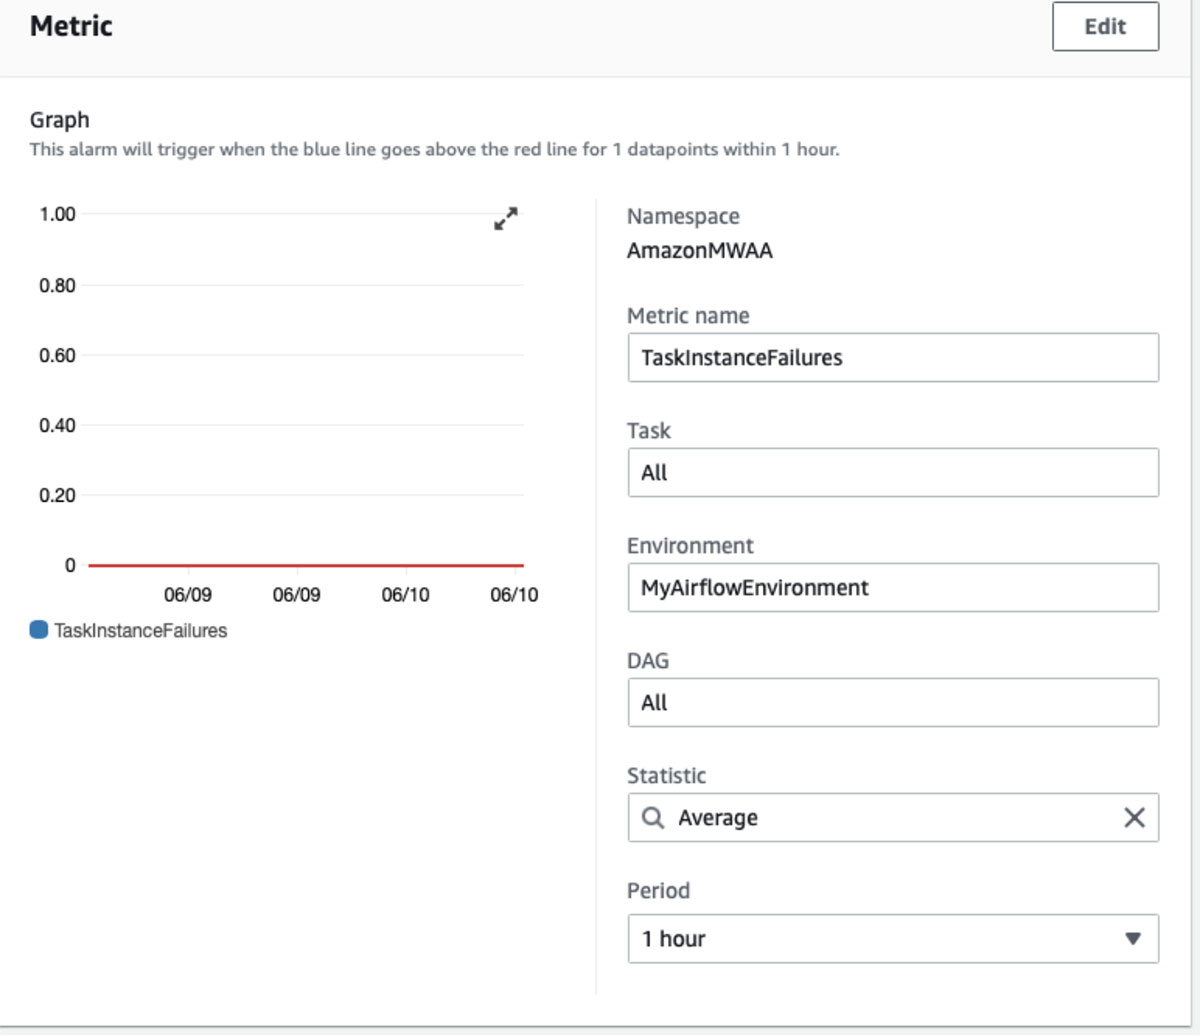
For threshold we select zero ( i.e., we want to be notified when there are any failures over a period of one hour).
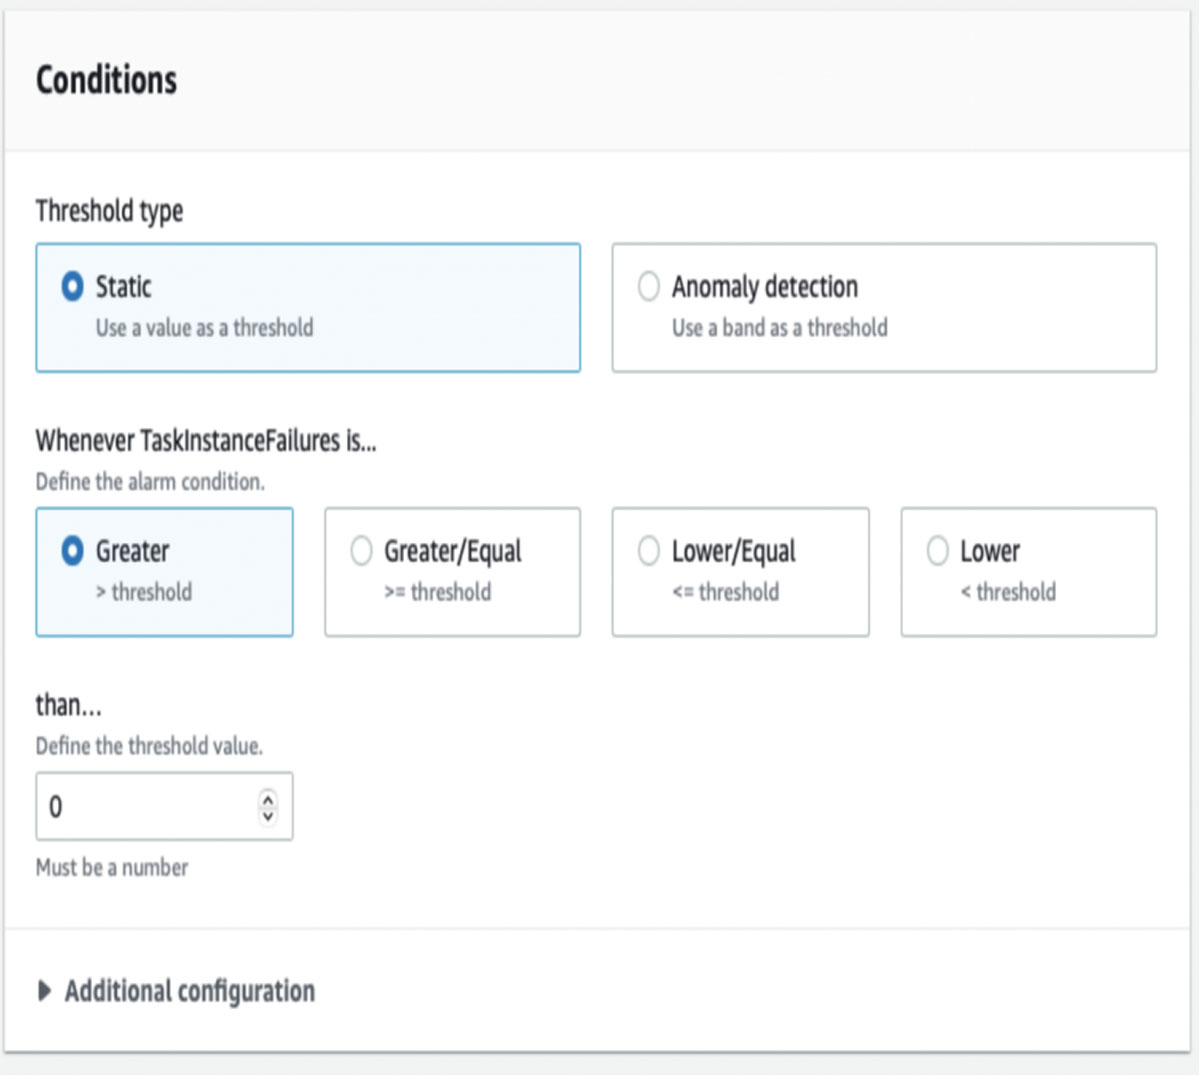
Lastly, we select an Email notification as the action.

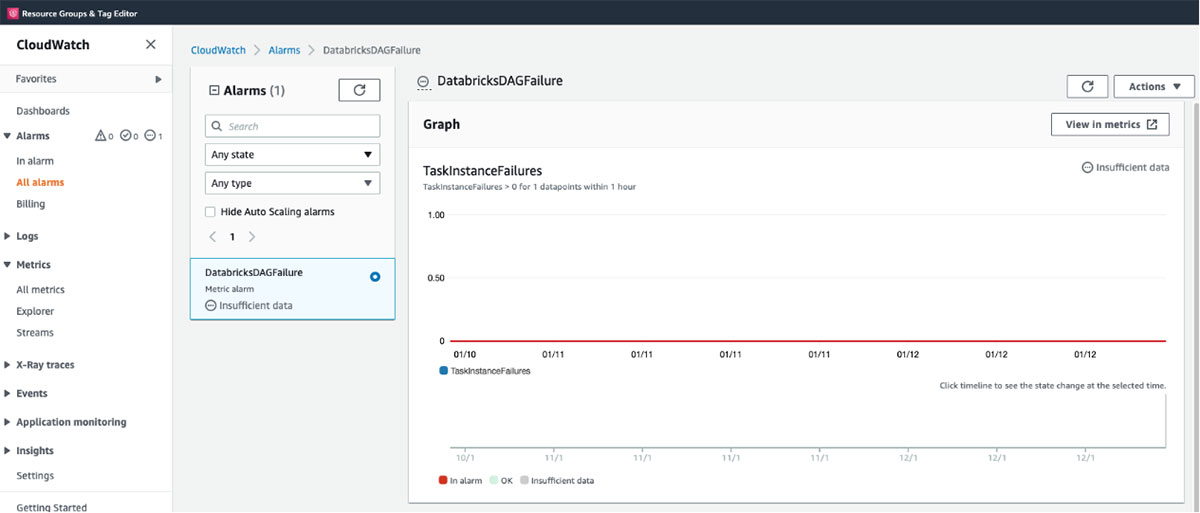
Here’s an example of the Cloudwatch Email notification generated when the DAG fails.
You are receiving this email because your Amazon CloudWatch Alarm "DatabricksDAGFailure" in the US East (N. Virginia) region has entered the ALARM state, because "Threshold Crossed
Conclusion
In this blog, we showed how to create an Airflow DAG that creates, configures, and submits a new Databricks jobs cluster, Databricks notebook task, and the notebook task for execution in Databricks. We leverage MWAA’s out-of-the-box integration with CloudWatch to monitor our example workflow and receive notifications when there are failures.
What’s next
- Start your free Databricks on AWS 14-day trial
- Try Amazon Managed Workflow for Apache Airflow (MWAA)
Code Repo
MWAA-DATABRICKS Sample DAG Code
Get the latest posts in your inbox
Subscribe to our blog and get the latest posts delivered to your inbox.