How Gemini Built a Cryptocurrency Analytics Platform Using Lakehouse for Financial Services
This blog has been co-authored by Gemini. We would like to thank the Gemini team, Anil Kovvuri and Sriram Rajappa, for their contributions.
Gemini is one of the top centralized cryptocurrency exchanges in the United States and across the globe and enables customers to trade cryptocurrency easily and safely on our platform.
Due to the vast amount of massive external real-time volumes, we had challenges with our existing data platform when facilitating internal reporting. Specifically, our data team needed to build applications to allow our end-users to understand order book data using the following metrics:
- Spread analysis for each cryptocurrency market comparing Gemini against the competition
- Cost of liquidity per crypto assets per exchange
- Market volume and capitalization for stability analytics
- Slippage and order book depth analysis
In addition to building a dashboard, the team received market data from an external data provider that would be ingested and presented in the web application, providing a rich end-user experience that allows users to refresh metrics anytime. With the sheer volume of historical and live data feeds being ingested, and the need for a scalable compute platform for backtesting and spread calculations, our team needed a performant single source of truth to build the application dashboards.
Ideation to creation
With these challenges outlined, the team defined three core technical requirements for the order book analytics platform:
- Performant data marts to support ingestion of complex data types
- Support for a highly parallelizable analytical compute engine
- Self-service analytics and integration with hosted applications
First, we evaluated native AWS services to build out the order book analytics platform. However, our internal findings suggested the data team would need to dedicate a significant number of hours toward building a framework for ingesting data and stitching AWS native analytical services to build an end-to-end platform.
Next, we evaluated the data lakehouse paradigm. The core lakehouse foundation and features resonated with the team as an efficient way to build the data platform. With Databricks’ Lakehouse Platform for Financial Services, our data team had the flexibility and ability to engineer, analyze and apply ML from one single platform to support our data initiatives.
Going back to the core technical challenges, the main pain point was data ingestion. Data is sourced from 12 major exchanges and their crypto assets on a daily basis, as well as backfilled with new crypto exchanges. Below are a few data ingestion questions we posed to ourselves:
- How do you efficiently backfill historical order books and trade data at scale that arrives into AWS S3 as a one-time archive file in tar format?
- Batch data arrives as compressed csv files, with each exchange and trade pair in separate buckets. How do you efficiently process new trading pairs or new exchanges?
- The external data provider doesn’t send any trigger/signal files, making it a challenge to know when the day’s data is pushed. How do you schedule jobs without creating external file watchers?
- Pre and post data processing is a common challenge when working with data files. But how do you handle failures and address job restarts?
- How do you make it easy to consume these data sets for a team with a mix of SQL and Python skill sets?
Solving the data ingestion problem
To solve the problem of data ingestion and backfill the historical data for the order book, the team leveraged Databricks’ Auto Loader functionality. Auto Loader is a file source that can perform incremental data loads from AWS S3 as it subscribes to file events from the input directory.
Ingesting third-party data into AWS S3
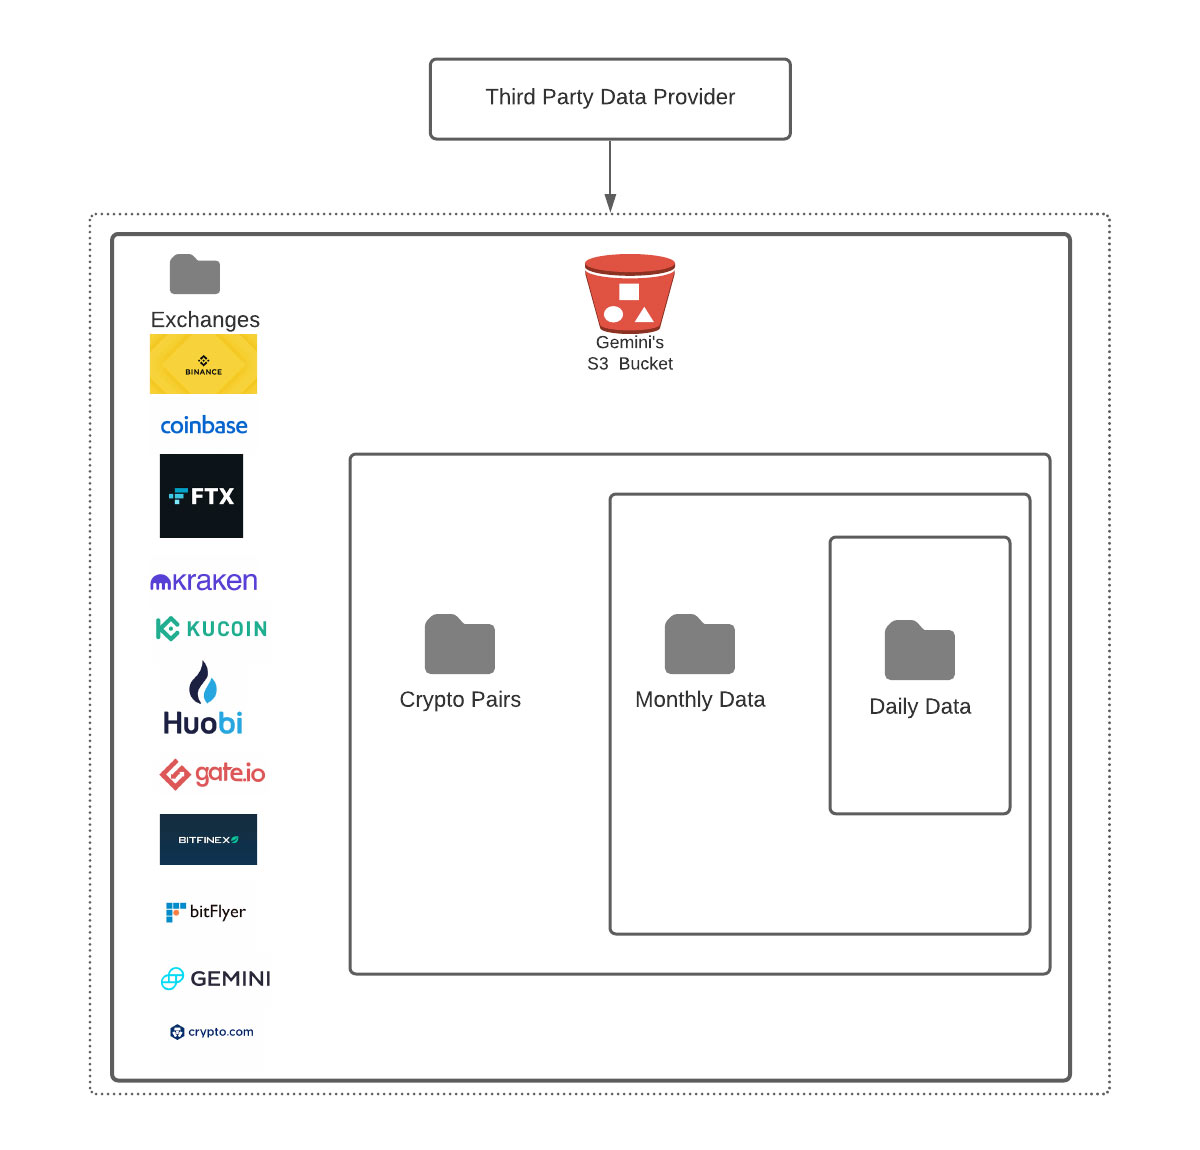
Once the data was in a readable format, another issue was the automatic processing of historical data. Challenges included listing the S3 directories since the beginning of time (2014 in this case), working with large files that were 1GB or more, and handling data volumes that were multiple terabytes per day. To scale processing,the team leveraged Auto Loader with the option to limit the number of files consumed per structured streaming trigger, as the number of files that needed to be ingested would be in the range of one hundred thousand across all the 12 major exchanges.
Apart from the historical data, Gemini receives order book data from data providers across the 12 major exchanges on a daily basis. The team leveraged Auto Loader’s ability to integrate with AWS SQS that notifies and processes new files as they arrive. This solution eliminates the need to have a time-based process (e.g. a cron job) to check for newly arrived files. As data is ingested into the Lakehouse, it is then captured in Delta format, partitioned by date and exchange type, readily available for further processing or consumption. The example below shows how data is ingested into the Lakehouse:
- Historical price movements across exchanges allows for time series analysis
- Can be used as standalone feature for numerous downstream applications
- Gives measure of predicted risk and volatility
To implement price predictions the team used order book data along with other computed metrics, for instance, market depth as the input. To determine price predictions the team leveraged Databricks’ AutoML, which provided a glassbox approach to performing distributed model experimentation at scale. The team used different deep learning architectures which included components from Convolutional Neural Networks (CNNs) that are in computer vision type of problems along more traditional LSTMs.
Market analysis using computed features
Market analysis is key for Gemini to answer questions like "what is our market share?" The team came up with different ways to compute features that would answer the business problem. Below are a couple of examples that include the problem definition:
Scenario based on weekly trade volumes:
- To calculate Gemini’s share of market, using Bitcoin as an example, would be:
(Gemini BTC traded)/(Market BTC traded)
Scenario based on assets under custody (AUC):
- Gives Gemini insight into the overall market, using Bitcoin as the example:
(Gemini BTC held)/(Market BTC held)
A simplified, collaborative data Lakehouse architecture for all users
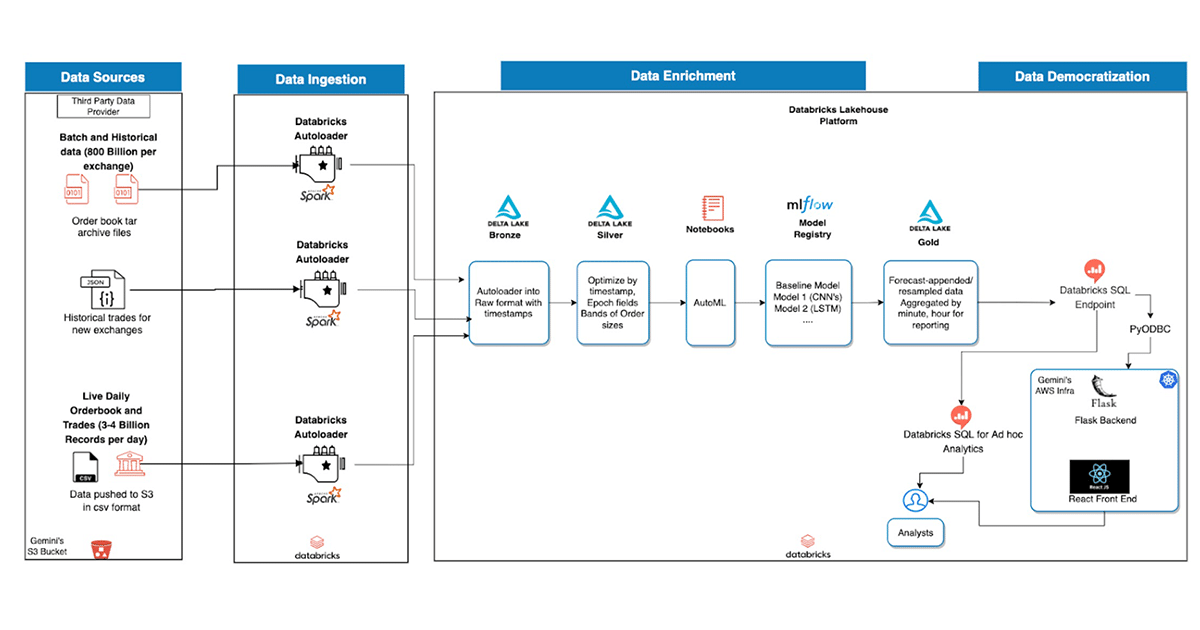
As illustrated in the below diagram, the data Lakehouse architecture enables different personas to collaborate on a single platform. This ranges from designing complex data engineering tasks to making incremental data quality updates and providing easy access to the underlying datasets using R, SQL, Python and Scala APIs for data scientists and data analysts, all on top of a Delta engine powered by Databricks. Similarly, in this case, after enriching the bronze tables that were ingested from Auto Loader, these datasets were enriched by computing additional aggregates and the above mentioned time series forecasting, and finally persisted in gold tables for reporting and ad hoc analytics.
Enabling self-service data analytics
One of the big value propositions of the data Lakehouse for the data team was to leverage the Databricks SQL capabilities to build internal applications and avoid multiple hops and copies of data. The team built an internal web application using flask, which was connected to the Databricks SQL endpoint using a pyodbc connector from Databricks. This was valuable for the team since it eliminated the need for multiple BI licenses for the analysts who could not directly query the data in the Lakehouse.
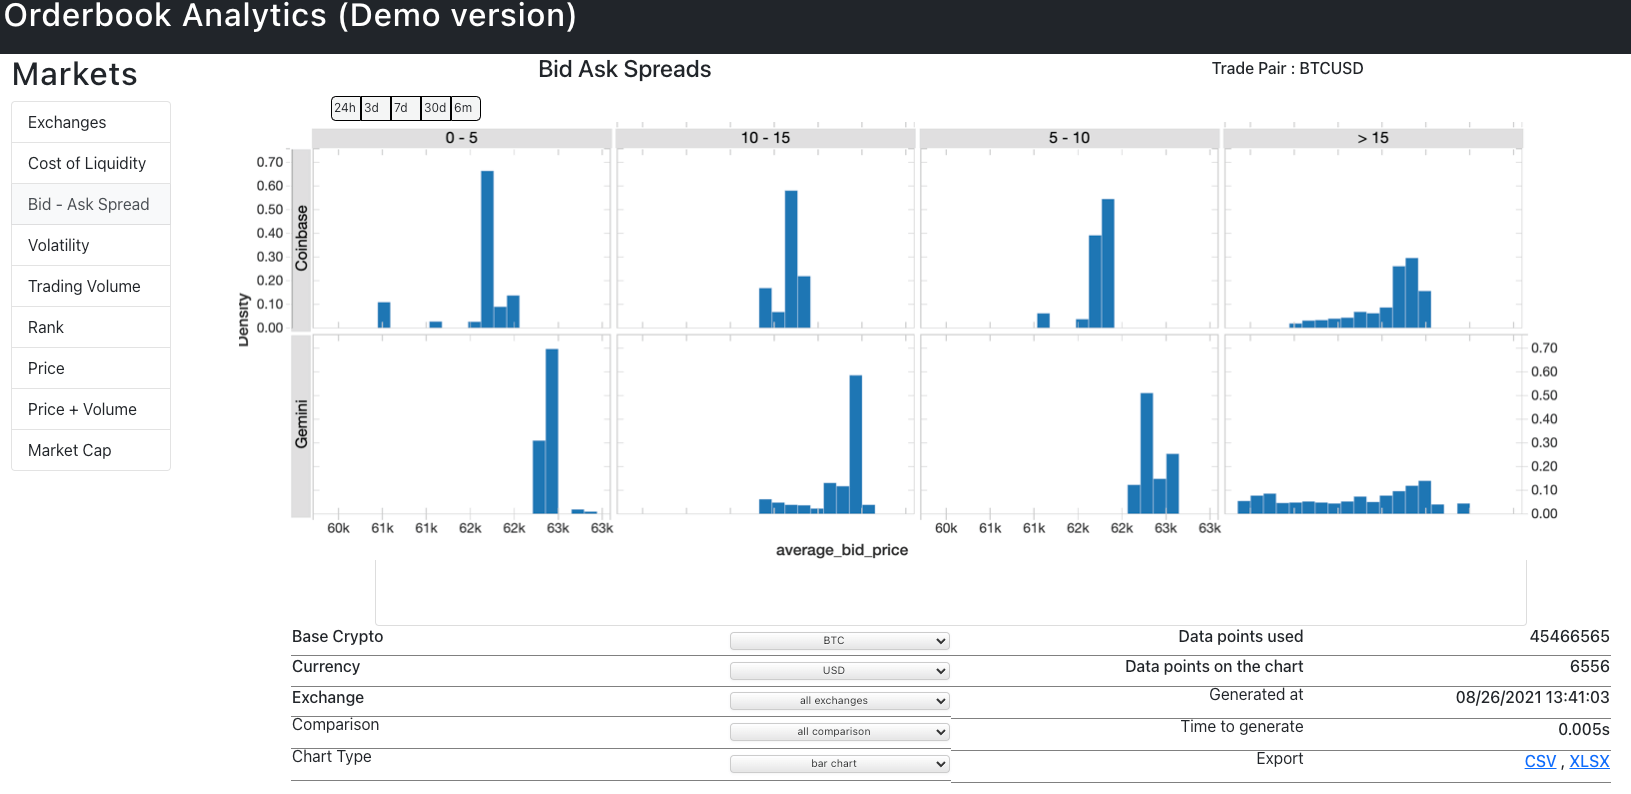
Once we had the data lakehouse implemented with Databricks, the final presentation layer was a React web application, which is customizable according to the analyst requirements and refreshed on demand. Additionally, the team leveraged the Databricks SQL inbuilt visualizations for ad hoc analytics. An example of the final data product, React Application UI, is shown below:
Final thoughts
Given the complexity of the requirements, the data team was able to leverage the Databricks Lakehouse Platform for Financial Services architecture to support critical business requirements. The team was able to use Auto Loader for ingestion of complex tick data from the third party data provider while leveraging Delta Lake features such as partitioning, auto compaction and Z-Ordering to support the multi-terabyte scale of querying in the order book analytics platform.
The built-in machine learning and AutoML capabilities meant the team was quickly able to iterate through several models to formulate a baseline model to support spread, volatility and liquidity cost analytics. Further, being able to present the key insights through Databricks SQL while also making the gold data layer available through the React Web frontend provided rich end user experience for the analysts. Finally, the data lakehouse not only improved the productivity of data engineers, analysts and AI teams, but our teams are now able to access critical business insights by querying upto 6 months of data across multiple terabytes and billions of records which only takes milliseconds due to all the built-in optimizations.
Get the latest posts in your inbox
Subscribe to our blog and get the latest posts delivered to your inbox.