Dominate Your Daily Wordle With Lakehouse
Since it launched late last year, Wordle has become a daily highlight for people around the world. So much, that the New York Times recently acquired the puzzle game to add to its growing portfolio. At Databricks, there are few things that we enjoy more than finding new, innovative ways to leverage our Lakehouse platform. So, we thought: why not use it to increase our competitive edge with Wordle?
This blog post will walk through how we executed this use case by analyzing Wordle data to identify the most frequent letters used on the platform. We made it easy for you to use our results to identify additional words that can help you with your daily Wordle!
What is Wordle?
For those unfamiliar, Wordle is a simple word-solving game that comes out daily. At a high level, you have 6 attempts to guess a 5-letter word; after submitting each guess, the player is given clues as to how many letters were guessed correctly. You can view the full instructions (and play!) here.
Our Approach
For this use case, we wanted to answer the question: What are the most optimal words to start with when playing Wordle?
For our data set, we used Wordle’s library of 5 letter words. Using the Databricks Lakehouse Platform, we were able to ingest and cleanse this library, execute two approaches for identifying “optimal” starting words, and extract insights from visualizations to identify these two words. Lakehouse was an ideal choice for this use case since it provides a unified platform that enables end-to-end analytics (data ingestion -> data analysis -> business intelligence); using the Databricks notebook environment, we were able to easily organize our analysis into a defined process.
Data Ingestion, Transformation, and Analysis Process
First, we extracted Wordle’s library of accepted 5 letter words from their website’s page source as a CSV. This library included 12,972 words ranging from “aahed” to “zymic.”
To accelerate the ingestion, transformation, and analytics of the Wordle library, we used the Databricks notebook environment, which allows us to seamlessly use multiple programming languages (SQL, Python, Scala, R), whichever the user is most comfortable with, to define a process for systematically designing and executing the analysis. By using this environment, we were able to collaboratively iterate through the process using the same notebook without having to worry about version control. This simplified the overall process of getting to the optimal starting words.
Using the Databricks notebook environment provided by the Lakehouse, we simply ingested data from a CSV file and loaded it into a Delta table named “wordle.” This raw table we refer to as our “bronze” data table, as per our medallion architecture. The bronze layer contains our raw ingestion and history data. The silver layer contains our transformed (e.g., filtered, cleansed, augmented) data. The gold layer contains the business level aggregated data, ready for insight analysis.
We identified that the ingestion required data cleansing before being able to perform analytics. For example, “false” was ingested as “FALSE” due to the format in which data was saved, limiting our ability to do character lookups (without additional logic) as “f” is equivalent to “F.” Since the Databricks notebook environment supports multiple programming languages, we used SQL to identify the data quality issues and cleanse this data. We loaded this data into a “silver” table called Wordle_Cleansed.
We then calculated the frequency of each letter across the library of words in Wordle_Cleansed and saved the results in a “gold” Delta table called Word_Count.
Additionally, we calculated the frequency of each letter at each letter position (p_1, p_2, p_3, p_4, p_5) across the library of words and saved the results in “gold” Delta tables for each position (e.g., Word_Count_p1). Finally, we analyzed Word_Count results and each position table to determine scenarios of optimal words. Now let’s dive into our findings.
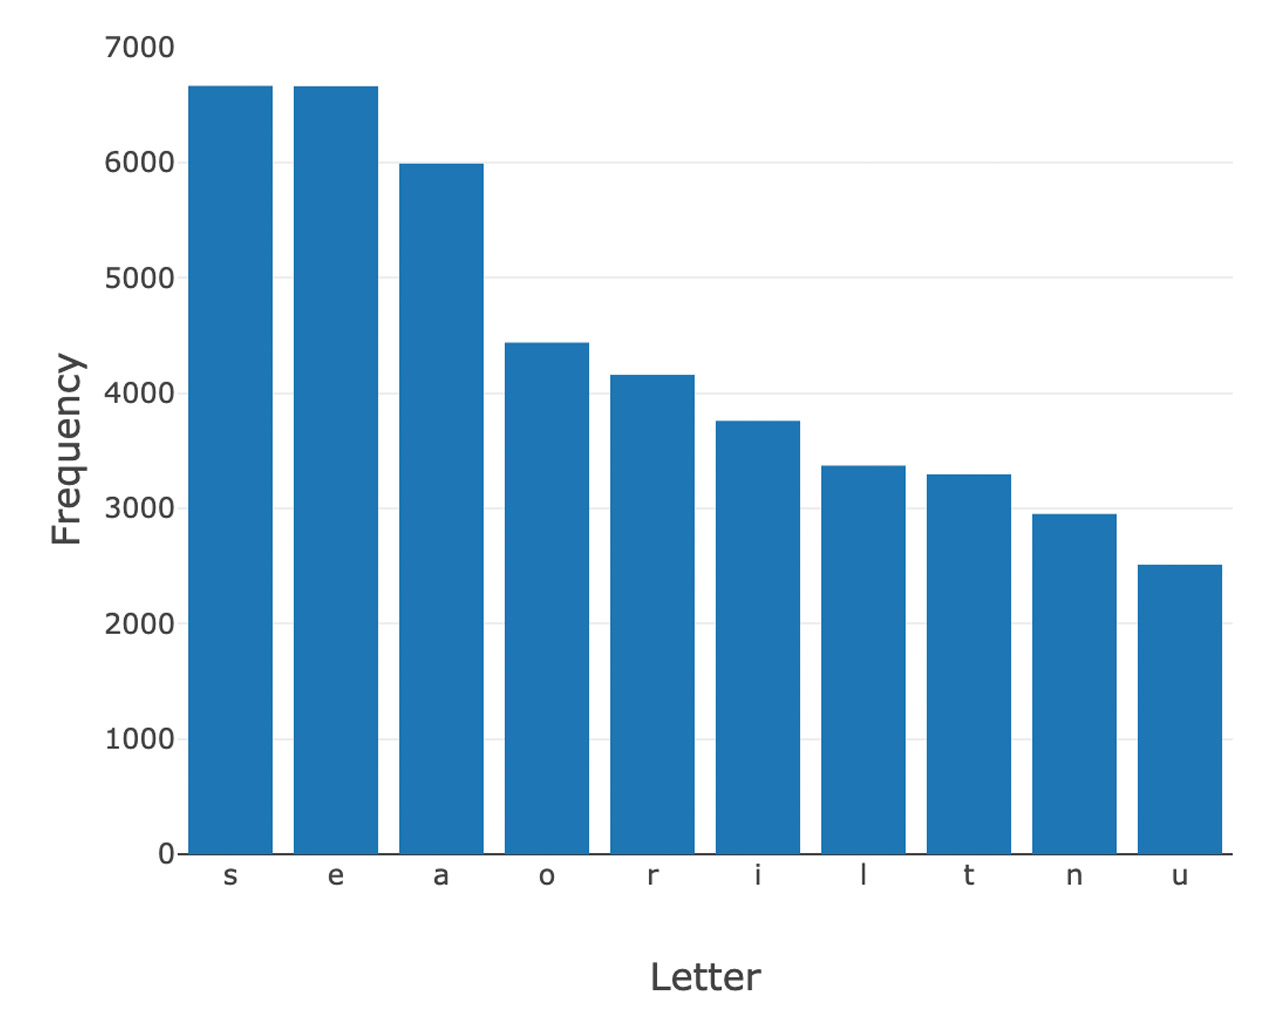
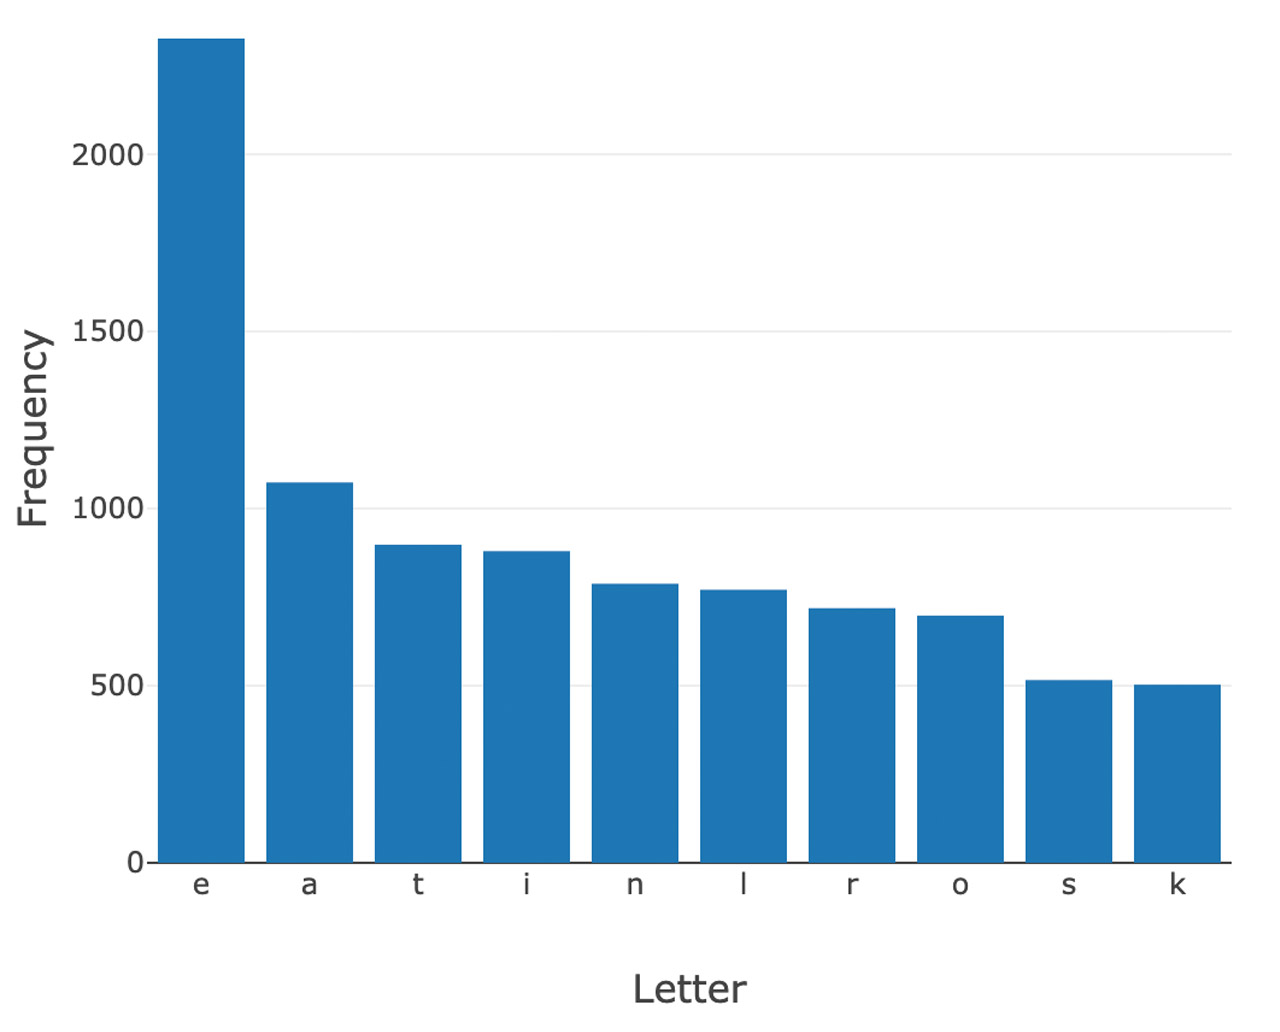
Outcome: Overall Letter Count
Below are the top 10 letters based on letter frequency in Wordle’s 5 letter accepted word library. After analyzing these letters, we determined that the optimal starting word is “soare,” or young hawk. You can also use the graph to determine other high-value words:
Top 10 Letter Frequency
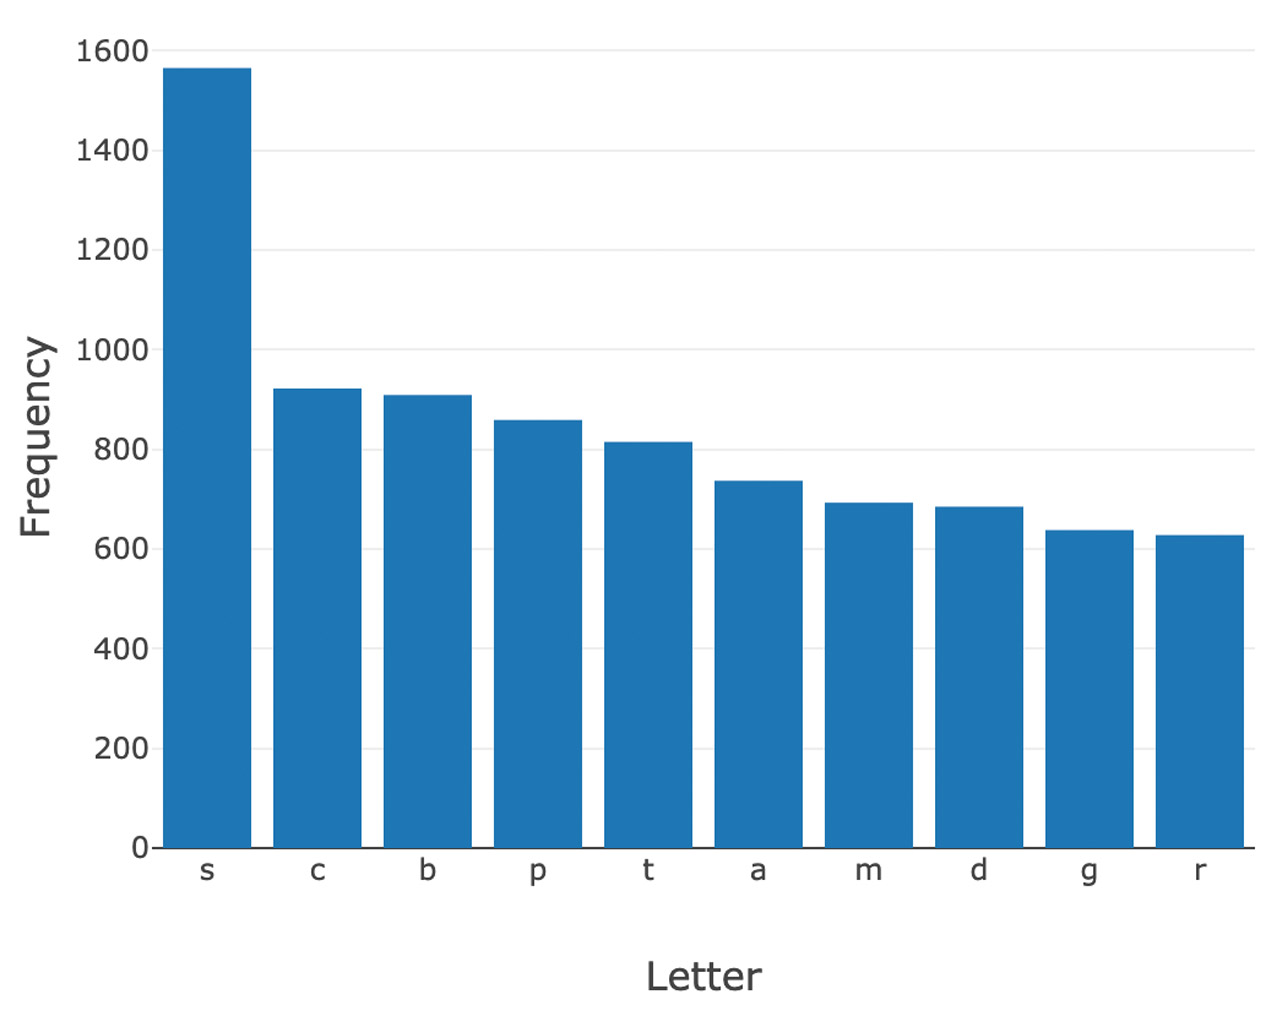
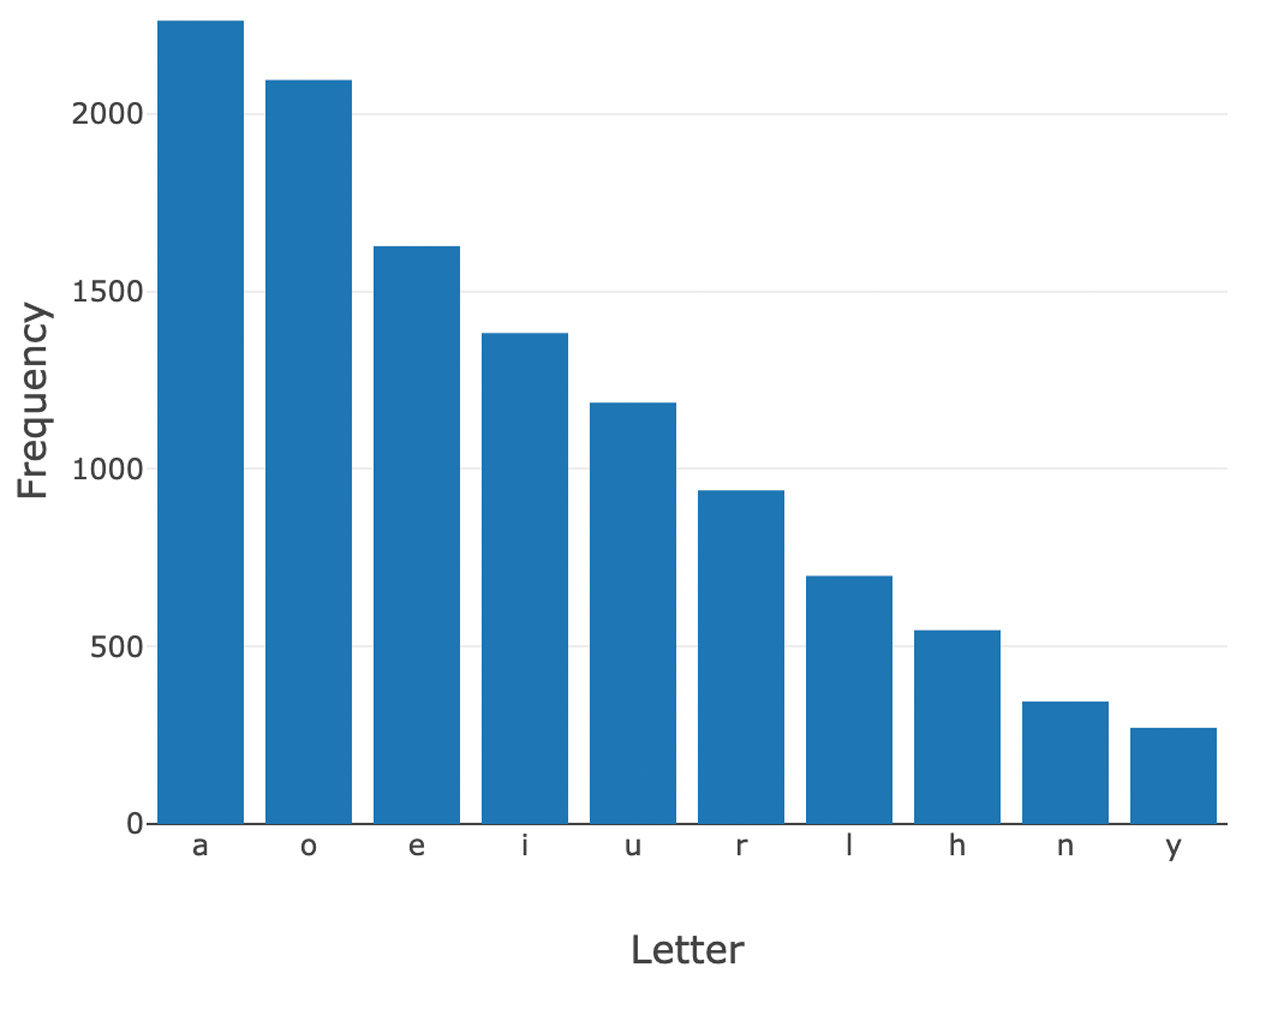
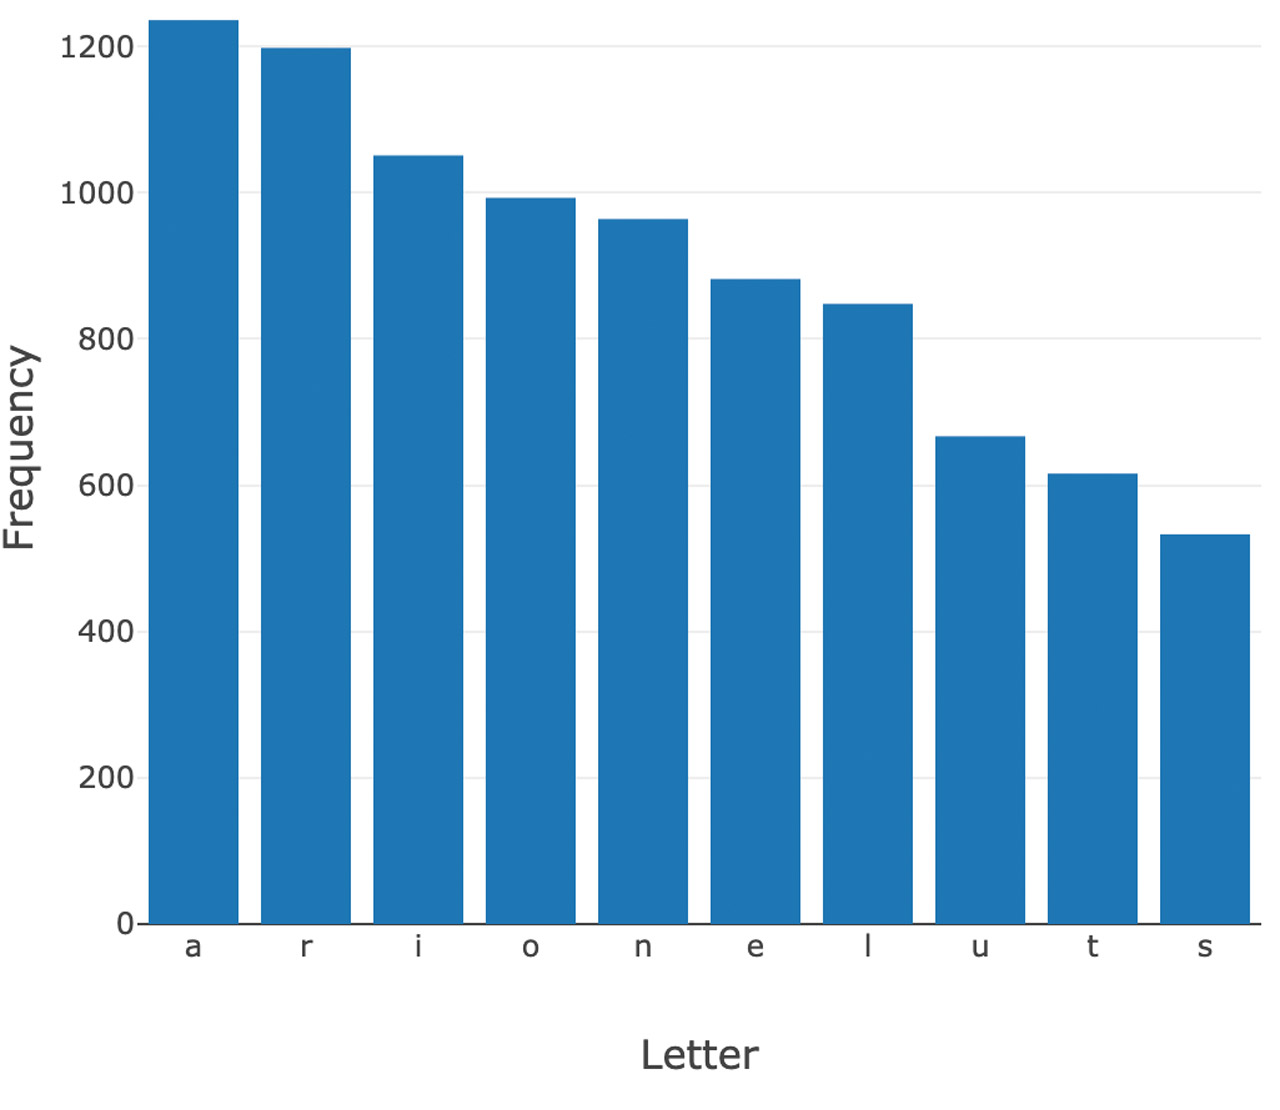
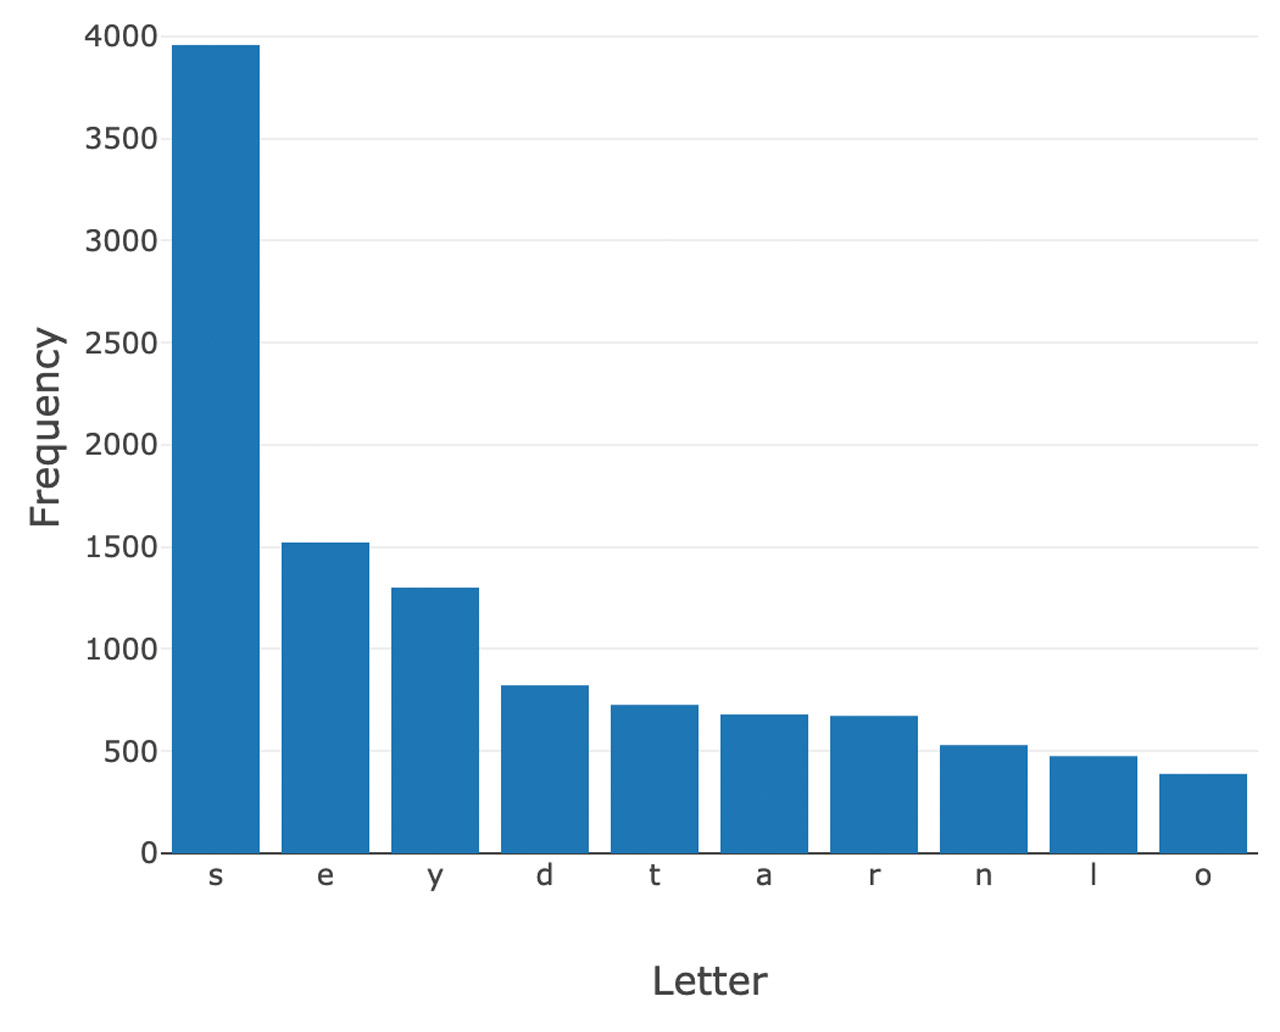
Outcome: Letter Count by Position
Below are the top letters based on letter frequency and position in Wordle’s accepted word library. After analyzing these distributions, there are a number of different options for “optimal” starting words using this approach. For example, “cares'' is a great option. “S” is the most common letter both at position 1 (P1) and at P5. Since it is twice as frequent at P5, we slot it there.
“C” is the next most frequent letter in P1, so we slot it there, giving us “C _ _ _ S.” “A” is the most frequent letter in P2 and P3, but more frequent in P2, so we slot it there. In P3, the second most frequent letter is “R”, so we now have “C A R _ S”. To finish off the word, we look at P4 where “E” is the most frequent letter. As a result, using this approach the “optimal” starting word is “cares.”
Conclusion
Of course, “optimal” is just one strategic aspect when playing Wordle - so this definitely doesn't take the “puzzle” aspect out of the game. And what’s optimal now will likely evolve over time! That’s why we encourage you to try this use case yourself.
New to Lakehouse? Check out this blog post from our co-founders for an overview of the architecture and how it can be leveraged across data teams.
Get the latest posts in your inbox
Subscribe to our blog and get the latest posts delivered to your inbox.