Stadium Analytics: Increasing Sports Fan Engagement With Data and AI
by Max Wittenberg and Declan Meaney
It only took a single slide.
In 2021, Bobby Gallo, Senior Vice president of Club Business Development at the National Football League (NFL), presented to NFL team owners a single slide with five team logos: the Cincinnati Bengals, Detroit Lions, Jacksonville Jaguars, New York Jets and the Washington Commanders. It was a list of teams with at least 15,000 unsold tickets on average for the upcoming season. Gallo implored all NFL teams to consider what they could do to improve ticket sales and fan engagement – a problem that not only plagues the NFL, but many professional sports teams around the country.
In 2007, Major League Baseball (MLB) averaged over 32,500 fans in attendance at each game. Since then, attendance declined 11% to 29,000 in 2019 and another 34% to 19,000 in 2021, during which stadiums did not operate at maximum capacity for the entire season due to COVID-19 – marking a 37-year low.
Team performance causes fluctuations in attendance and engagement as well. Entering week 8 of the 2021 NFL season, the winless Detroit Lions had just 47,000 fans at Ford Field for the game, which was the first time attendance dropped below 50,000 in 10 years. With these trends having a significant impact on revenue, it is important now more than ever for teams to improve the in-stadium experience and reverse them. The use of data for competitive advantage is long-documented in sports, but often untapped is the application of data and AI to transform the “fan experience” to boost both revenue and the customer lifecycle.
Here’s an inside look at how professional sports teams use technologies like Databricks to improve the in-stadium experience, increase fan engagement, and grow the lifetime value of a fan.
The Challenge
There used to be nothing quite like watching a game in the ballpark, stadium or arena. However, that experience did not always make for the most enjoyable outing – whether it's because of rising ticket costs of tickets, food and beer; harsh weather or agonizing wait times for restrooms. This holds true if you look regionally. For example, fans of teams based in the Midwest that play in the winter may have to endure uncomfortable seats in freezing temperatures – definitely not an ideal experience. Needless to say, sports teams face numerous challenges and are always looking for ways to improve attendance and fan engagement.
At Databricks, we've had the opportunity to work with many sports teams (check out this blog on how MLB teams use Databricks for real-time decision making) and leagues and learn what they view as the primary drivers that impact fan engagement and game attendance. Typically, teams face three obstacles that have the biggest impact on declining fan engagement:
- At-Home Experience: Fans at home can enjoy a better view of the action with more comfort and far less expense. Improvements in broadcasting and technology, like Hawkeye cameras that provide incredibly detailed instant replays and reviews, have contributed to a better understanding of the game. Consider how broadcasters leverage statistics programs to provide insights into the game that fans can’t get in the stadium – programs like the NFL’s Next Gen Stats or the NBA’s Courtoptix.
- Changing Fan Demographic: Younger generations are simply less interested in watching live sports as they have preferred options for entertainment, such as playing video games, scrolling through social media or using streaming services. These fans don’t engage with their favorite teams in the same way that their parents did, and the static in-game experience does not usually accommodate them.
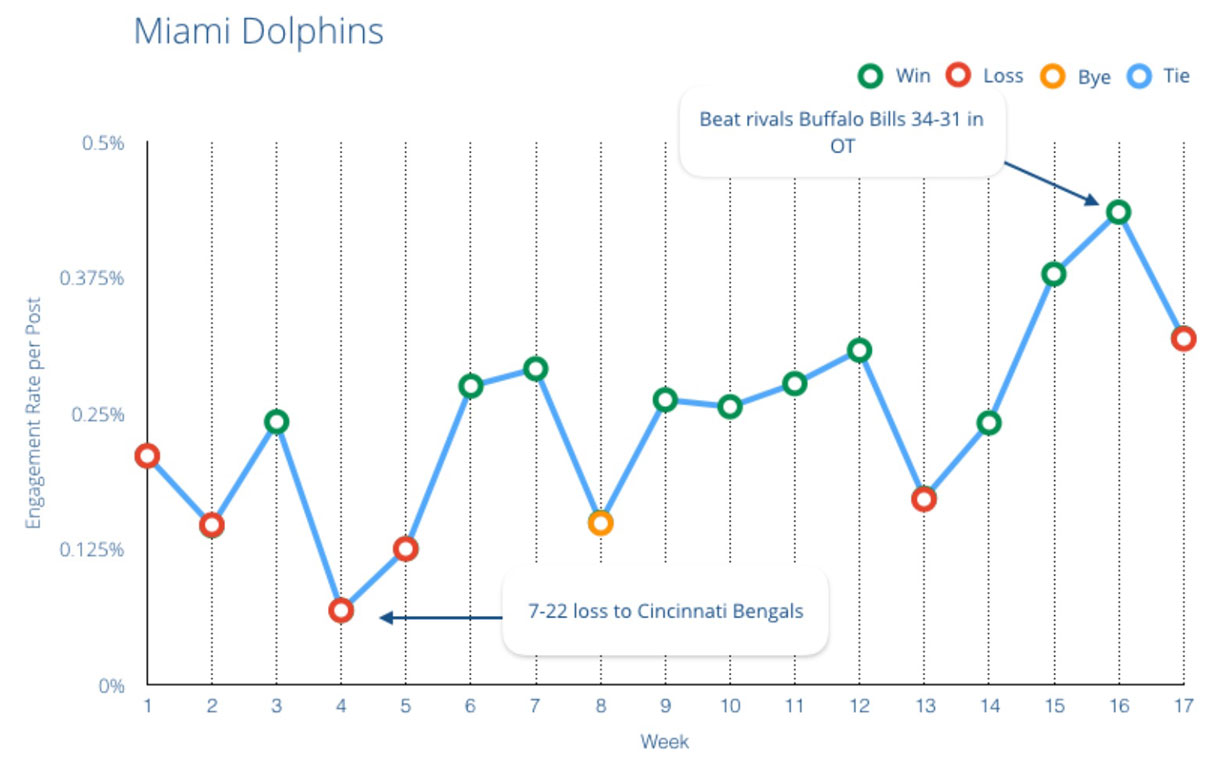
- Fair Weather Fans: Teams that have strong performance and more wins inherently have more fans at their games. Seasons in which a team decides to rebuild are not as exciting to attend. Losing teams have on average a 50% lower engagement rate on social media platforms than winning teams. The below diagram from Rival IQ showcases this correlation more.
These obstacles impact one of largest revenue streams professional sports teams have – revenue generated in stadiums from ticket sales, vendors and merchandise. Sports teams using Databricks have developed solutions to address these and other challenges. By innovating the in-stadium experience, these teams are driving the future of fan engagement at games.
Teams have access to a variety of data sources they can use to increase stadium revenue. Social media, CRM, point-of-sale and purchasing history are the most common ones available. Using a combination of these data sets and machine learning models, teams can better understand their fans and create an individualized experience for them. Let's walk through how teams use Databricks to take advantage of that data via promotional offers to fans during a game.
Getting the data
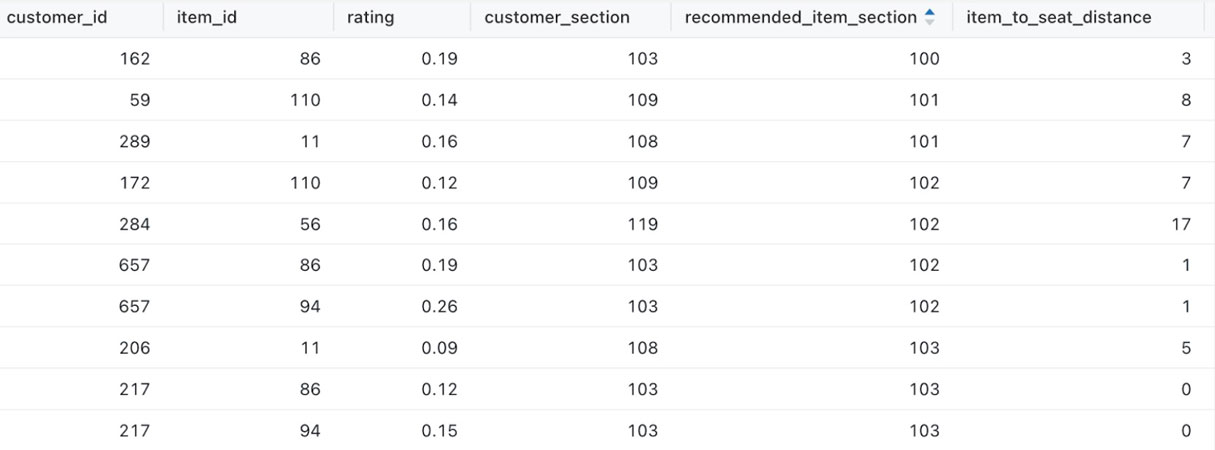
There are many points of interaction where fans create data that is valuable for teams. It all starts when a fan buys a ticket. The team receives basic information about them in a CRM or ticketing provider, such as purchase price and seat location, home and email address, and phone number. Purchases in the stadium from vendors create a buying history for each customer, and as most stadiums have moved to mobile entry and mobile purchasing only, geolocation information is also a typical data point teams are able to access as well. Here's a (fictional) example of what data is available:

One challenge with all these different data sets is how to aggregate them in one spot to use for analytics. Fortunately, Databricks has many methods of ingesting different kinds of data. The easiest way to ingest large volumes of data files is using a Databricks feature called AutoLoader, which scans data files in the location they are saved in cloud storage, and loads that data into Databricks, where data teams can transform it for analytics. AutoLoader is easy to use and incredibly reliable when scaling to ingest larger volumes of data in batch and real-time scenarios. In other words, AutoLoader works just as well for small and large data sizes in batch and real-time use cases. The Python code below shows how to use AutoLoader for ingesting data from cloud storage.
Often we see situations in which several datasets need to be joined to get a full picture of a transaction. Point-of-sale (POS) data, for example, might only contain an item number, price and time when the item was purchased and not include a description of what the item was or who purchased it.
Using multi-language support in Databricks, we can switch between different programming languages like SQL and Python to ingest and join data sets together. The SQL example below joins sales transactions in a point-of-sale system (which teams typically receive as data files in cloud storage) to a customer information data set (typically in a SQL database). This joined data set allows teams to see all the purchases each customer has made. As this data is loaded and joined, we save it to a permanent table to work with it further. The SQL example below shows how to do this:
This permanent table is saved as a Delta Lake table. Delta Lake is an open format storage layer that brings reliability, security and performance to a data lake for both streaming and batch processing and is the foundation of a cost-effective, highly scalable data platform. Data teams use Delta to version their data and enforce specific needs to run their analytics while organizing it in a friendly, structured format.
With all of the above technologies, data teams can now use this rich data set to create a personalized experience for their fans and drive better engagement.
Recommendation models
Models that predict what customers are most likely to be interested in or purchase are used on every website and targeted advertising platform imaginable. One of the biggest examples is Netflix, whose user interface is almost entirely driven by recommendation models that suggest shows or movies to customers. These predictive models look at the viewing behavior of customers and demographic information to create an individualized experience with the goal that a customer will purchase or watch something else.
This same approach can be taken with stadium analytics use cases that leverage purchasing history and demographics data to predict which items a fan is most likely to buy. Instead of creating generic models, however, we can scale the number of models to create using Apache Spark, and distribute the training across a cluster to create a unique recommendation model for each fan and build these with optimal performance.
For our use case, we can use point-of-sale data to determine what fans have previously purchased at the stadium, and combined with demographic data, create a list of recommended items to purchase for each fan. The code below uses an algorithm called ALS to predict, which items available for purchase a fan is most likely to buy. It also leverages MLflow, an open source machine learning framework, to save the results of the model for visibility into its performance.
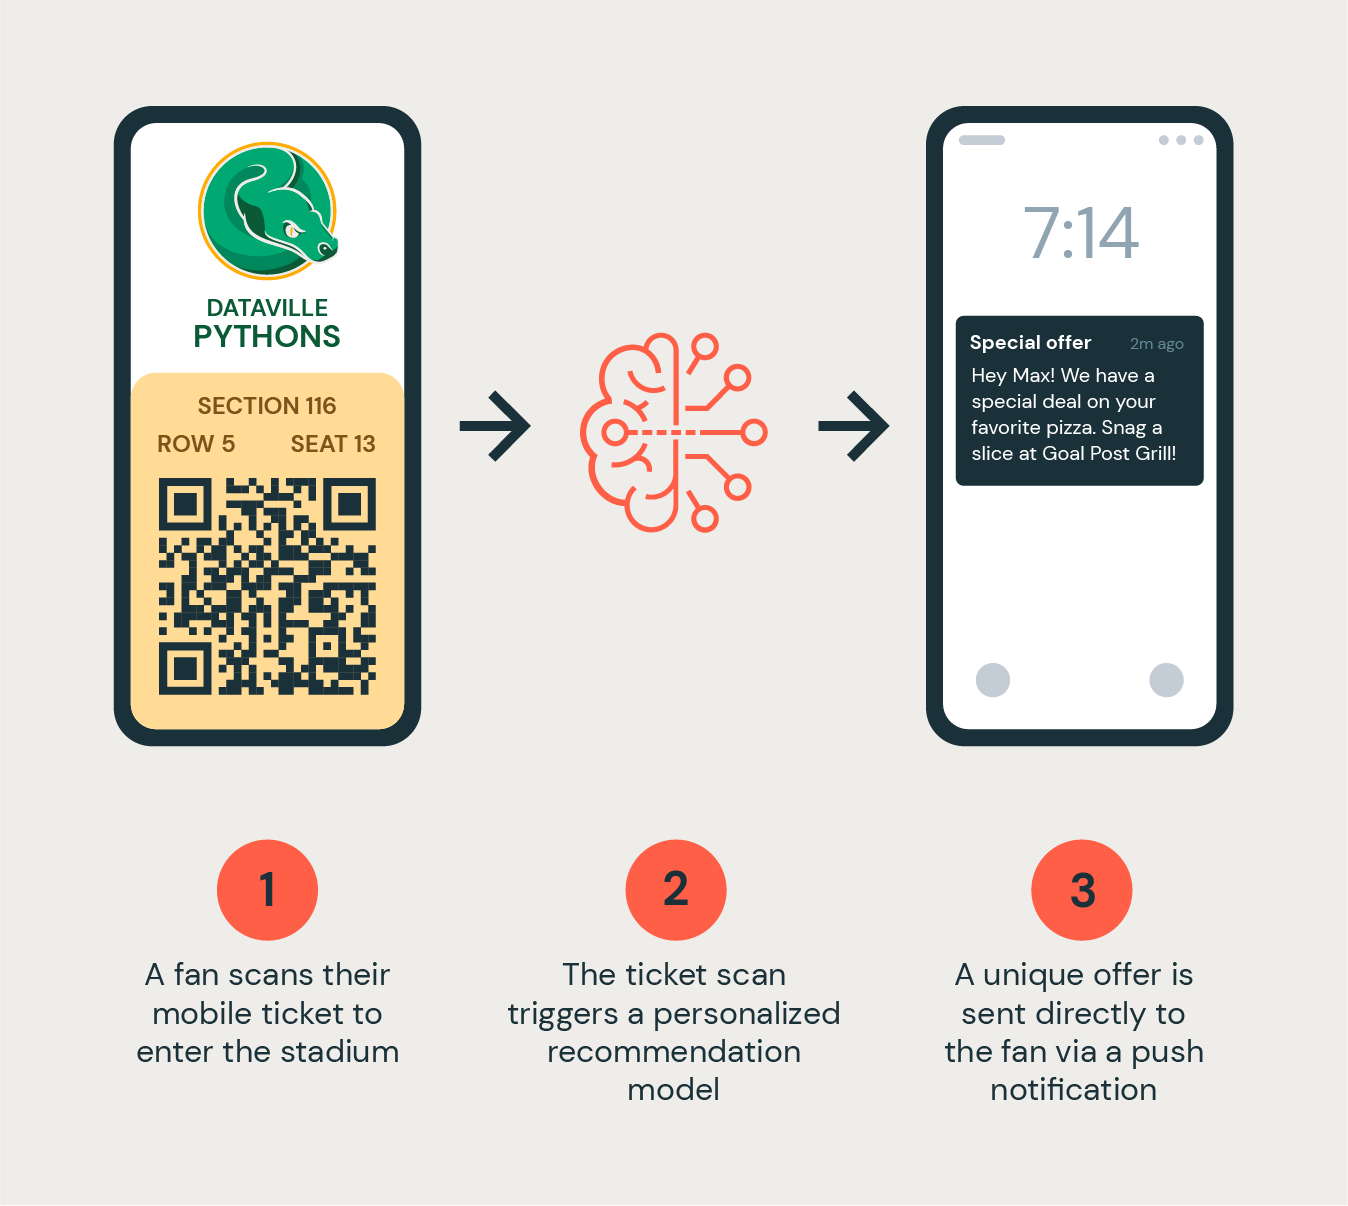
The model returns a list of recommended items for each fan that is filtered using the section/seat number on a fan’s ticket to suggest a recommended item that is in the closest proximity to where they are sitting.

Here's an example of the available data to use in this recommender model:
Finally, using the customer’s phone number from the CRM system, we can send a push notification to the fan offering a promotional discount for the top-recommended item.
Accelerating use case development with Databricks assets
Though the scope of this use case is for fan engagement attending a live sporting event, this same framework can easily be applied to other scenarios involving high volumes of customer data and mobile devices. Casinos, cruise ships, and retail stores can all drive higher engagement with customers and increase their lifetime value using personalized recommendation models. Ask about our Stadium Analytics Solution Accelerator Notebook, which provides data teams with all the resources they need to quickly create use cases like the ones described in this blog.
Get the latest posts in your inbox
Subscribe to our blog and get the latest posts delivered to your inbox.