Monitoring Your Databricks Lakehouse Platform with Audit Logs
Learn how to get complete visibility into critical events relating to your Databricks Lakehouse Platform
by Andrew Weaver and Silvio Fiorito
This blog is part two of our Admin Essentials series, where we'll focus on topics that are important to those managing and maintaining Databricks environments. In this series we'll share best practices for topics like workspace management, data governance, ops & automation and cost tracking & chargeback - keep an eye out for more blogs soon!
The Databricks Lakehouse Platform has come a long way since we last blogged about audit logging back in June 2020. We've set world records, acquired companies, and launched new products that bring the benefits of a lakehouse architecture to whole new audiences like data analysts and citizen data scientists. The world has changed significantly too. Many of us have been working remotely for the majority of that time, and remote working puts increased pressure on acceptable use policies and how we measure that they're being followed.
As such, we thought that now would be a good time to revisit the topic of audit logging for your Databricks Lakehouse Platform. In this blog, we'll bring our best practice recommendations up-to-date with the latest features available - allowing you to move the dial from retrospective analysis to proactive monitoring and alerting - for all of the important events happening on your lakehouse:
Account Level Audit Logging
Centralized Governance with Unity Catalog
Easy & Reliable Audit Log Processing with Delta Live Tables
Easy Querying with Databricks SQL
Easy Visualization with Databricks SQL
Automatic Alerting with Databricks SQL
Trust but Verify with 360 visibility into your Lakehouse
Best Practices Roundup
Conclusion
Account level audit logging
Audit logs are vitally important for a number of reasons - from compliance to cost control. They are your authoritative record of what's happening in your lakehouse. But in the past, platform administrators had to configure audit logging individually for each workspace, leading to increased overhead and the risk of organizational blindspots due to workspaces being created that weren't audit log enabled.
Now customers can leverage a single Databricks account to manage all of their users, groups, workspaces and you guessed it - audit logs - centrally from one place. This makes life far simpler for platform administrators, and carries much less risk from a security perspective. Once customers have configured audit logging at the account level, they can sleep soundly in the knowledge that we will continue to deliver a low latency stream of all of the important events happening on their lakehouse - for all new and existing workspaces created under that account.
Check out the docs (AWS, GCP) to set up account level audit logs for your Databricks Lakehouse Platform now.
Centralized Governance with Unity Catalog
Unity Catalog (UC) is the world's first fine-grained and centralized governance layer for all of your data and AI products across clouds. Combining a centralized governance layer with comprehensive audit logs allows you to answer questions like:
- What are the most popular data assets across my organization?
- Who is trying to gain unauthorized access to my data products, and what queries are they trying to run?
- Are my Delta Shares being restricted to only trusted networks?
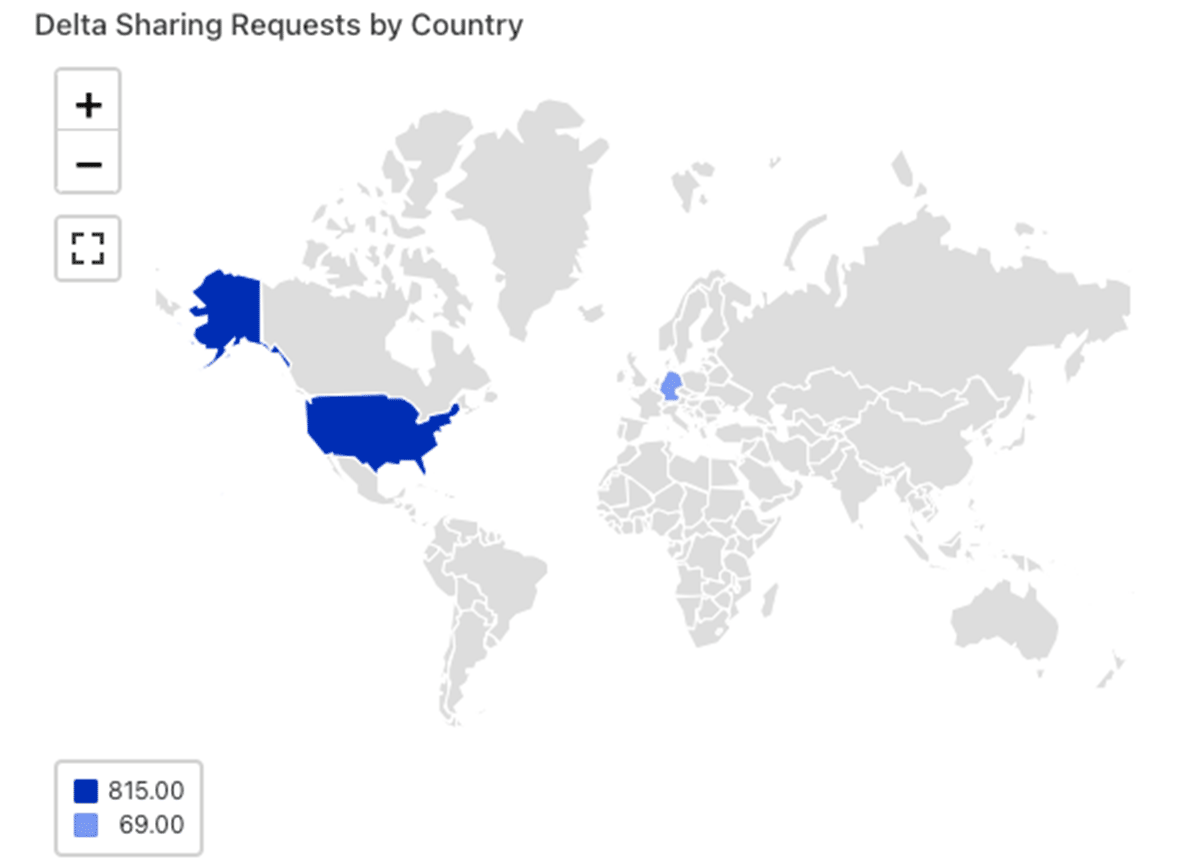
- Which countries are my Delta Shares being accessed from?
- Which US states are my Delta Shares being accessed from?
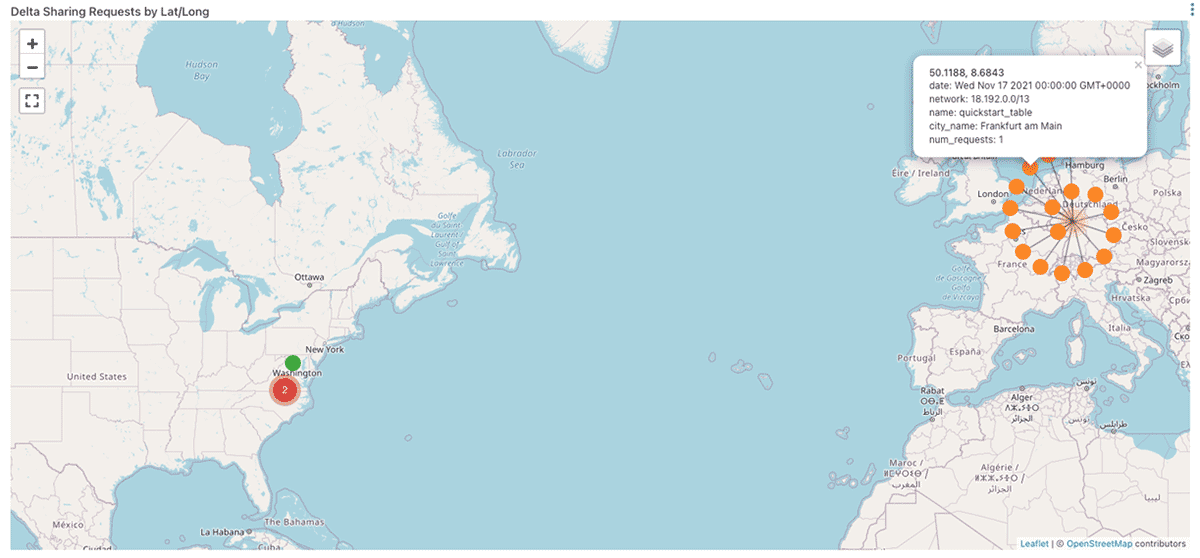
- Which locations are my Delta Shares being accessed from?
Customers who are already on the preview for UC can see what this looks like by searching the audit logs for events WHERE serviceName == "unityCatalog", or by checking out the example queries in the repo provided. If you're looking for these kinds of capabilities for your lakehouse please sign up here!
Easy & reliable audit log processing with Delta Live Tables
One hallmark of successful customers that we have seen over and over is that those who focus on data quality as a first priority grow their lakehouse faster than those that do not. Historically this has been easier said than done. Engineers who already have to spend too much time worrying about things like sizing, managing and scaling infrastructure now need to find the time to integrate their code with open source or third party data quality and testing frameworks. And what's more, these frameworks often struggle to scale to huge volumes of data, making them useful for discrete integration tests, but leaving the engineers with another headache when they want to validate the results of a representative-scale performance test.
Enter Delta Live Tables (DLT). With DLT, engineers are able to treat their data as code and leverage built-in data quality controls, so that the time and energy they would otherwise have to spend on the aforementioned tasks can instead be redirected towards more productive activities - such as ensuring that bad quality data never makes its way near the critical decision making processes of the business.
And because the ETL pipelines that process audit logging will benefit greatly from the reliability, scalability and built-in data quality controls that DLT provides, we've taken the ETL pipeline shared as part of our previous blog and converted it to DLT.
This DLT pipeline reads in the JSON files comprising your audit logs using Autoloader, a simple and effortlessly scalable solution for ingesting data into your lakehouse (see the docs for AWS, Azure, GCP). It then creates a bronze and silver table each for account and workspace level actions, transforming the data and making it easier to use at every step. Finally, it creates a gold table for every Databricks service (see the docs for AWS, Azure, GCP)
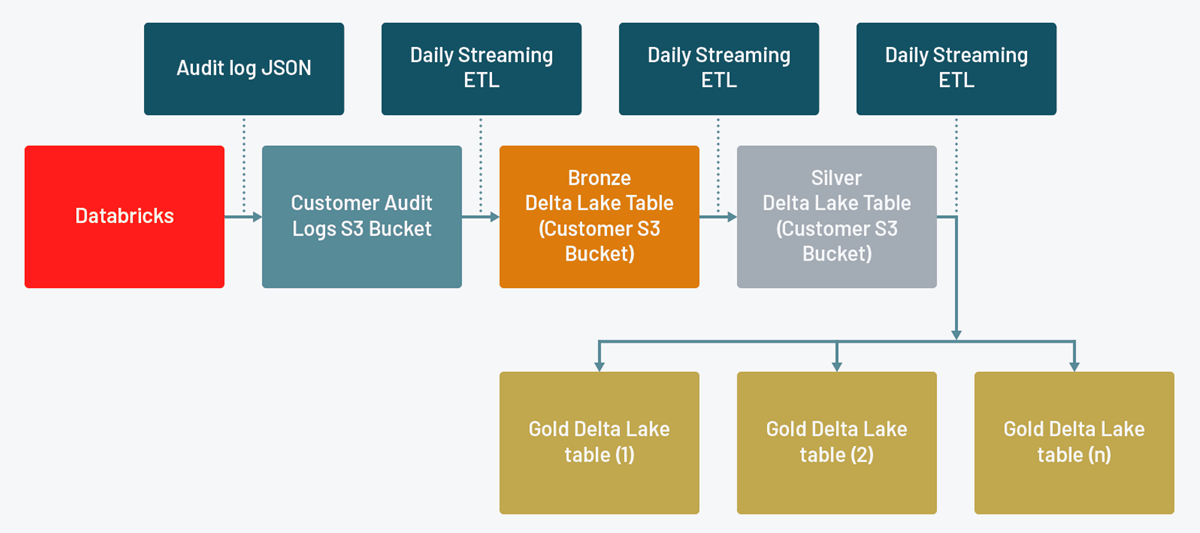
The silver table allows you to perform detailed analysis across all Databricks services, for scenarios like investigating a specific user's actions across the entire Databricks Lakehouse Platform. The gold tables meanwhile allow you to perform faster queries relating to particular services. This is particularly useful when you want to configure alerts relating to specific actions.
The examples below will work out of the box for customers on AWS and GCP. For Azure Databricks customers who have set up their diagnostic logs to be delivered to an Azure storage account, minor tweaks may be required. The reason for this is that the diagnostic log schema on Azure is slightly different to that on AWS and GCP.
To get the new DLT pipeline running on your environment, please use the following steps:
- Clone the Github Repo using the repos for Git Integration (see the docs for AWS, Azure, GCP).
- Create a new DLT pipeline, linking to the dlt_audit_logs.py notebook (see the docs for AWS, Azure, GCP). You'll need to enter the following configuration options:
a. INPUT_PATH: The cloud storage path that you've configured for audit log delivery. This will usually be a protected storage account which isn't exposed to your Databricks users.
b. OUTPUT_PATH: The cloud storage path you want to use for your audit log Delta Lakes. This will usually be a protected storage account which isn't exposed to your Databricks users.
c. CONFIG_FILE: The path to the audit_logs.json file once checked out in your repo. - Note: once you've edited the settings that are configurable via the UI, you'll need to edit the JSON so that you can add the configuration needed to authenticate with your INPUT_PATH and OUTPUT_PATH to the clusters object:
a. For AWS add the instance_profile_arn to the aws_attributes object.
b. For Azure add the Service Principal secrets to the spark_conf object.
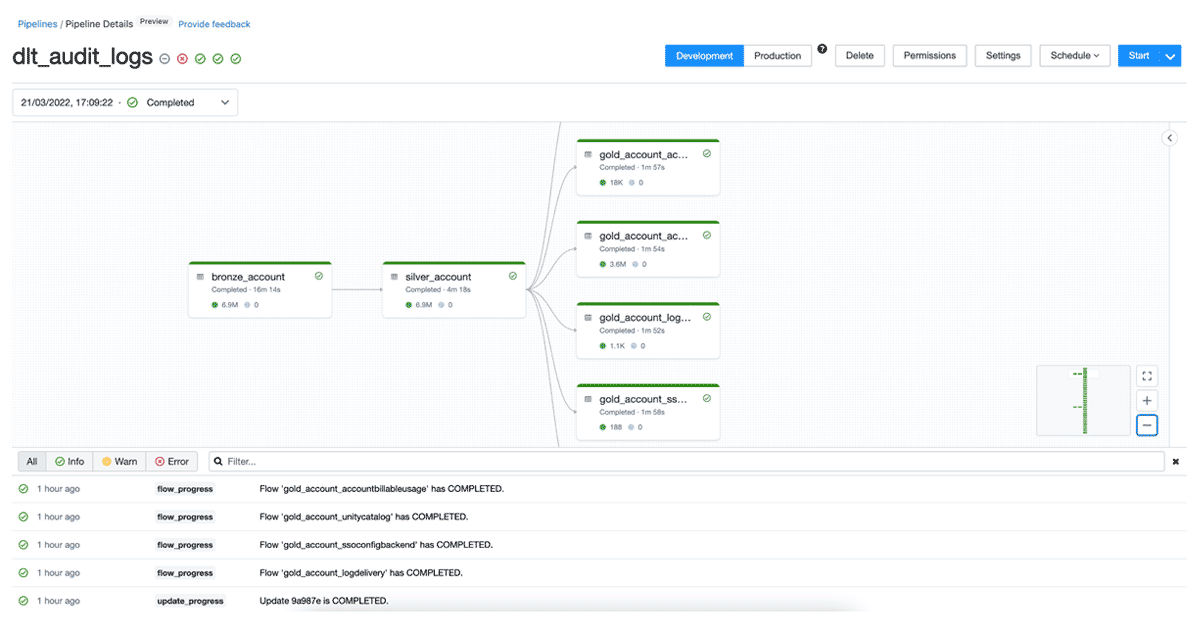
c. For GCP add the google_service_account to the gcp_attributes object. - Now you should be ready to configure your pipeline to run based on the appropriate schedule and trigger. Once it's ran successfully, you should see something like this:
There are a few things you should be aware of:
- The pipeline processes data based on a configurable list of log levels and service names based on the CONFIG_FILE referenced above.
- By default, the log levels are ACCOUNT_LEVEL and WORKSPACE_LEVEL. Right now these are the only audit levels that we use at Databricks, but there's no guarantee that we won't add additional log levels in the future. It's worth checking the audit log schema periodically to ensure that you aren't missing any logs because new audit levels have been added (see the docs for AWS, Azure, GCP).
- The serviceNames are likely to change as we add new features and therefore services to the platform. They could also vary depending on whether you leverage features like PCI-DSS compliance controls or Enhanced Security Mode. You can periodically check the list of service names on our public docs (AWS, Azure, GCP) but because the likelihood of this is greater, we've also added a detection mode into the DLT pipeline to make you aware if new services are introduced into the logs you aren't expecting and therefore ingesting into your lakehouse. Read on for more information about how we use expectations in Delta Live Tables to detect potential data quality issues like this.
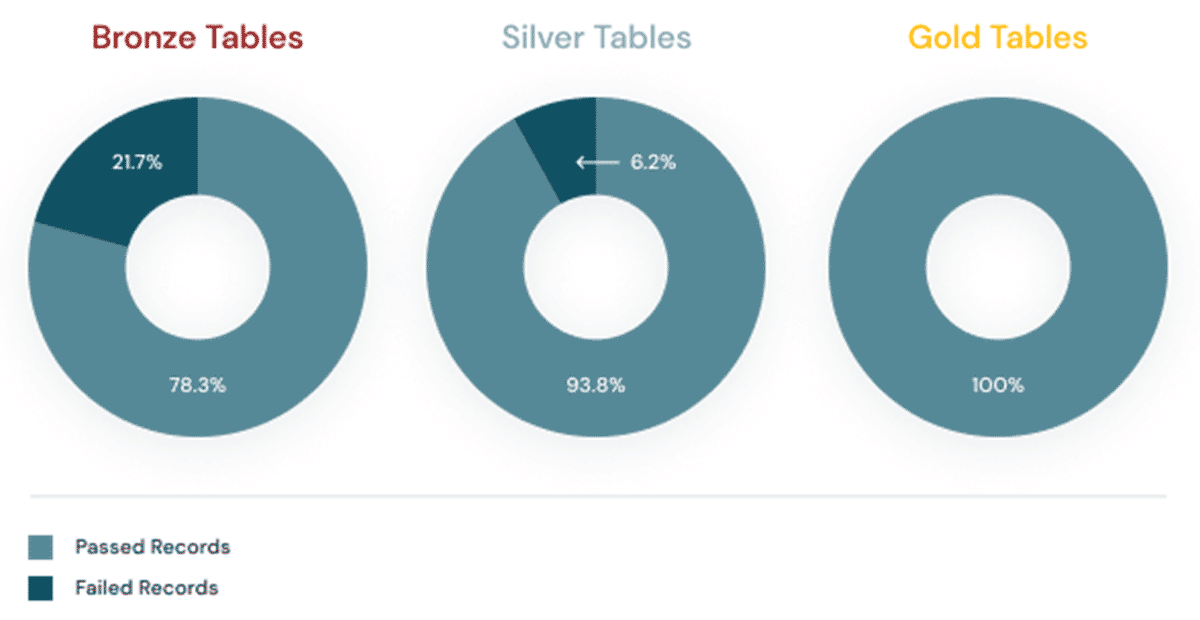
Expectations prevent bad data from flowing into tables through validation and integrity checks and avoid data quality errors with predefined error policies (fail, drop, alert or quarantine data).
In the dlt_audit_logs.py notebook you'll notice that we include the following decorator for each table:
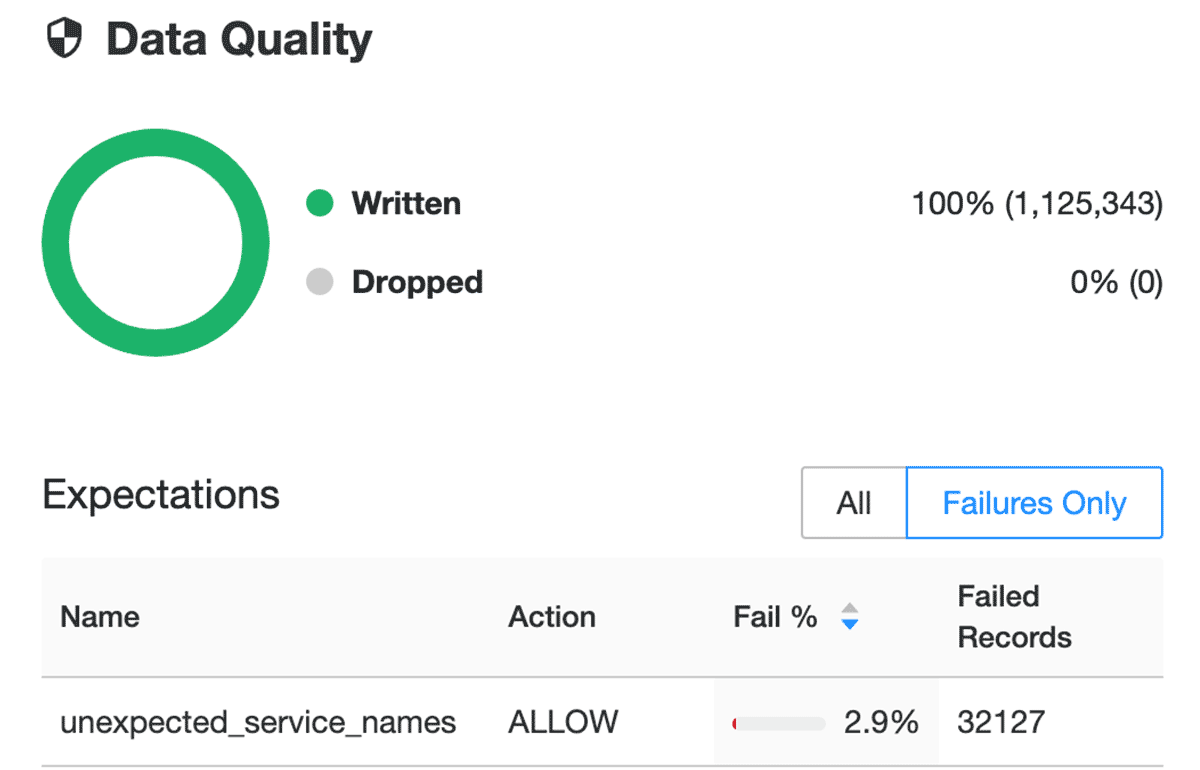
This is how we set data expectations for our Delta Live Tables. You'll also notice that for the bronze table we're setting an expectation called unexpected_service_names in which we're comparing the incoming values contained within the serviceName column to our configurable list. If new serviceNames are detected in the data that we aren't tracking here, we'll be able to see this expectation fail and know that we may need to add new or untracked serviceNames to our configuration:
To find out more about expectations, check out our documentation for AWS, Azure and GCP.
At Databricks we believe that Delta Live Tables are the future of ETL. If you've liked what you've seen and want to find out more, check out our Getting Started Guide!
Easy querying with Databricks SQL
Now that you've curated your audit logs into bronze, silver and gold tables, Databricks SQL lets you query them with awesome price-performance. If you navigate to the Data Explorer (see the docs for AWS, Azure) you'll find the bronze, silver and gold tables in the target database you specified within the DLT configuration above.
Potential use cases here might be anything from ad-hoc investigations into potential misuse, to finding out who's creating the huge GPU clusters that are coming out of your budget.
In order to get you started, we've provided a series of example account and workspace level SQL queries covering services and scenarios you might especially care about. You'll find these checked out as SQL notebooks when you clone the repo, but you can just copy and paste the SQL to run them in Databricks SQL instead. Note, the queries assume your database is called audit_logs. If you chose to call it something else in the DLT configuration above, just replace audit_logs with the name of your database.
Easy visualization with Databricks SQL
As well as querying the data via a first-class SQL experience and lightning fast query engine, Databricks SQL allows you to quickly build dashboards with an intuitive drag-and-drop interface, and then share them with key stakeholders. What's more, they can be set to automatically refresh, ensuring that your decision makers always have access to the latest data.
It's hard to preempt all of the things that you might want to show your key stakeholders here, but hopefully the SQL queries and the associated visualizations demonstrated here should give you a glimpse of what's possible:
Which countries are my Delta Shares being accessed from?
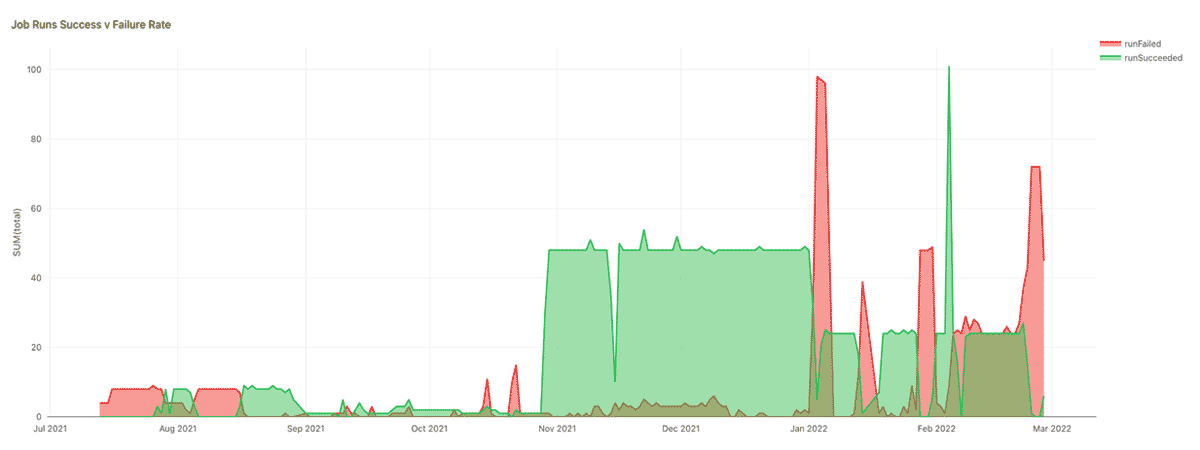
How reliable are my jobs?
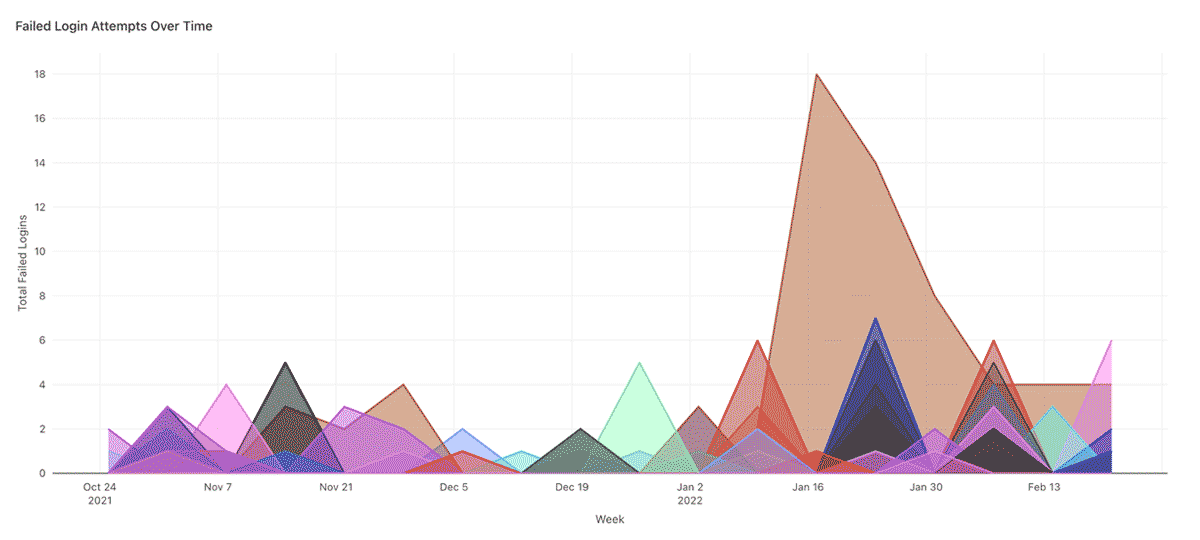
Failed login attempts over time
Spikes in failed login attempts can indicate brute force attacks, and trends should be monitored. In the chart below for example, the regular monthly spikes may be symptomatic of a 30 day password rotation policy, but the huge spike for one particular user in January looks suspicious.
You can find all of the SQL queries used to build these visualizations as well as many more besides in the example SQL queries provided in the repo.
Automatic alerting with Databricks SQL
As with any platform, there are some events that you're going to care about more than others, and some that you care about so much that you want to be proactively informed whenever they occur. Well, the good news is, you can easily configure Databricks SQL alerts to notify you when a scheduled SQL query returns a hit on one of these events. You can even make some simple changes to the example SQL queries we showed you earlier to get started:
- Update the queries to make them time bound (I.e. by adding a timestamp >= current_date() - 1)
- Update the queries to return a count of events you don't expect to see (I.e. by adding a COUNT(*) and an appropriate WHERE clause)
- Now you can configure an alert to run every day and trigger if the count of events is > 0
- For more complicated alerting based on conditional logic, consider the use of CASE statements (see the docs for AWS, Azure)
For example, the following SQL queries could be used to alert whenever:
1. There have been workspace configuration changes within the last day:
2. There have been downloads of artifacts that may contain data from the workspace within the last day:
These could be coupled with a custom alert template like the following to give platform administrators enough information to investigate whether the acceptable use policy has been violated:
There have been the following unexpected events in the last day:
Check out our documentation for instructions on how to configure alerts (AWS, Azure), as well as for adding additional alert destinations like Slack or PagerDuty (AWS, Azure).
Trust but Verify with 360 visibility into your Lakehouse
Databricks audit logs provide a comprehensive record of the actions performed on your lakehouse. However, if you're not using Unity Catalog (and trust me, if you aren't then you should be) then some of the interactions that you care most about might only be captured in the underlying cloud provider logs. An example might be access to your data, which if you use cloud native access controls is only really captured at the coarse grained level allowed by storage access logs.
As per our previous blog on the subject, for this (along with other reasons) you might also want to join your Databricks audit logs with various logging and monitoring outputs captured from the underlying cloud provider. And whilst the recommendations in the previous blog still hold true, stay tuned for a future revision including DLT pipelines for these workloads too!
Best practices roundup
To summarize, here are 5 logging & monitoring best practices for admins that we've touched on throughout this article:
- Enable audit logging at the account level. Having auditability from the very start of your lakehouse journey allows you to establish a historical baseline. Oftentimes, you only realize how much you need audit logs when you really, really need them. It's better to have that historical baseline than learn from this mistake, trust me.
- Adopt Unity Catalog. Enabling cross-cloud and cross-workspace analytics brings a new level of governance and control to the Lakehouse.
- Automate your logging pipelines- ideally using DLT. This makes sure that you're enforcing data hygiene and timeliness without needing lots of complex code, and even lets you set up easy notifications and alerts if (and when) something does break or change.
- Use a medallion architecture for your log data. This ensures that once your pipelines have brought you high-quality, timely data, it doesn't get dumped into a database that no one can find - and it becomes really easy to query using Databricks SQL!
- Use Databricks SQL to set up automatic alerts for the events that you really care about
- Incorporate your Databricks audit logs into your wider logging ecosystem. This might include cloud provider logs, and logs from your identity provider or other third-party applications. Creating a 360-degree view of what's happening on your Lakehouse is especially relevant in today's volatile security landscape!
Conclusion
In the two years since our last blog about audit logging, both the Databricks Lakehouse Platform and the world have changed significantly. Most of us have been working remotely during that time, but remote working puts increased pressure and scrutiny on acceptable use policies and how we measure that they're being followed. Luckily the Databricks Lakehouse Platform has made (and continues to make) huge strides to make this an easier problem for data teams to manage.
The authors of this blog would like to thank the authors of our previous blogs on these topics:
- Miklos Christine
- Craig Ng
- Anna Shrestinian
- Abhinav Garg
- Sajith Appukuttan
Standing on the shoulders of giants.
Get the latest posts in your inbox
Subscribe to our blog and get the latest posts delivered to your inbox.