ARC Uses a Lakehouse Architecture for Real-time Data Insights That Optimize Drilling Performance and Lower Carbon Emissions
Innovative visualization tool expedites drilling analysis with high resolution, live data
by Jitesh Soni, Amit Kara, Ala Qabaja and Cody Davis
This is a collaborative post between Databricks and ARC Resources. We thank Ala Qabaja, Senior Cloud Data Scientist, ARC Resources, for their contribution.
As a leader in responsible energy development, Canadian company ARC Resources Ltd. (ARC) was looking for a way to optimize drilling performance to reduce time and costs, while also minimizing fuel consumption to lower carbon emissions.
To do so, they required a data analytics solution that could ingest and visualize field operational data, such as well logs, in real-time to optimize drilling performance. ARC's data team was tasked with delivering an analytics dashboard that could provide drilling engineers with the ability to see key operational metrics for active well logs compared side-by-side against historical well logs. In order to achieve near real-time results, the solution needed the right streaming and dashboard technologies.
ARC has deployed the Databricks Lakehouse Platform to enable its drilling engineers to monitor operational metrics in near real-time, so that we can proactively identify any potential issues and enable agile mitigation measures. In addition to improving drilling precision, this solution has helped us in reducing drilling time for one of our fields. Time saving translates to reduction in fuel used and therefore a reduction in CO2 footprint that result from drilling operations.
Selecting Data Lakehouse Architecture
For the project, ARC needed a streaming solution that would make it easy to ingest an ongoing stream of live events, as well as historical data points. It was critical that ARC's business users could see metrics from an active well(s), in addition to selected historical wells at the same time.
With these requirements, the team needed to create data alignment normalized on drilling depth between streaming and historical well logs. Ideally, the data analytics solution wouldn't require replaying and streaming of historical data for each active well, instead leveraging Power BI's data integration features to provide this functionality.
This is where Delta Lake, an open storage format for the data lake, provided the necessary capabilities for working with the streaming and batch data required for well operations. After researching potential solutions, the project team determined that Delta Lake had all of the features needed to meet ARC's streaming and dashboarding requirements. During the process, the team identified four main advantages provided by Delta Lake that made it an appropriate choice for the application:
- Delta Lake can be used as a Structured Streaming sink, which enables the team to incrementally process data in near real-time.
- Delta Lake can be used to store historical data and can be optimized for fast query performance, which the team needed for downstream reporting and forecasting applications.
- Delta Lake provides the mechanism to update/delete/insert records as needed and with the necessary velocity.
- Power BI provides the ability to consume Delta Lake tables in both direct and import modes, which allows users to analyze streaming data and historical data with minimal overhead. Not only does this decrease high ingress/outgress data flows, but also gives users the option to select a historical well of their choice, and the flexibility to change it for added analysis and decision-making capability.
These characteristics solved all the pieces of the puzzle and enabled seamless data delivery to Power BI.
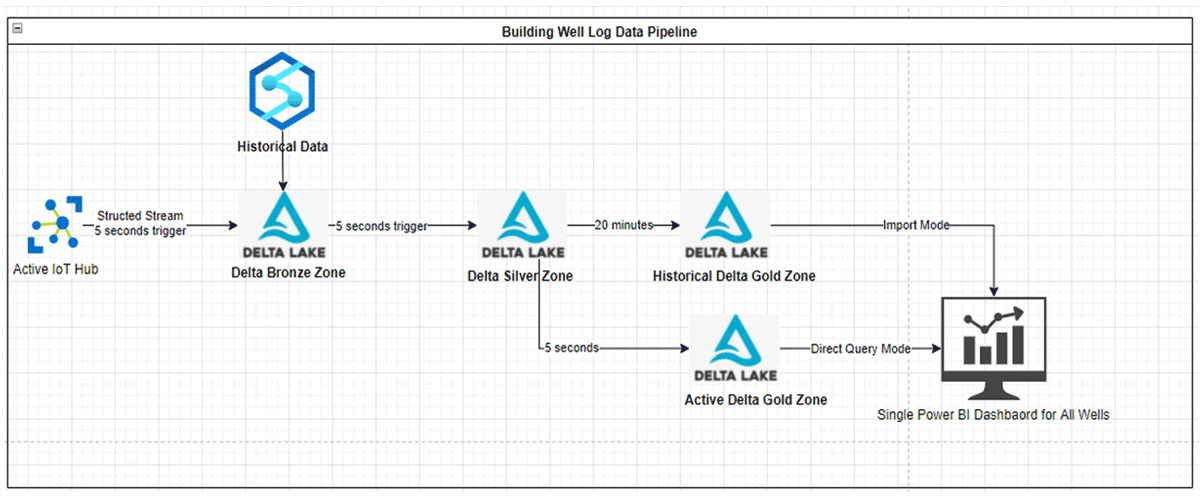
Data ingestion and transformation following the Medallion Architecture
For active well logs, data is received into ARC's Azure tenant through internet of things (IoT) edge devices, which are managed by one of ARC's partners. Once received, messages are delivered to an Azure IoT Hub instance. From there, all data ingestion, calculation, and cleaning logic is done through Databricks.
First, Databricks reads the data through a Kafka connector, and then writes it to the Bronze storage layer. Once there, another structured stream process picks it up, applies de-duplication and column renaming logic, and finally lands the data in the Silver layer. Once in the Silver layer, a final streaming process picks up changed data, applies calculations and aggregations, and directs the data into the active stream and the historical stream. Data in the active stream is landed in the Gold layer and gets consumed by the dashboard. Data in the historical stream also lands in the Gold layer where it gets consumed for machine learning experimentation and application, in addition to being a source for historical data for the dashboard.
Enabling core business use cases with the Power BI dashboard
Optimizations
The goal for the dashboard was to refresh the data every minute, and for a complete refresh cycle to finish within 30 seconds, on average. Below are some of the obstacles the team overcame in the journey to deliver real-time analysis.
In the first version of the report, it took 3-4 minutes for the report to make a complete refresh, which was too slow for business users. To achieve the 30-second SLA, the team implemented the following changes:
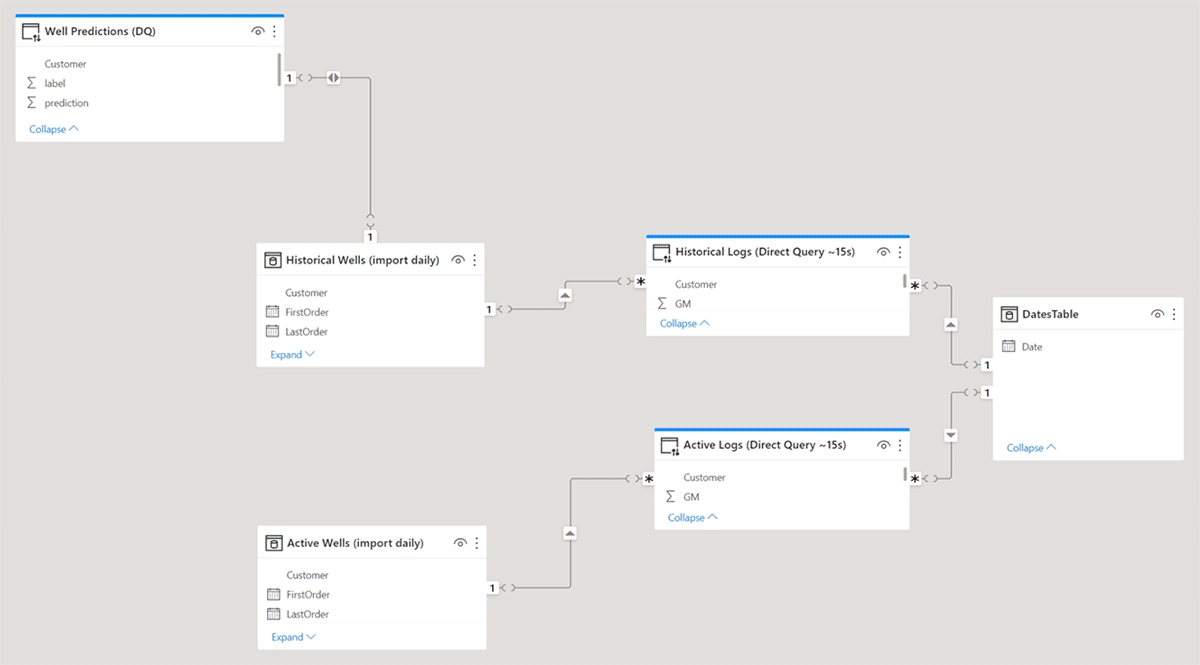
- Improved Data Model: In the data model, historical and active data streams resided in separate tables. Historical data needed to refresh on a nightly basis and therefore, import mode was used in PowerBI. For active data, the team used direct query mode so the dashboard would display it in near real-time. Both tables contain contextual data used for filtering and numeric data used for plotting. The data model was also improved by implementing the following changes:
- Instead of querying all of the columns in these tables at once, the team added a view layer in Databricks and selected only the required columns. This minimized I/O and improved query performance by 20-30 seconds.
- Instead of querying all rows for historical data, the team filtered the view to only select the rows that were required for offset analysis purposes. With these filters, I/O was significantly reduced, improving performance by 50-60 seconds.
- The project team redesigned the data model so that contextual data was loaded in a separate table from numeric data. This helped in reducing the size of the data model by avoiding repeating text data with low cardinality across the entire table. In other words, the team broke this flat table into fact and dimensional tables. This improved performance by 10-20 seconds.
- By removing the majority of Power BI Data Analysis Expressions (DAX) calculations that were applied on the active well, and pushing these calculations to the view layer in Databricks, we improved performance by 10 seconds.
- Reduce Visuals: Every visualization translates into one or more queries from Power BI to Databricks SQL, which results in more traffic and latency. Therefore, the team decided to remove some of the visualizations that were not absolutely necessary. This improved performance by another 10 seconds.
- Power BI Configurations: Updating some of the data source settings helped improve performance by 20-30 seconds.
- Load Balancing: Spinning up 2-3 clusters on the Databricks side to handle query load played a big factor in improving performance and reducing queue time for queries.
Final thoughts
Performing near real-time BI is challenging in and of itself when you are streaming logs or IoT data in real-time. It is just as challenging to construct a near real-time dashboard that combines high-speed insight with large historical analytics in one view. ARC utilized Spark Structured Streaming, the lakehouse architecture, and Power BI to do just that: create a unified dashboard that allows monitoring of key operational parameters for active well logs, and compare them to well log data for historical wells of interest. The ability to combine real-time streaming logs from live oil wells with enriched historical data from all wells supported the key use case.
As a result, the team was able to derive operational metrics in near real-time by utilizing the power of structured streaming, Delta Lake architecture, the speed and scalability of Databricks SQL, and the advanced dashboarding capabilities that Power BI provides.
About ARC Resources Ltd.
ARC Resources Ltd. (ARC) is a global leader in responsible energy development, and Canada's third-largest natural gas producer and largest condensate producer. With a diverse asset portfolio in the Montney resource play in western Canada, ARC provides a long-term approach to strategic thinking, which delivers meaningful returns to shareholders.
Learn more at arcresources.com.
Acknowledgment:
This project was completed in collaboration with Databricks professional services, NOV – MD Totco and BDO Lixar.
Get the latest posts in your inbox
Subscribe to our blog and get the latest posts delivered to your inbox.