How to Profile PySpark

In Apache Spark™, declarative Python APIs are supported for big data workloads. They are powerful enough to handle most common use cases. Furthermore, PySpark UDFs offer more flexibility since they enable users to run arbitrary Python code on top of the Apache Spark™ engine. Users only have to state "what to do"; PySpark, as a sandbox, encapsulates "how to do it". That makes PySpark easier to use, but it can be difficult to identify performance bottlenecks and apply custom optimizations.
To address the difficulty mentioned above, PySpark supports various profiling tools, which are all based on cProfile, one of the standard Python profiler implementations. PySpark Profilers provide information such as the number of function calls, total time spent in the given function, and filename, as well as line number to help navigation. That information is essential to exposing tight loops in your PySpark programs, and allowing you to make performance improvement decisions.
Driver profiling
PySpark applications run as independent sets of processes on a cluster, coordinated by the SparkContext object in the driver program. On the driver side, PySpark is a regular Python process; thus, we can profile it as a normal Python program using cProfile as illustrated below:
Get started with ETL
Workers profiling
Executors are distributed on worker nodes in the cluster, which introduces complexity because we need to aggregate profiles. Furthermore, a Python worker process is spawned per executor for PySpark UDF execution, which makes the profiling more intricate.
The UDF profiler, which is introduced in Spark 3.3, overcomes all those obstacles and becomes a major tool to profile workers for PySpark applications. We'll illustrate how to use the UDF Profiler with a simple Pandas UDF example.
Firstly, a PySpark DataFrame with 8000 rows is generated, as shown below.
Later, we will group by the id column, which results in 8 groups with 1000 rows per group.
The Pandas UDF plus_one is then created and applied as shown below:
Note that plus_one takes a pandas DataFrame and returns another pandas DataFrame. For each group, all columns are passed together as a pandas DataFrame to the plus_one UDF, and the returned pandas DataFrames are combined into a PySpark DataFrame.
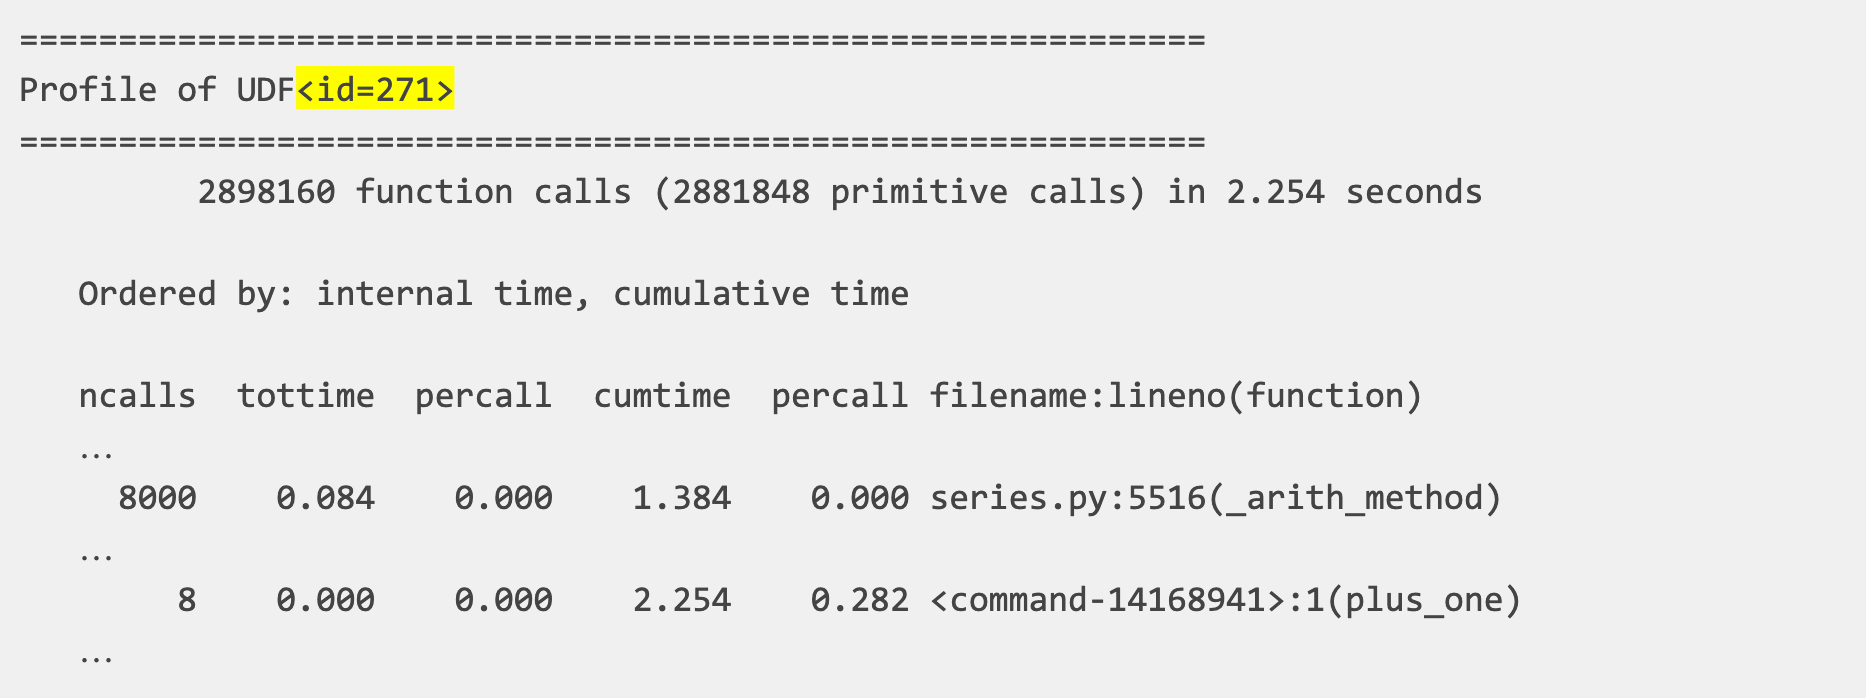
Executing the example above and running sc.show_profiles() prints the following profile. The profile below can also be dumped to disk by sc.dump_profiles(path).

The UDF id in the profile (271, highlighted above) matches that in the Spark plan for res. The Spark plan can be shown by calling res.explain().

The first line in the profile's body indicates the total number of calls that were monitored. The column heading includes
ncalls, for the number of calls.tottime, for the total time spent in the given function (excluding time spent in calls to sub-functions)percall, is the quotient oftottimedivided byncallscumtime, is the cumulative time spent in this and all subfunctions (from invocation till exit)percall, is the quotient ofcumtimedivided by primitive callsfilename:lineno(function), provides the respective information for each function
Digging into the column details: plus_one is triggered once per group, 8 times in total; _arith_method of pandas Series is called once per row, 8000 times in total. pandas.DataFrame.apply applies the function lambda x: x + 1 row by row, thus suffering from high invocation overhead.
We can reduce such overhead by substituting the pandas.DataFrame.apply with pdf + 1, which is vectorized in pandas. The optimized Pandas UDF looks as follows:
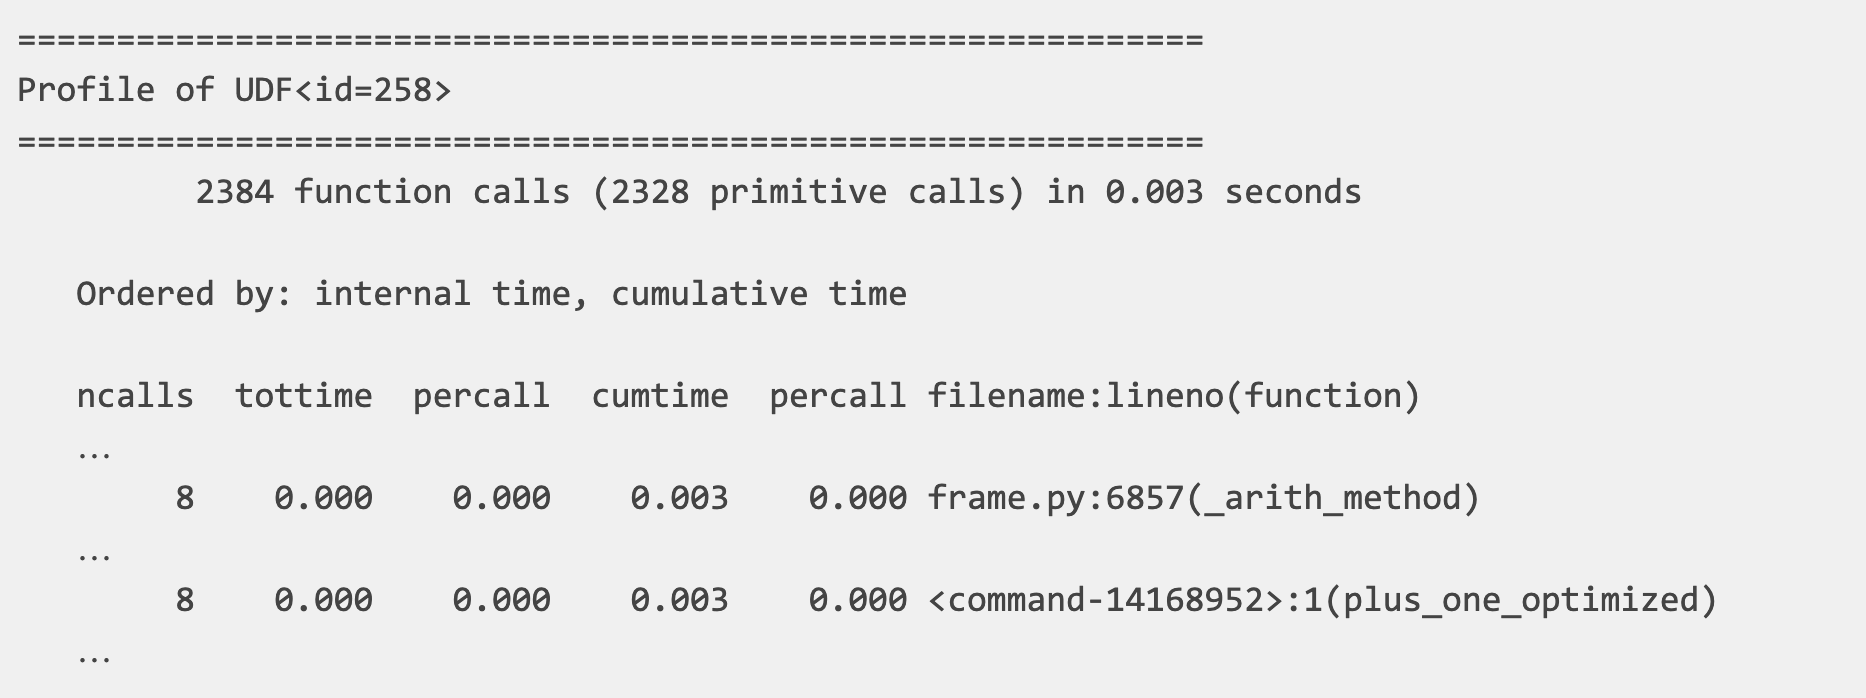
The updated profile is as shown below.

We can summarize the optimizations as follows:
- Arithmetic operation from 8,000 calls to 8 calls
- Total function calls from 2,898,160 calls to 2,384 calls
- Total execution time from 2.300 seconds to 0.004 seconds
The short example above demonstrates how the UDF profiler helps us deeply understand the execution, identify the performance bottleneck and enhance the overall performance of the user-defined function.
The UDF profiler was implemented based on the executor-side profiler, which is designed for PySpark RDD API. The executor-side profiler is available in all active Databricks Runtime versions.
Both the UDF profiler and the executor-side profiler run on Python workers. They are controlled by the spark.python.profile Spark configuration, which is false by default. We can enable that Spark configuration on a Databricks Runtime cluster as shown below.

Conclusion
PySpark profilers are implemented based on cProfile; thus, the profile reporting relies on the Stats class. Spark Accumulators also play an important role when collecting profile reports from Python workers.
Powerful profilers are provided by PySpark in order to identify hot loops and suggest potential improvements. They are easy to use and critical to enhance the performance of PySpark programs. The UDF profiler, which is available starting from Databricks Runtime 11.0 (Spark 3.3), overcomes all the technical challenges and brings insights to user-defined functions.
In addition, there is an ongoing effort in the Apache Spark™ open source community to introduce memory profiling on executors; see SPARK-40281 for more information.
