What’s New with Databricks Notebooks
Databricks Notebooks offers developers a managed authoring experience where data and AI teams can efficiently collaborate on projects together. The team here is working hard as we prepare to share exciting new innovations for Notebooks at the Data + AI Summit later this month, and we hope you will join us at our session Develop Like a Pro in Databricks Notebooks, led by Weston Hutchins and Neha Sharma. As a warm up, we wanted to take a quick look back at some recent additions in Notebooks.
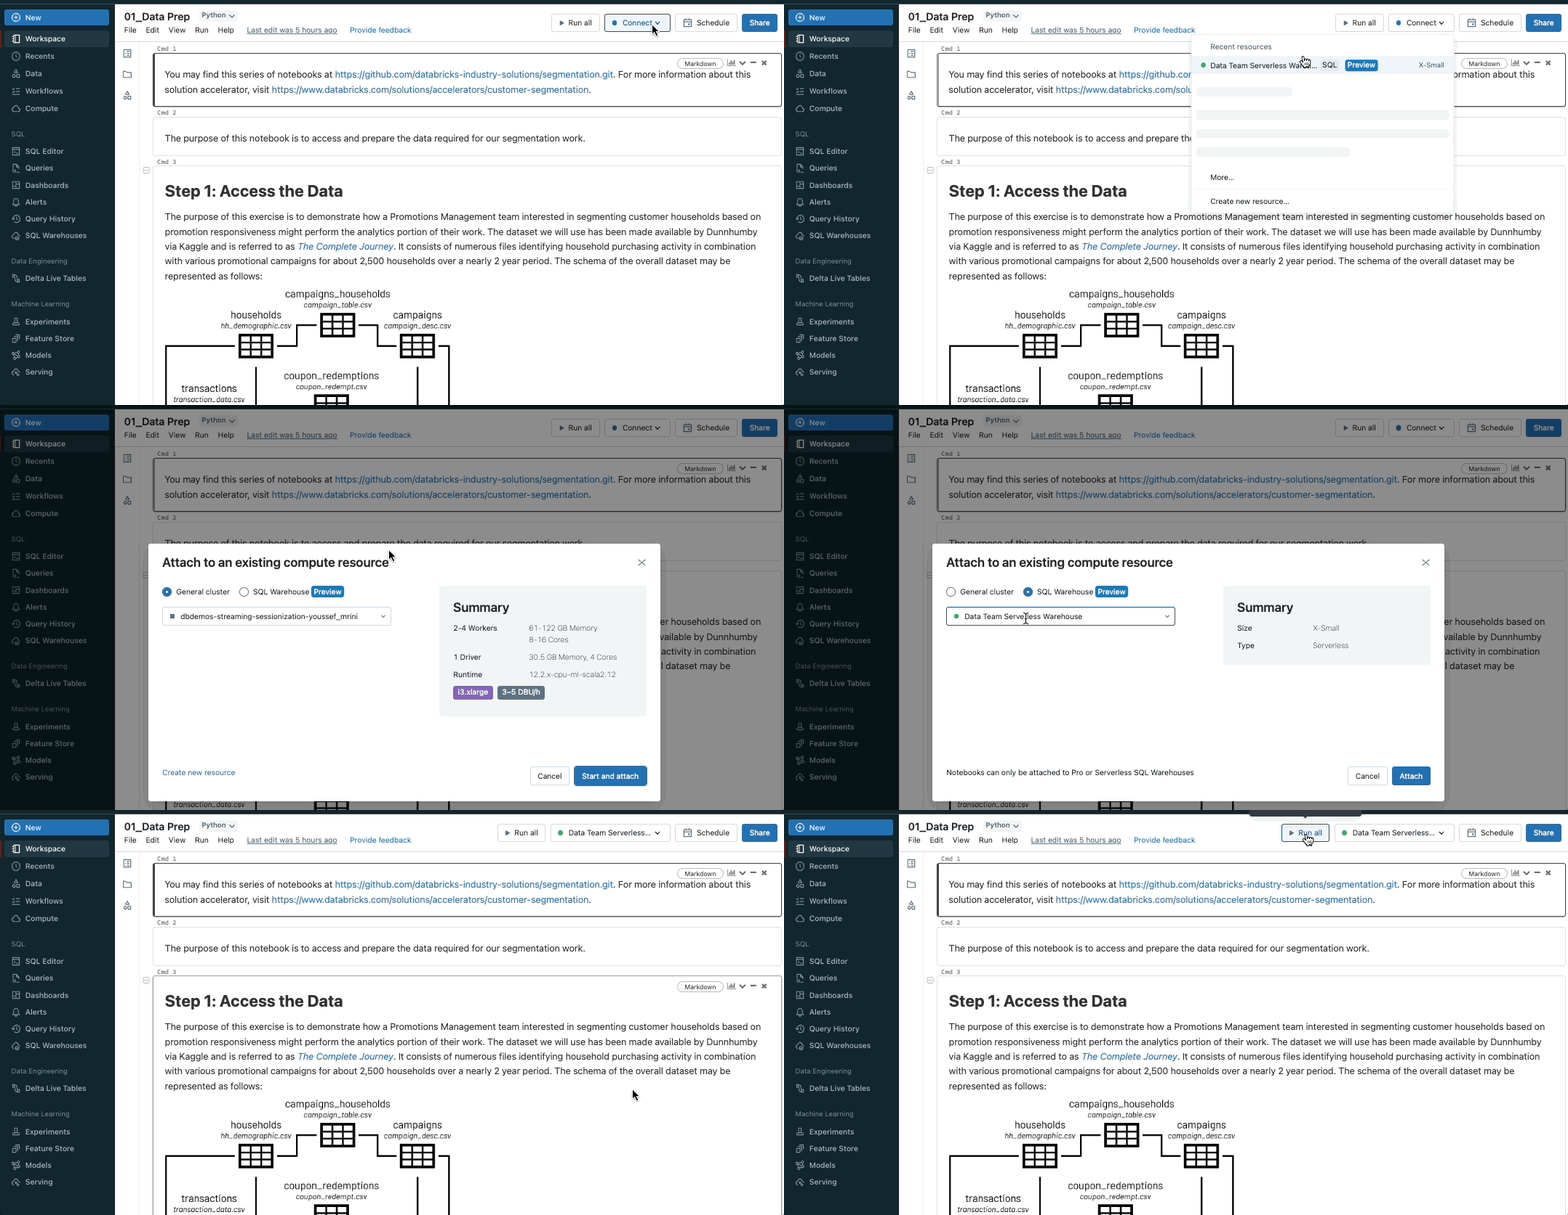
Run Databricks Notebooks on SQL Warehouses
SQL is the 2nd most popular language in Notebooks behind Python, and to better support our users who love SQL, we are bringing SQL warehouses to Notebooks. SQL warehouses are the same resources that power Databricks SQL, and they deliver better price-performance for SQL execution compared to all-purpose clusters. This feature is rolling out now, so keep an eye out!
While attached to a SQL warehouse, only your notebook’s SQL cells will execute. Cells using other languages (like Python or Scala) will be skipped. Markdown cells will continue to be rendered. To learn more, visit our documentation.
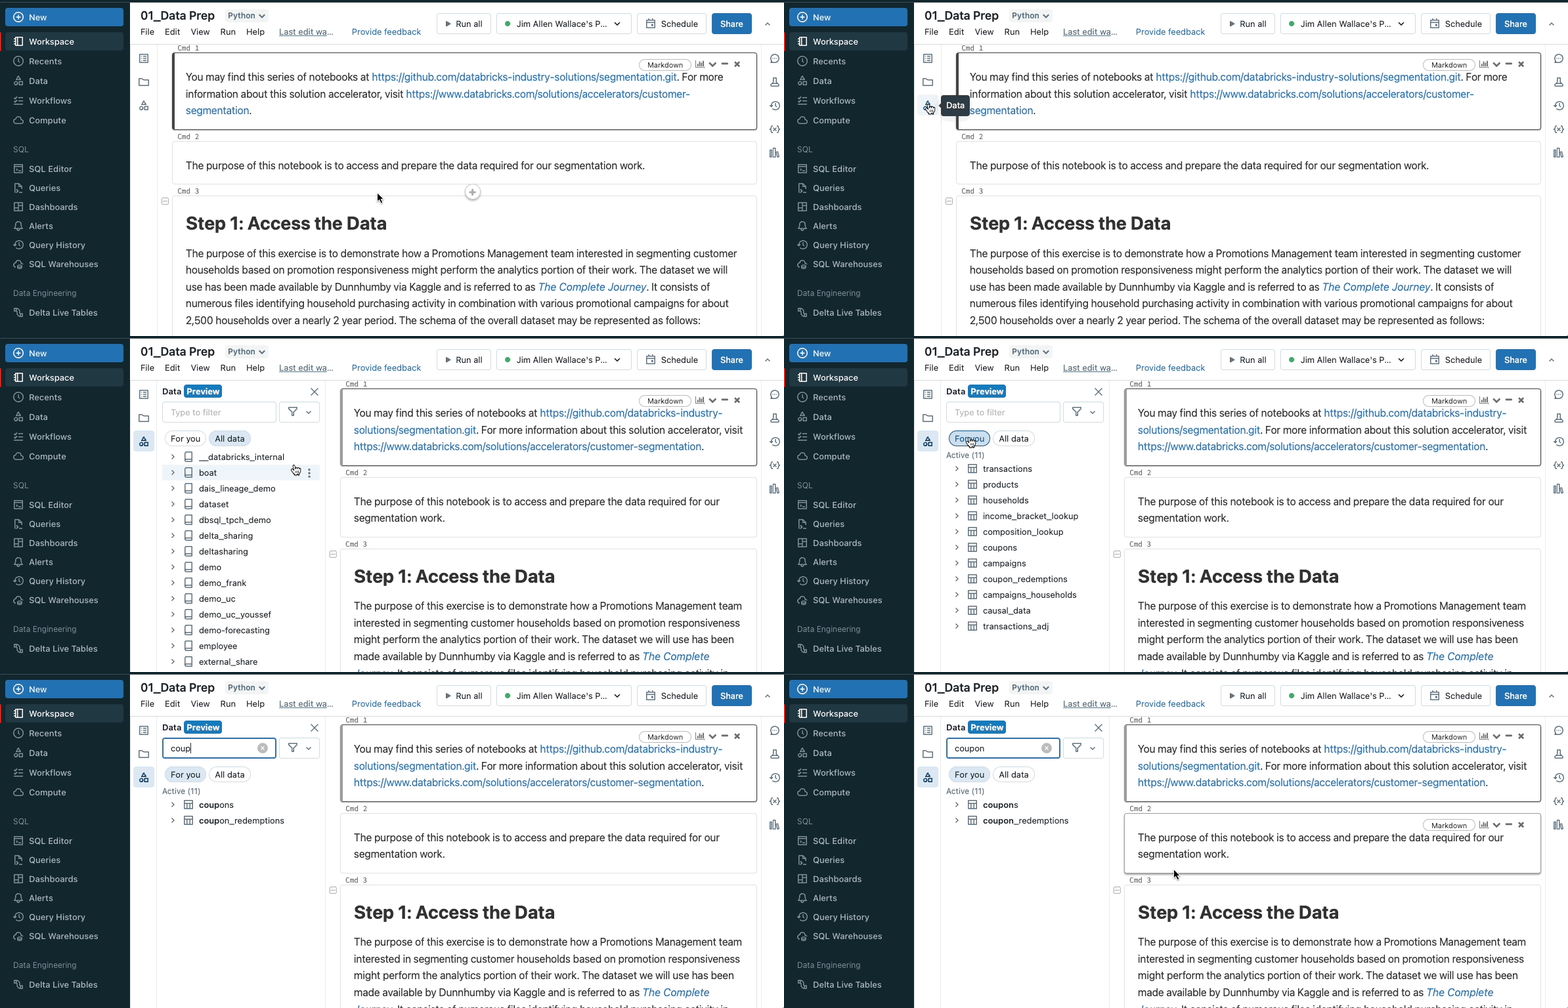
View data from Notebooks, SQL editor and Data Explorer in the same experience
The new unified schema browser lets you view all of the data in the Unity Catalog metastore without leaving a notebook or the SQL editor. You can select “For you” to filter the list to the active tables in your notebook.
As you type your search request into the filter box, the display actively updates to show only those items that contain that text. This will look for items that are currently open or have been opened earlier in the current session. Learn more here.
Gartner®: Databricks Cloud Database Leader
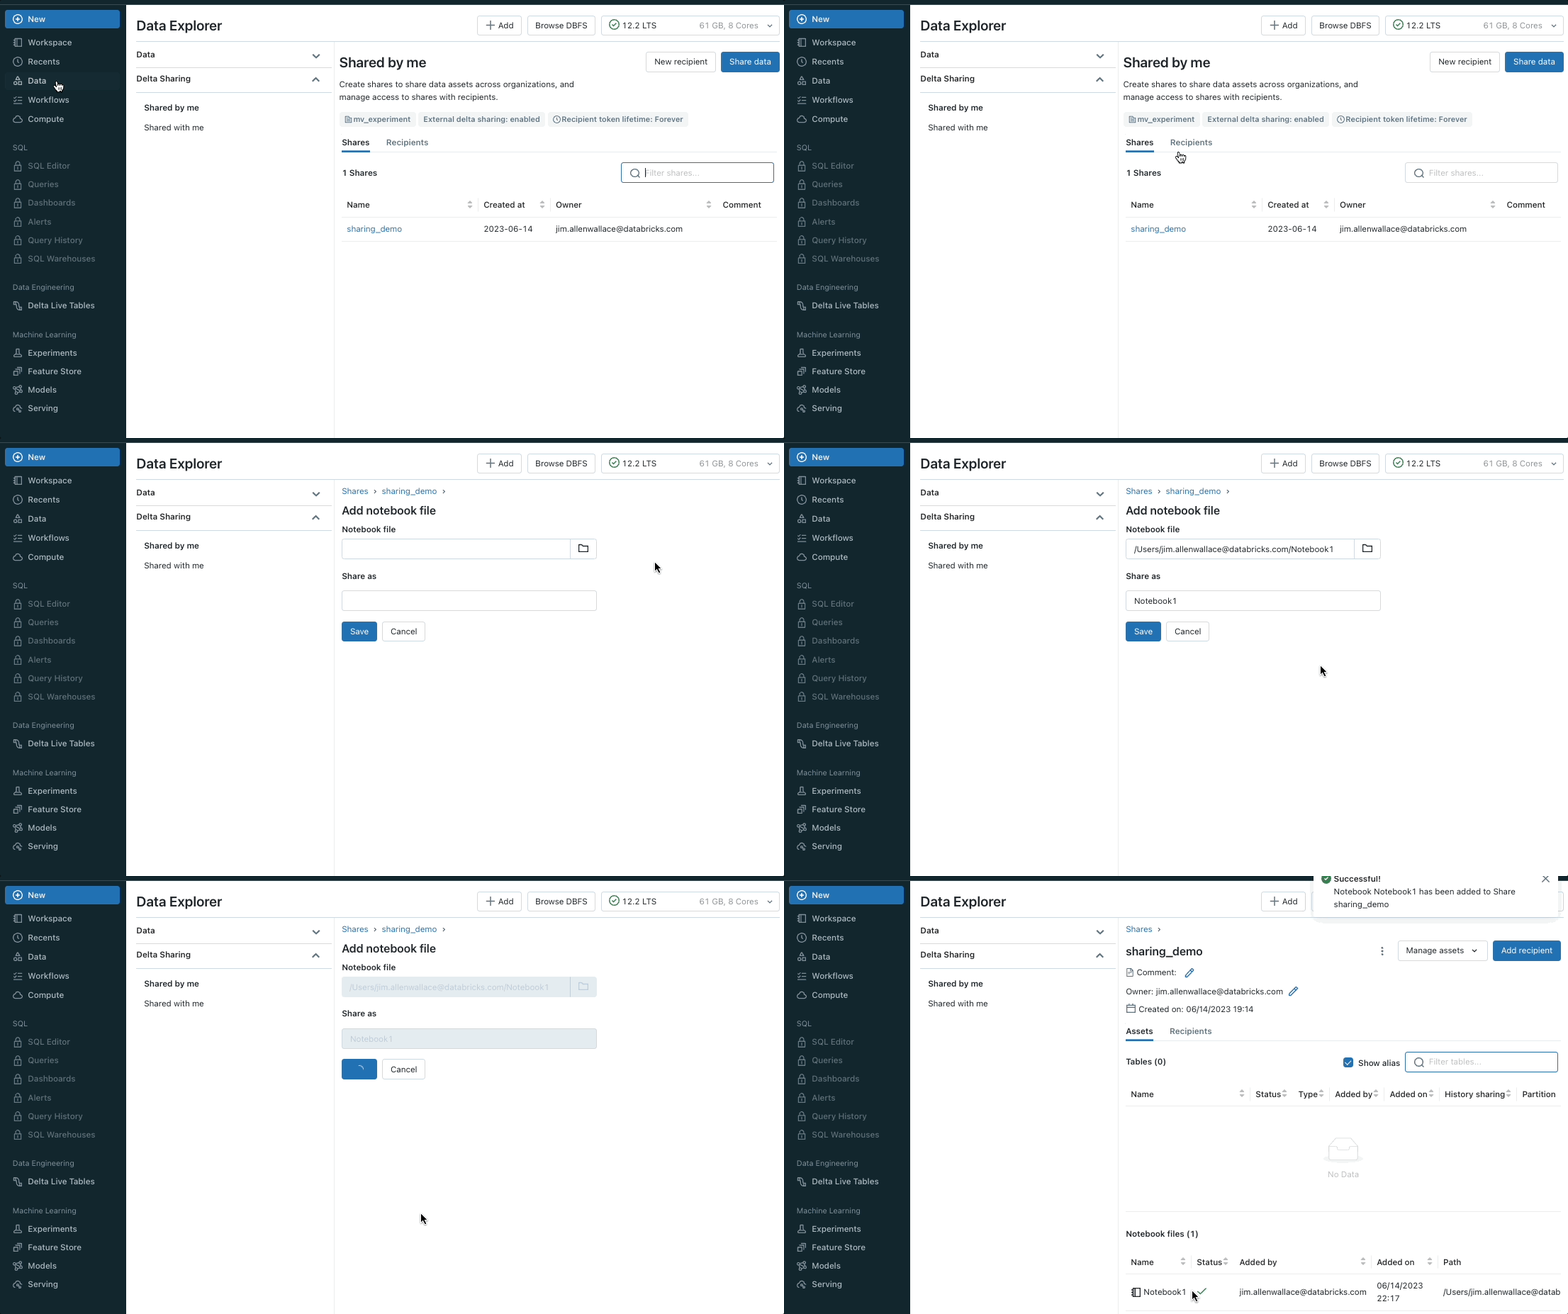
Share Notebooks using Delta Sharing
You can now use Delta Sharing to share notebook files with the Databricks-to-Databricks sharing flow. You get the ease and security of Delta Sharing. Sharing notebooks empowers you to collaborate across metastores and accounts. This enables people who share data to unpack the value of that data with notebooks.
To learn more, here is how you can add notebooks to a share (for providers) and how to read shared notebooks (for recipients).
Debug your Notebooks with the Variable Explorer
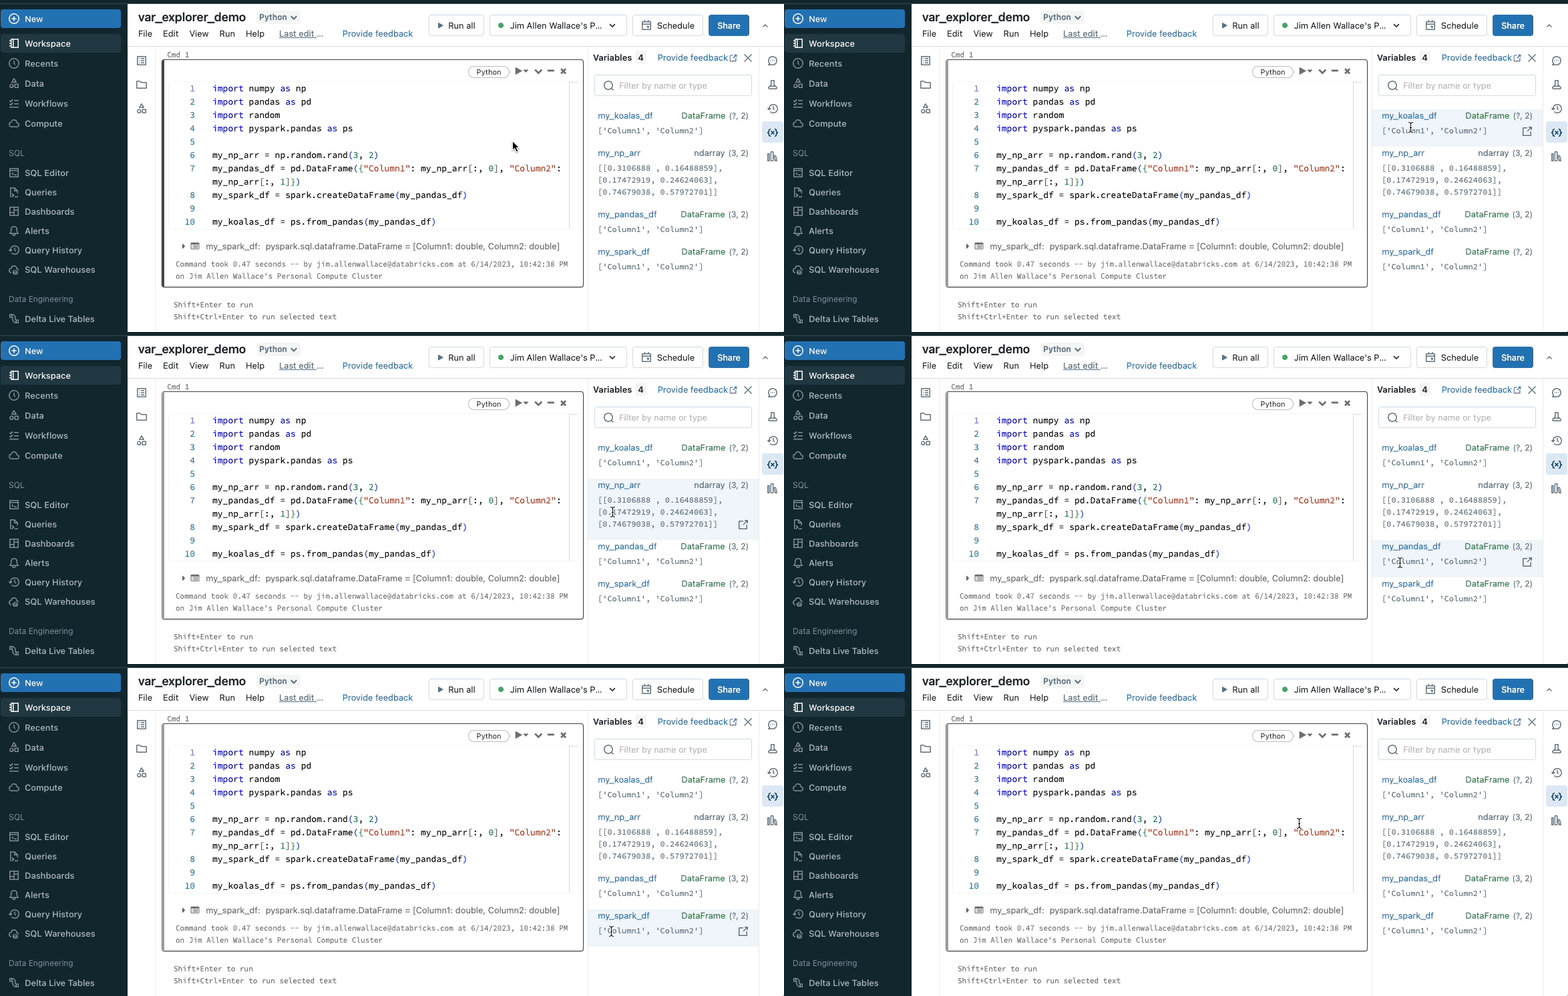
The Variable Explorer displays the state of all the Python variables in your notebook development session. The name, type, and value are surfaced for all simple variable types. The Variable Explorer also surfaces additional metadata for Spark and Pandas DataFrames. The shape and column names are available at-a-glance, and a full view of the schema is available on hover.
The Variable Explorer also allows you to step through and debug Python code by leveraging the support for pdb in Databricks Notebooks. You can set breakpoints with breakpoint() or pdb.set_trace(). When you run the cell, the execution will pause at the breakpoint and the Variable Explorer will automatically update with the state of the notebook at that breakpoint. See our documentation for more information.
See you at Summit
At Data + AI Summit 2023, we’ll have deep dive sessions into using Notebooks. We will also talk about the newest ways to be more efficient while using Databricks. We hope to see you there.
