Announcing GA of Provider Usage Analytics
Optimize Your Lead Generation and Conversion on Databricks Marketplace

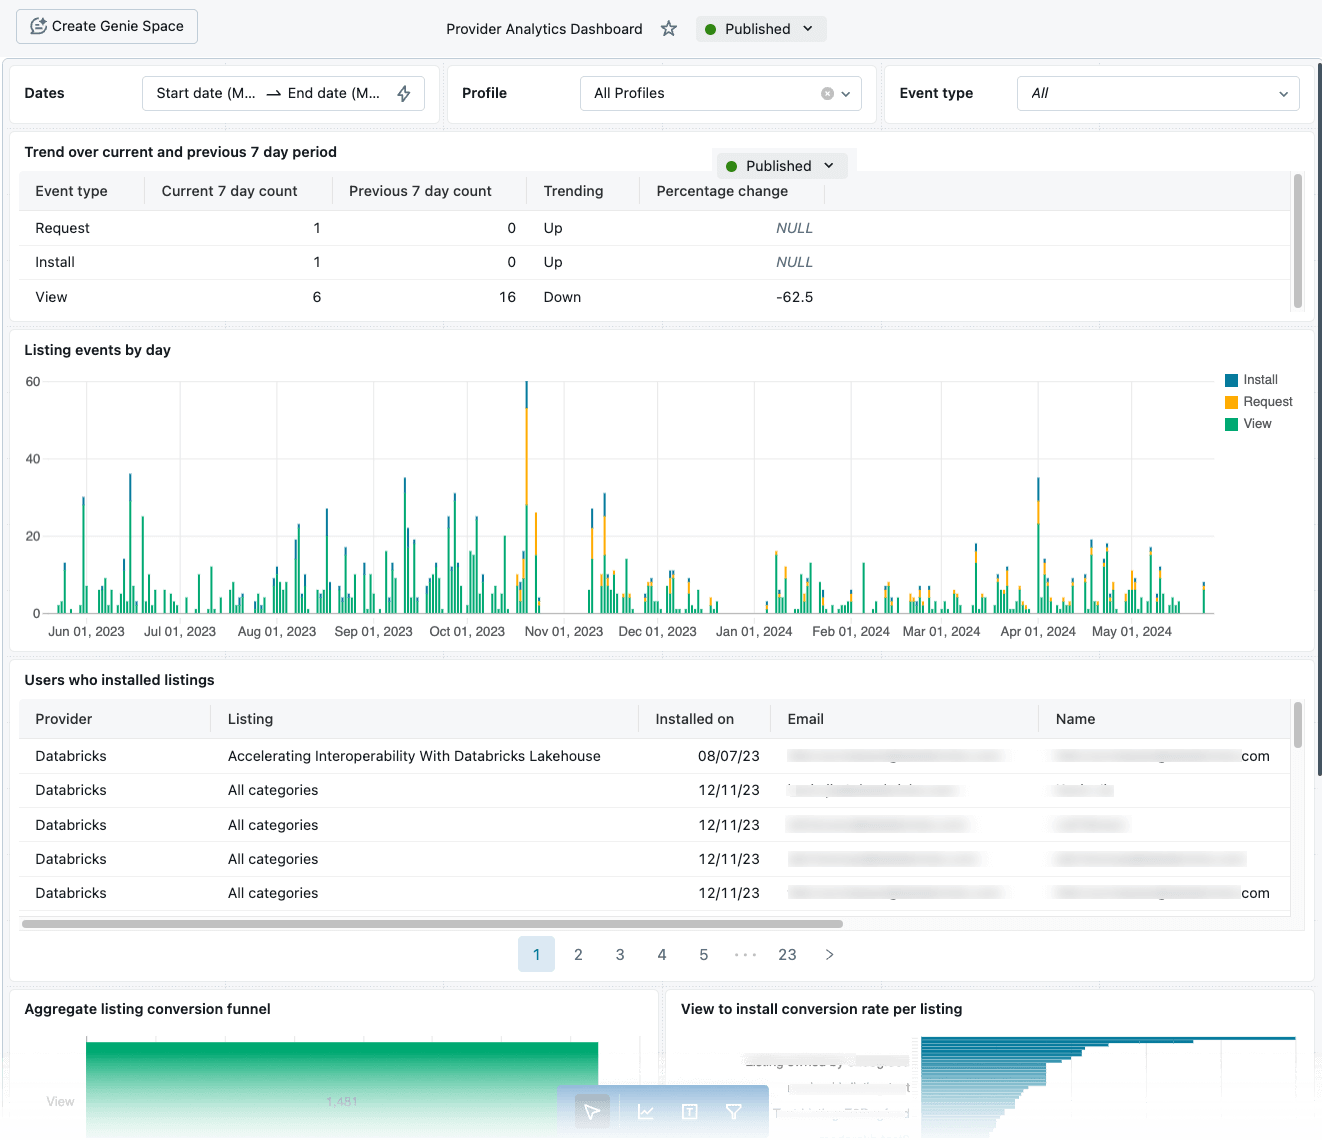
We are announcing the General Availability of Provider Usage Analytics for Databricks Marketplace providers. This feature lets you analyze lead generation and product interest in real time, giving you clear insights into who your leads are, the companies they represent, and how they interact with your listings. This helps providers understand their audience and product performance better, aiding in growth and improving lead conversion.
Why Provider Usage Analytics?
Every provider needs to know what's effective and where improvements are needed. Whether you're selling data, AI models, or other solutions, understanding how customers find and engage with your products is crucial for refining your strategy.
With Provider Usage Analytics, we give you the tools to:
- Understand who your leads are: Identify key information about leads, including their companies and roles, helping you tailor your messaging and offerings.
- Optimize lead conversion: Track leads as they move through the funnel—from viewing a listing to installing your data product.
- Refine your top-of-funnel strategy: Learn which of your Marketplace listings are generating the most interest, helping you refine or highlight popular offerings.

This new capability is an extension of our existing Marketplace Usage System Table, providing rich, actionable insights through an easy-to-use interface.
Key Capabilities of Provider Usage Analytics
Let’s dive into the core features and benefits of Provider Usage Analytics:
1. Track Leads Interacting with your Products
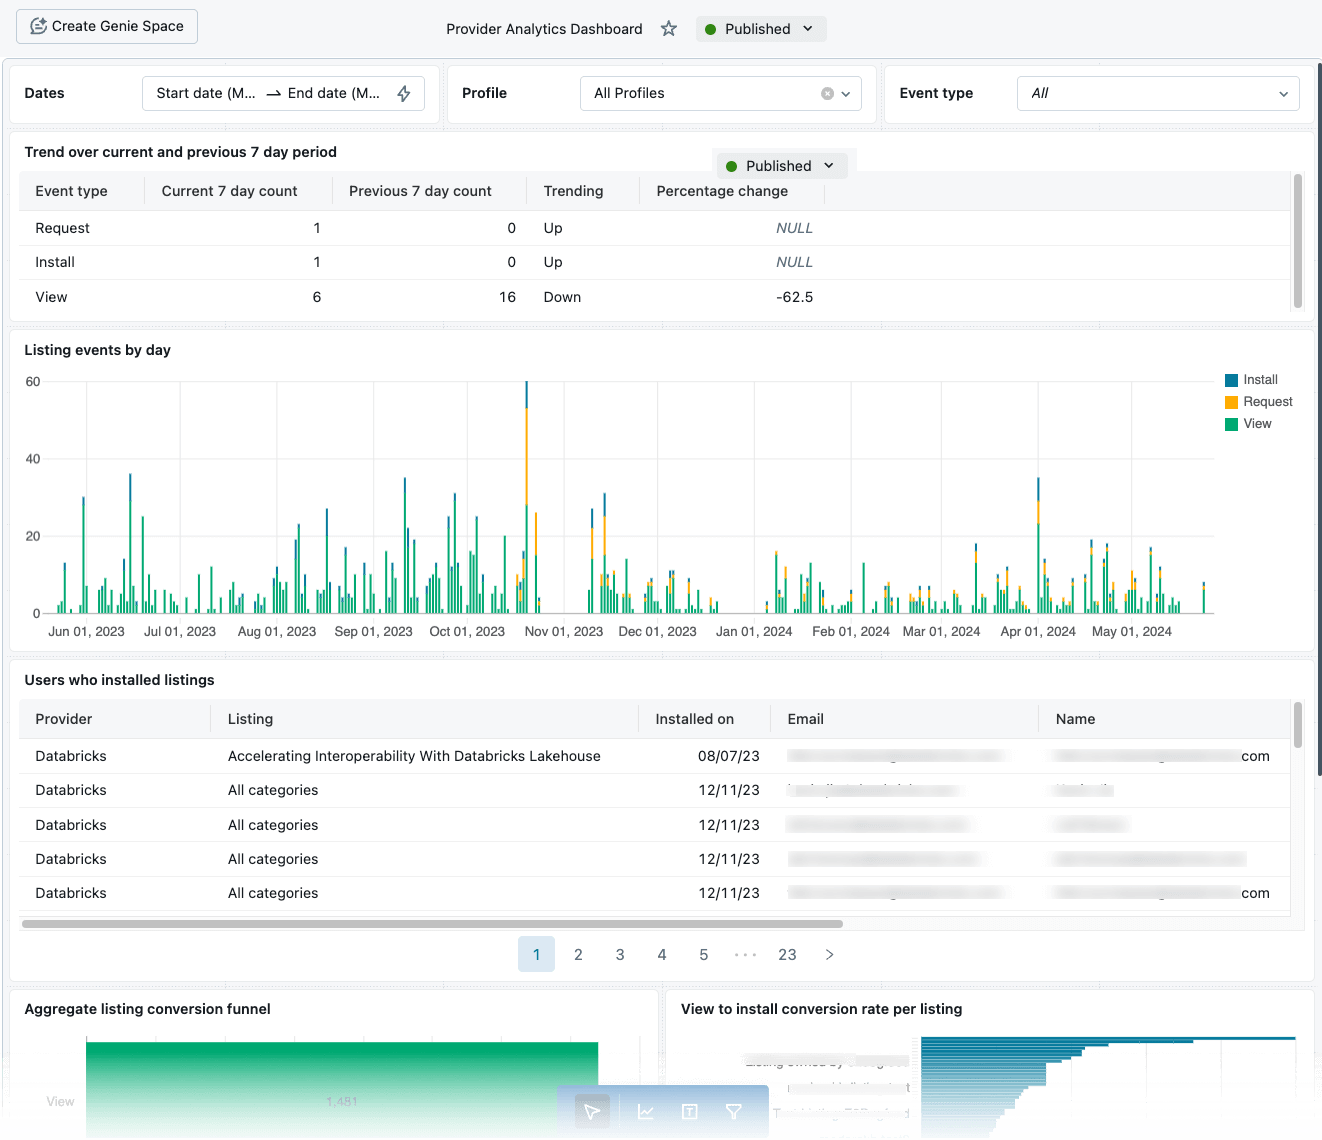
As a provider, you can now access a complete view of the leads generated from your Marketplace listings—whether they are gated (requiring approval) or instantly available. The new lead insights feature allows you to see where leads are coming from, and what products they are interested in.

2. Funnel Analytics for Customer Acquisition
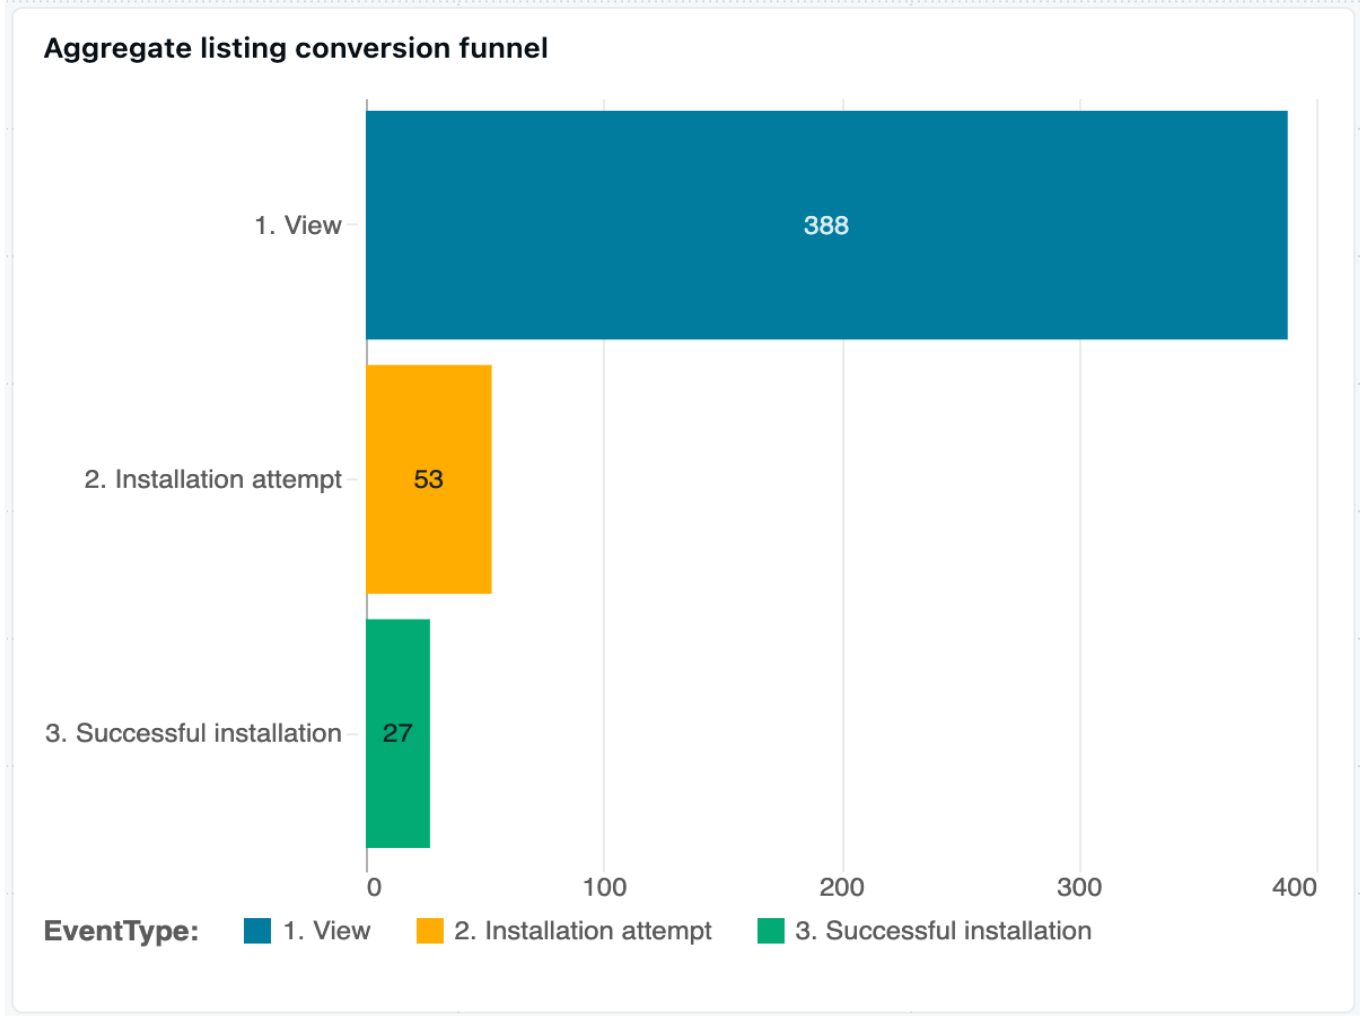
Understanding the steps involved in converting a lead to a paying customer is essential for optimizing your offerings. The Provider Usage Analytics feature includes a funnel view that highlights the key stages of customer acquisition for each of your listings. From viewing the listing to installing your data product, you’ll be able to analyze the journey across all your offerings over any selected date range.

This end-to-end view gives you valuable insights into which listings are performing well and which stages might need more attention. The visualization enables you to identify where drop-offs occur, helping you fine-tune your listings and improve customer acquisition.

3. Aggregate Listing Statistics
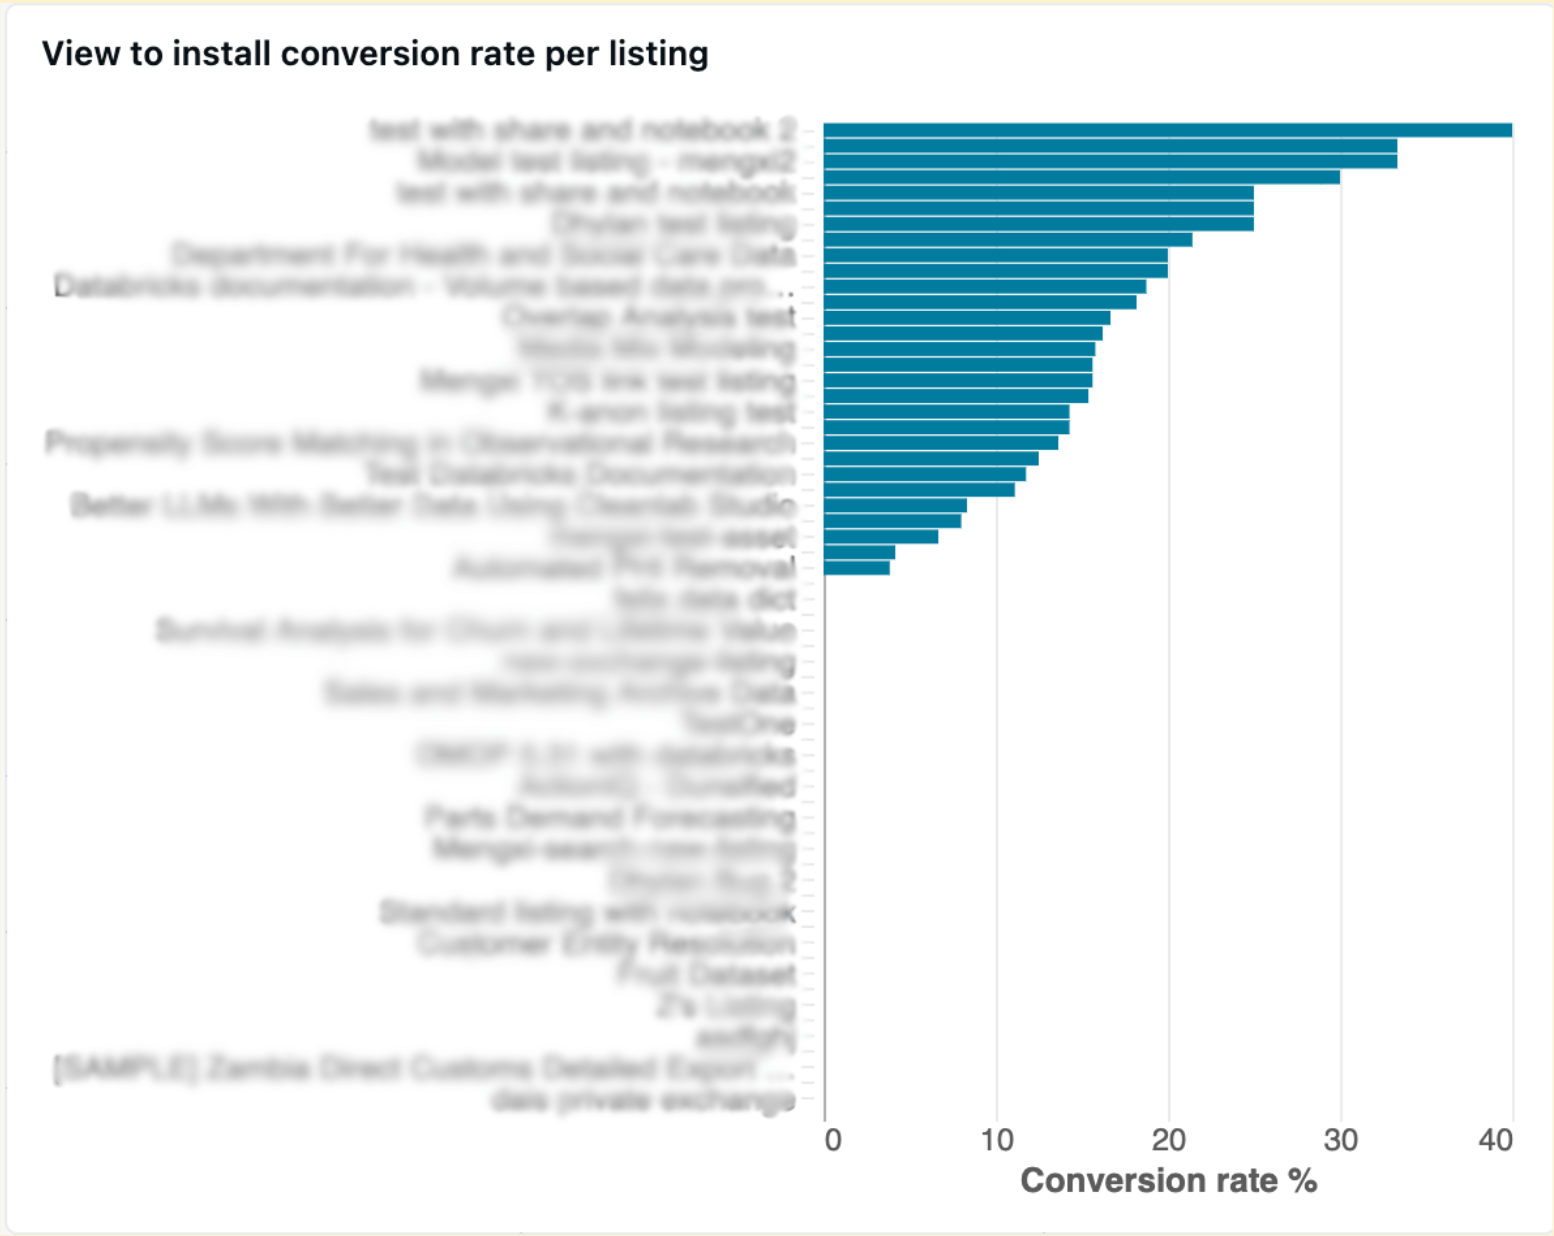
Curious about which of your products are drawing the most interest? Now you can easily see aggregate view statistics for all your listings in one place. For every listing, the Provider Usage Analytics tool displays the total number of views over time, allowing you to understand which products are catching the eyes of potential customers.
You’ll be able to drill down into the details to answer questions like:
- Which of my listings are seeing the most engagement?
- Are certain product categories or listings driving more interest?
- How do views trend over time, and are they aligned with my marketing efforts?
It’s not just about who’s looking—it’s about who’s buying. With aggregate installation statistics, you’ll be able to track how many users are installing your products across all listings. This information is key to understanding how well your products are converting interest into action.
Additionally, for more granular insights, you can view detailed installation statistics at the listing level. These statistics give a clear picture of the number of installations that occurred over specific timeframes, which can inform future product decisions and marketing strategies.

How AccuWeather leverages Provider Usage Analytics
Databricks Marketplace provider AccuWeather offers the most comprehensive historical weather and environmental database available, pinpoint forecast weather data sets with documented Superior Accuracy™, and unique solution accelerators such as demand forecasting and retail weather targeting.
AccuWeather’s experts leverage Provider Usage Analytics to gain real-time insights into lead generation and product interest, allowing them to understand who their leads are, what companies they represent, and how they interact with AccuWeather's listings. This capability enables AccuWeather to track leads throughout their sales funnel, from viewing a listing to installing a data product, helping them identify where potential drop-offs occur and refine their strategies accordingly.
“Provider Usage Analytics on Databricks Marketplace gives us the visibility we need to understand our audience better and tailor our offerings to meet their needs effectively. This information is crucial for identifying successful products, understanding market trends, and improving lead conversion by identifying where potential drop-offs occur.” — Eric Michielli, Senior Director of Data and Weather Technology, AccuWeather.
Get Started with Provider Usage Analytics
The Provider Usage Analytics feature is available now on the Databricks Marketplace provider console. With just a few clicks, you’ll have access to all the insights you need to drive meaningful engagement and increase conversions.
Ready to dive into the data?
- Read the documentation
- Log in to your provider console today and start exploring the power of Provider Usage Analytics.
Never miss a Databricks post
What's next?

Product
November 21, 2024/3 min read
