Cohort Analysis on Databricks Using Fivetran, dbt and Tableau
Applied marketing analytics on the Modern Data Stack

Overview
Cohort Analysis refers to the process of studying the behavior, outcomes and contributions of customers (also known as a “cohort”) over a period of time. It is an important use case in the field of marketing to help shed more light on how customer groups impact overall top-level metrics such as sales revenue and overall company growth. A cohort is defined as a group of customers who share a common set of characteristics. This can be determined by the first time they ever made a purchase at a retailer, the date at which they signed up on a website, their year of birth, or any other attribute that could be used to group a specific set of individuals. The thinking is that something about a cohort drives specific behaviors over time. The Databricks Lakehouse, which unifies data warehousing and AI use cases on a single platform, is the ideal place to build a cohort analytics solution: we maintain a single source of truth, support data engineering and modeling workloads, and unlock a myriad of analytics and AI/ML use cases. In this hands-on blog post, we will demonstrate how to implement a Cohort Analysis use case on top of the Databricks in three steps and showcase how easy it is to integrate the Databricks Lakehouse Platform into your modern data stack to connect all your data tools across data ingestion, ELT, and data visualization.
Use case: analyzing return purchases of customers
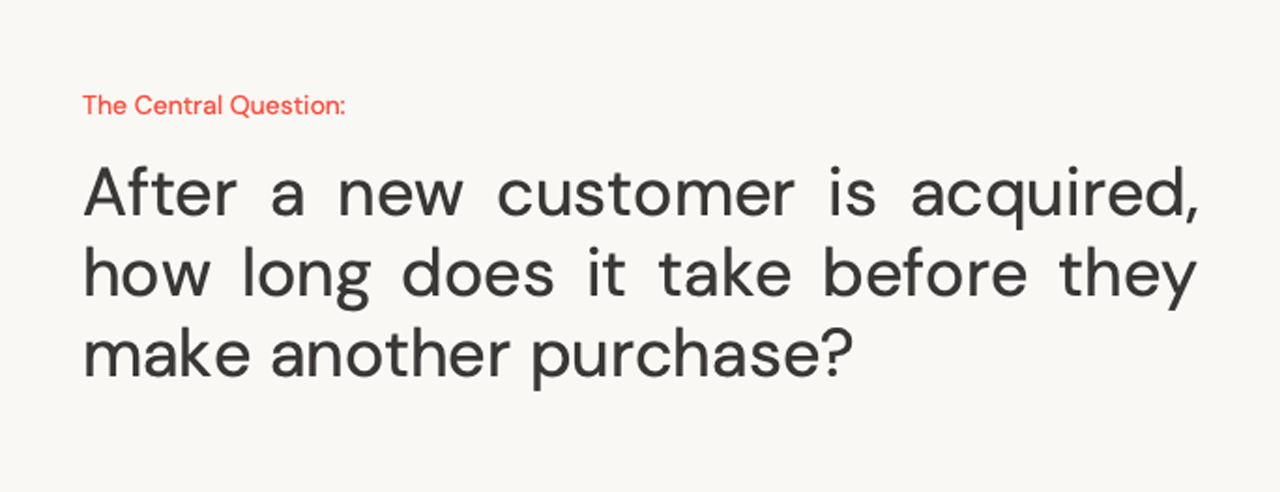
An established notion in the field of marketing analytics is that acquiring net new customers can be an expensive endeavor, hence companies would like to ensure that once a customer has been acquired, they would keep making repeat purchases. This blog post is centered around answering the central question:
Here are the steps to developing our solution:
- Data Ingestion using Fivetran
- Data Transformation using dbt
- Data Visualization using Tableau
Step 1. Data ingestion using Fivetran
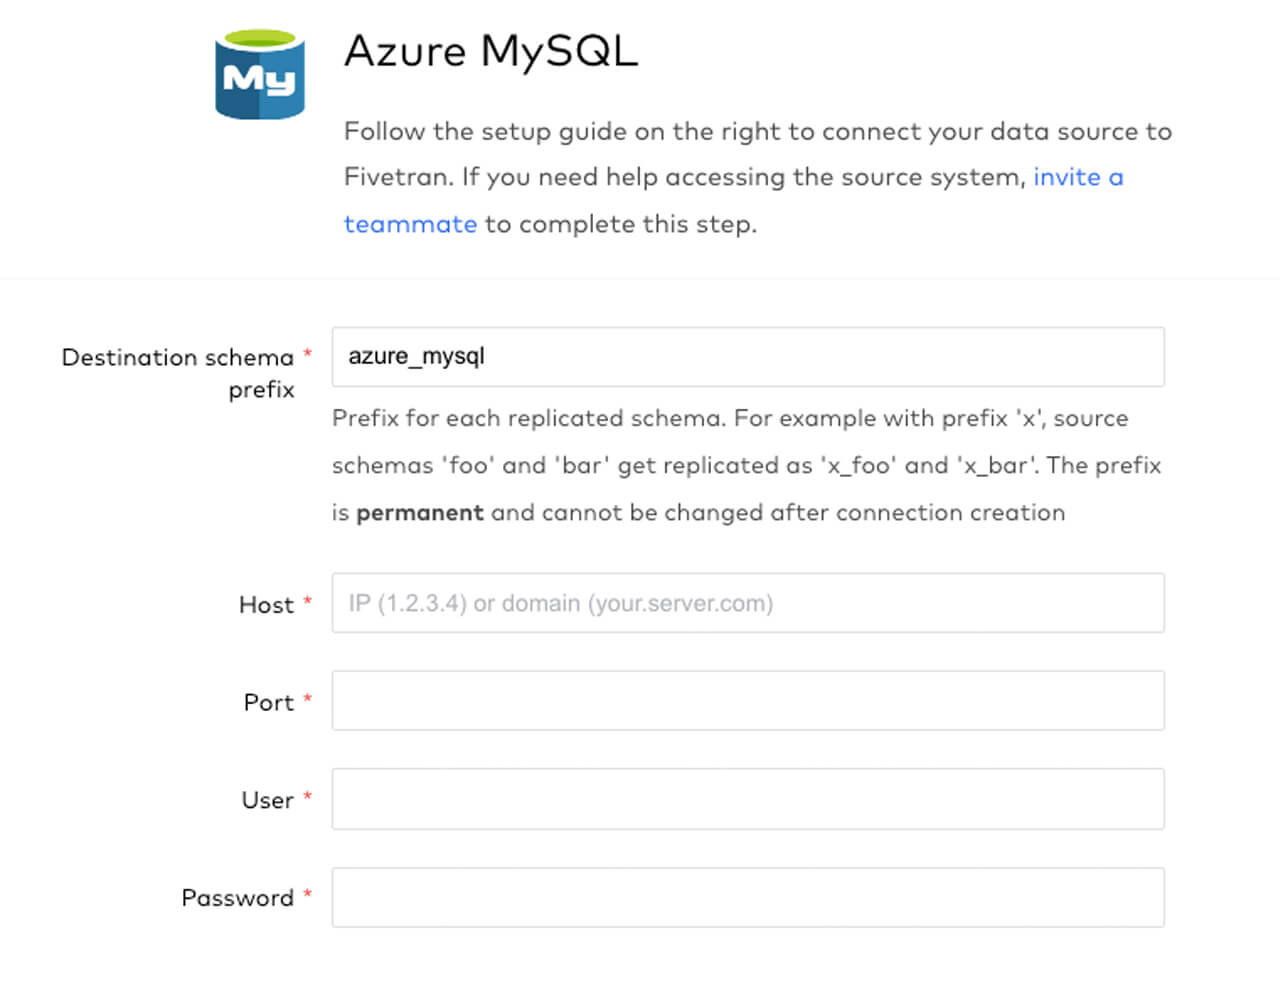
1.1: Connector configuration
In this preliminary step, we will create a new Azure MySQL connection in Fivetran to start ingesting our E-Commerce sales data from an Azure MySQL database table into Delta Lake. As indicated in the screenshot above, the setup is very easy to configure as you simply need to enter your connection parameters. The benefit of using Fivetran for data ingestion is that it automatically replicates and manages the exact schema and tables from your database source to the Delta Lake destination. Once the tables have been created in Delta, we will later use dbt to transform and model the data.
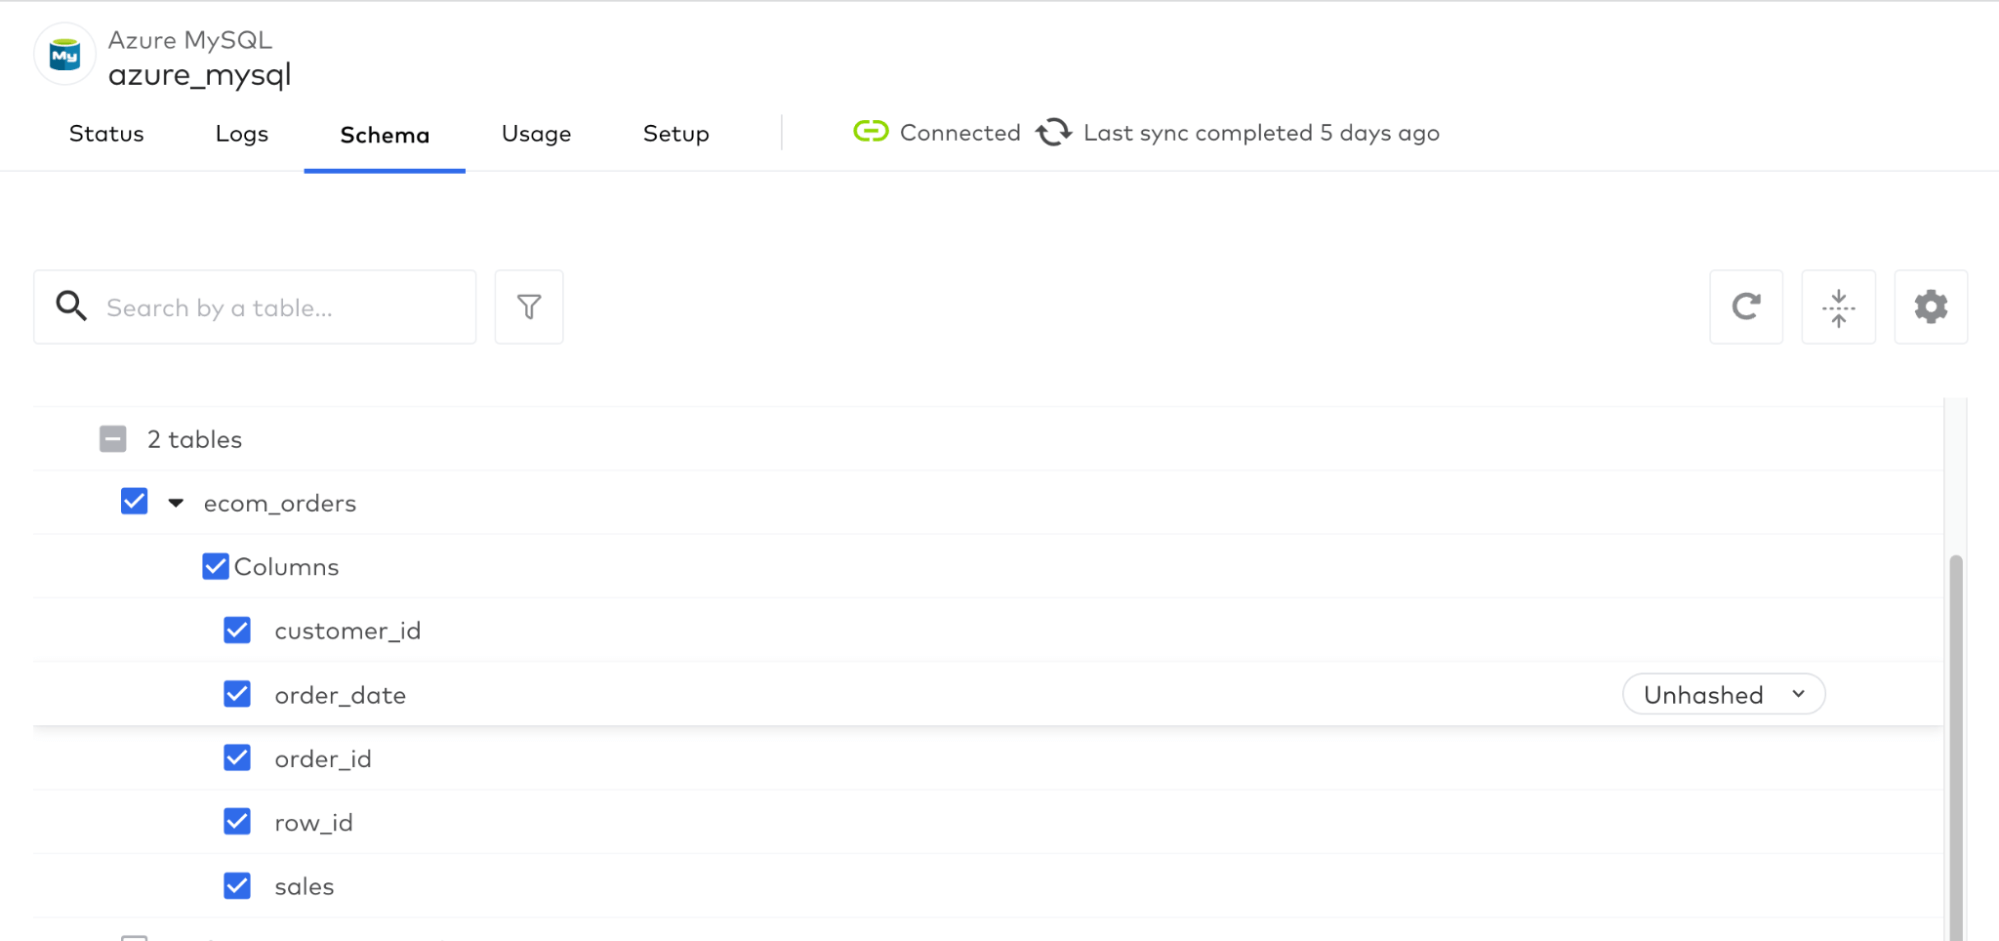
1.2: Source-to-Destination sync
Once this is configured, you then select which data objects to sync to Delta Lake, where each object will be saved as individual tables. Fivetran has an intuitive user interface that allows you to click which tables and columns to synchronize:
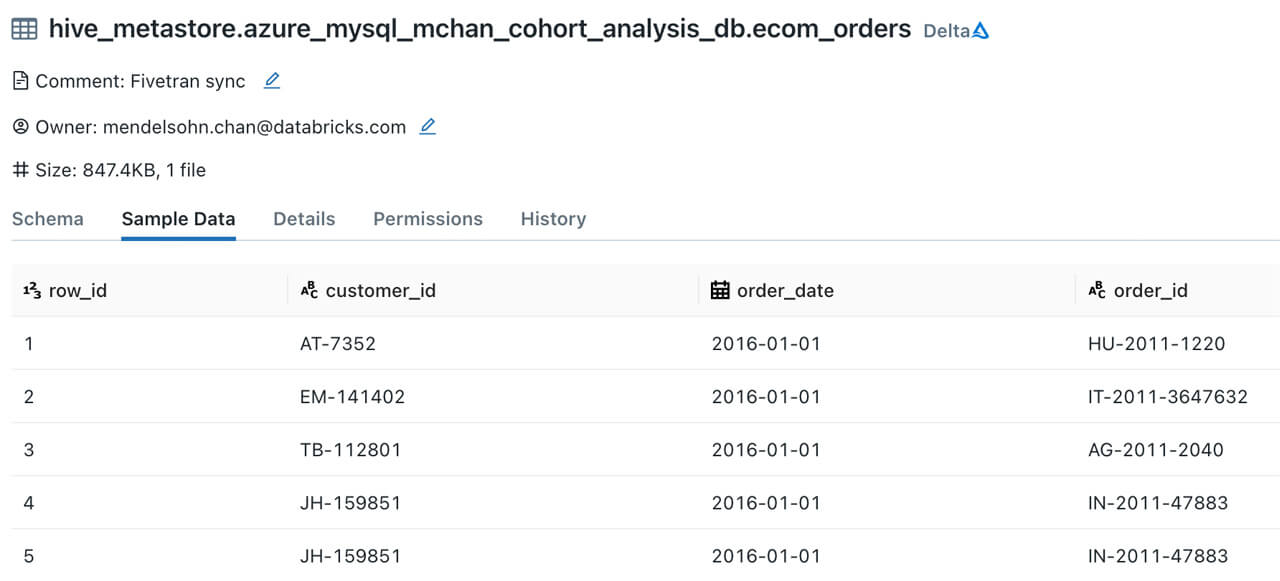
1.3: Verify data object creation in Databricks SQL
After triggering the initial historical sync, you can now head over to the Databricks SQL workspace and verify that the e-commerce sales table is now in Delta Lake:
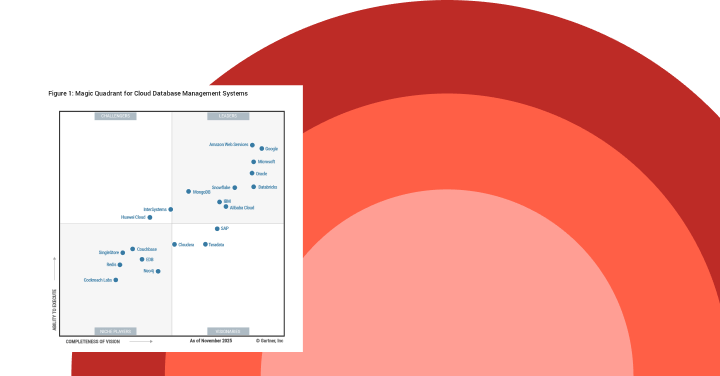
Gartner®: Databricks Cloud Database Leader
Step 2. Data transformation using dbt
Now that our ecom_orders table is in Delta Lake, we will use dbt to transform and shape our data for analysis. This tutorial uses Visual Studio Code to create the dbt model scripts, but you may use any text editor that you prefer.
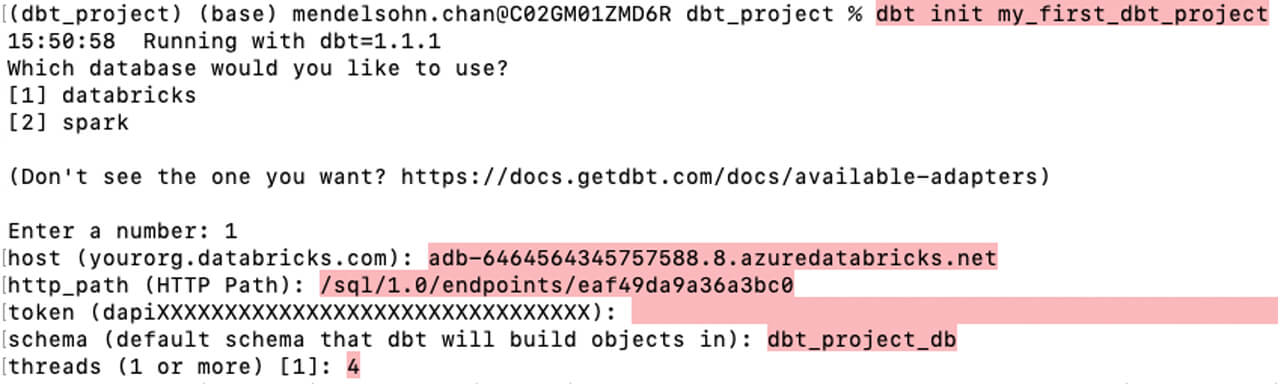
2.1: Project instantiation
Create a new dbt project and enter the Databricks SQL Warehouse configuration parameters when prompted:
- Enter the number 1 to select Databricks
- Server hostname of your Databricks SQL Warehouse
- HTTP path
- Personal access token
- Default schema name (this is where your tables and views will be stored in)
- Enter the number 4 when prompted for the number of threads
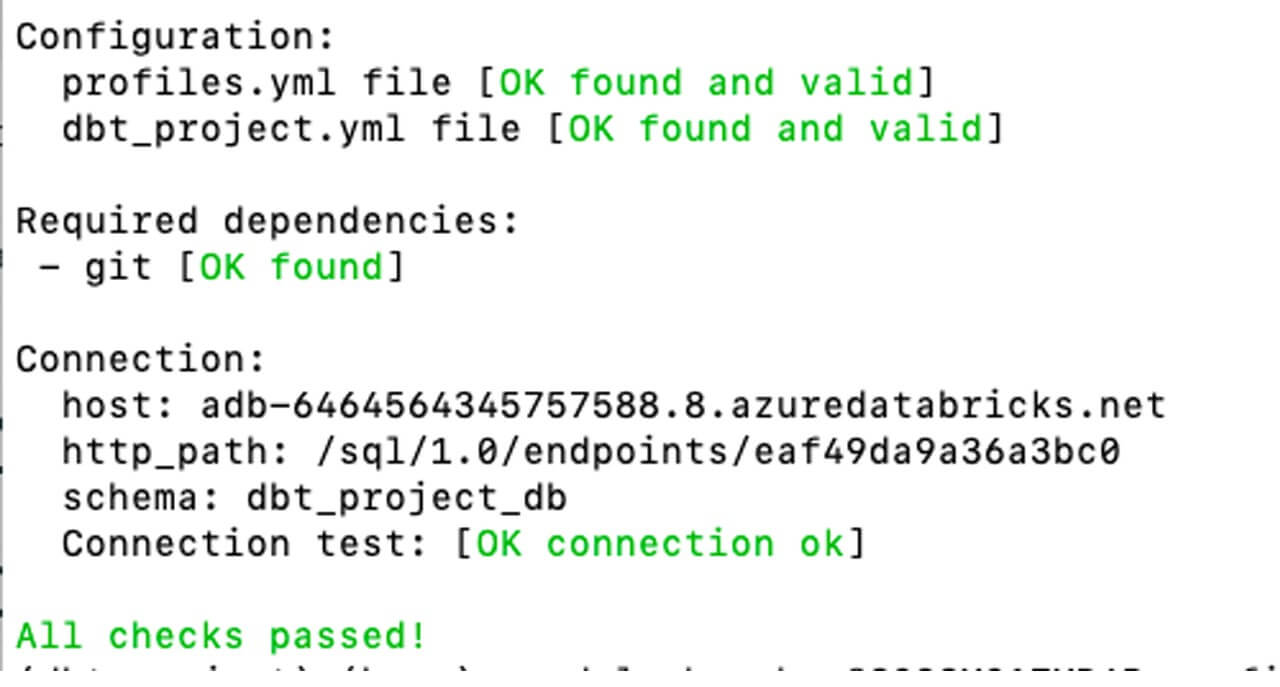
Once you have configured the profile you can test the connection using:
2.2: Data transformation and modeling
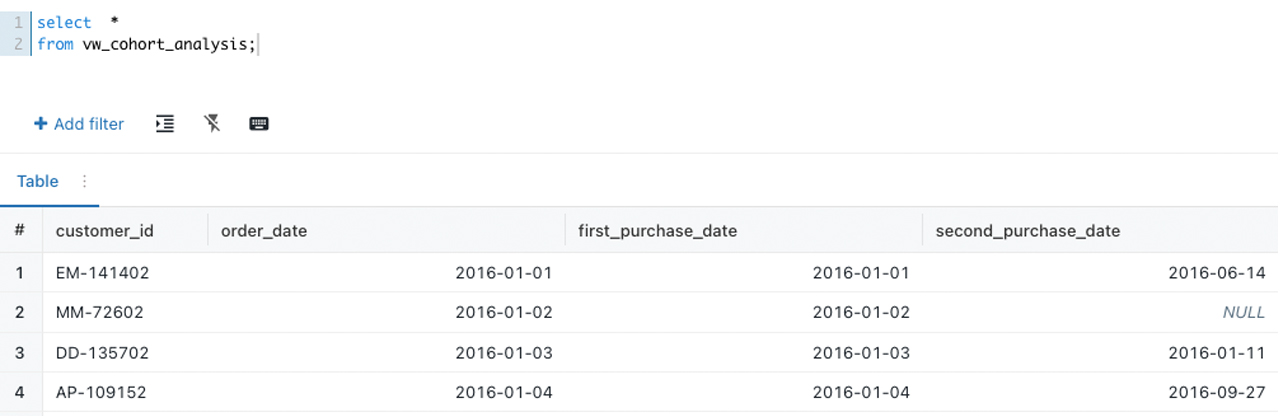
We now arrive at one of the most important steps in this tutorial, where we transform and reshape the transactional orders table to visualize cohort purchases over time. Within the project’s model filter, create a file named vw_cohort_analysis.sql using the SQL statement below.
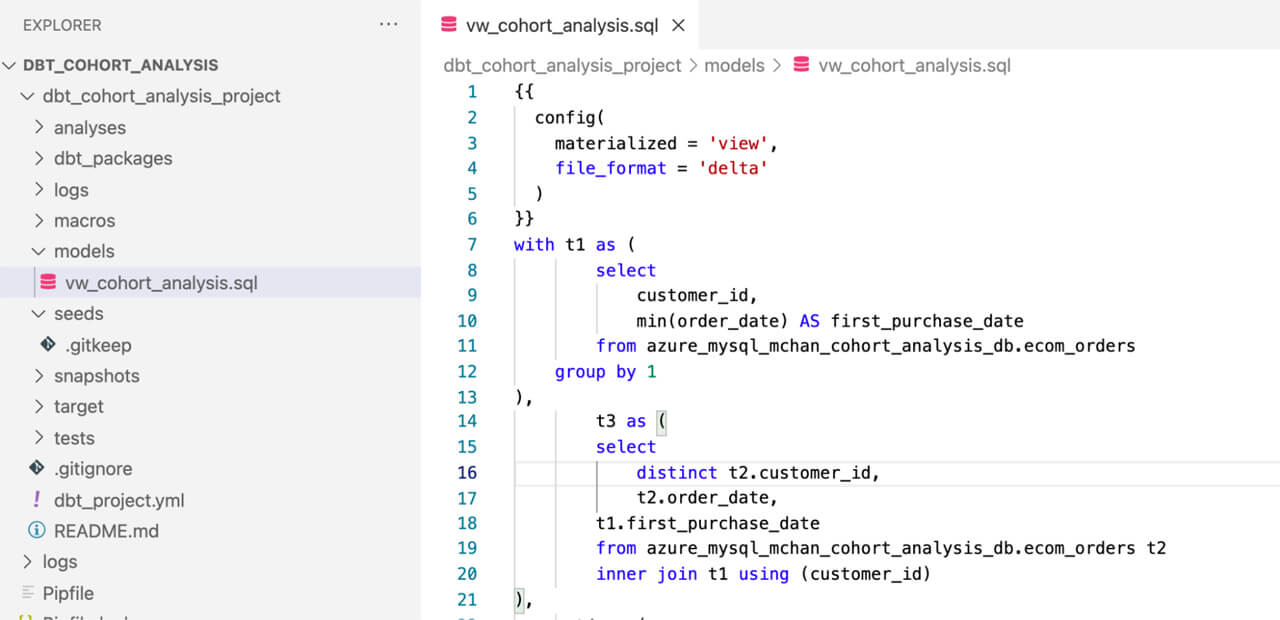
The code block below leverages data engineering best practices of modularity to build out the transformations step-by-step using Common Table Expressions (CTEs) to determine the first and second purchase dates for a particular customer. Advanced SQL techniques such as subqueries are also used in the transformation step below, which the Databricks Lakehouse also supports:
Now that your model is ready, you can deploy it to Databricks using the command below:
Navigate to the Databricks SQL Editor to examine the result of script we ran above:
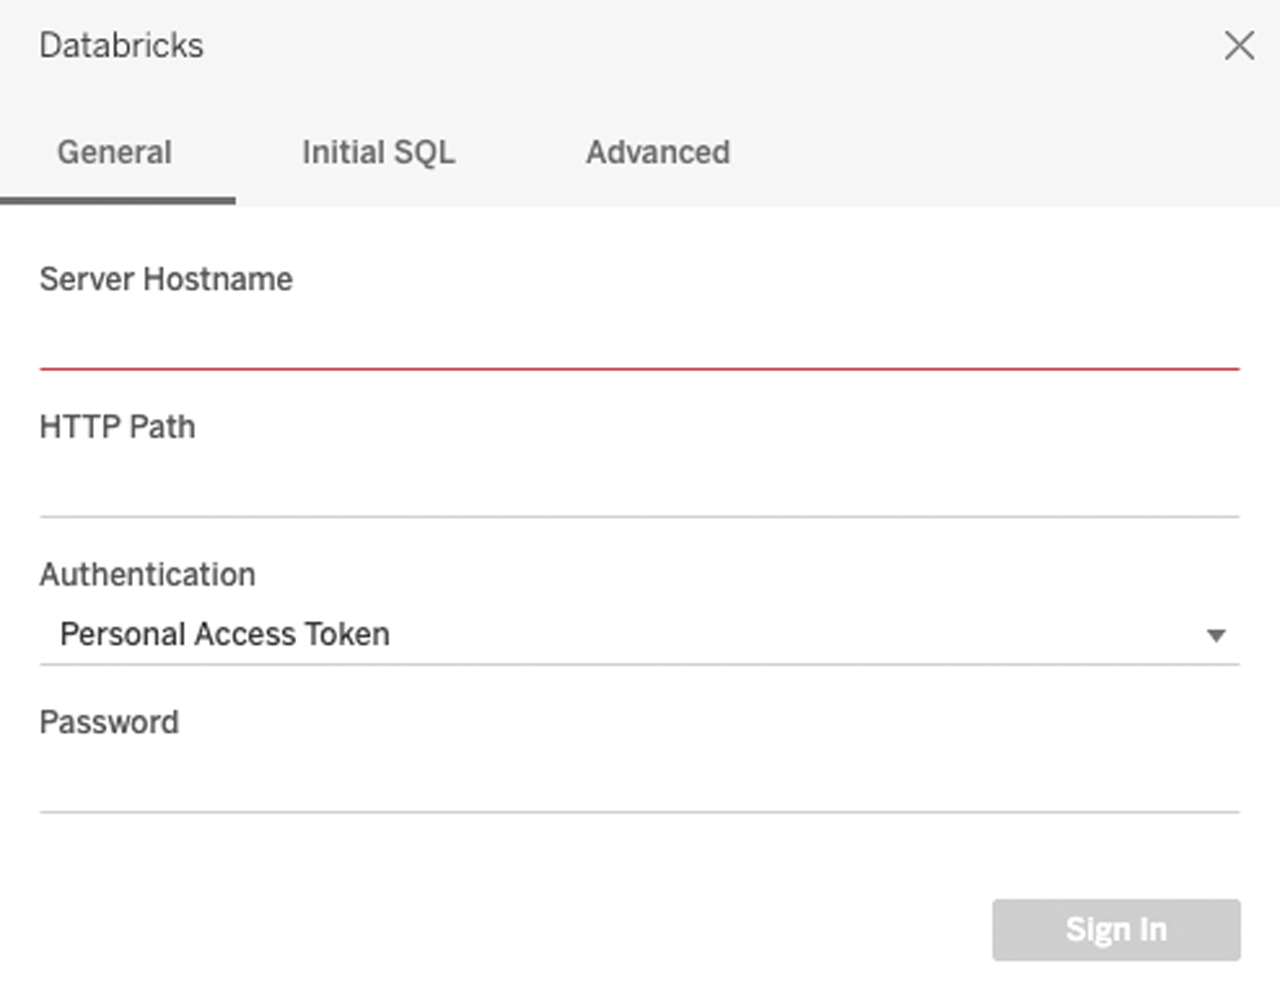
Step 3. Data visualization using Tableau
As a final step, it’s time to visualize our data and make it come to life! Databricks can easily integrate with Tableau and other BI tools through its native connector. Enter your corresponding SQL Warehouse connection parameters to start building the Cohort Analysis chart:
3.1: Building the heat map visualization
Follow the steps below to build out the visualization:
- Drag
[first_purchase_date]to rows, and set to quarter granularity - Drag
[quarters_to_repeat_purchase]to columns - Bring count distinct of
[customer_id]to the colors shelf - Set the color palette to sequential
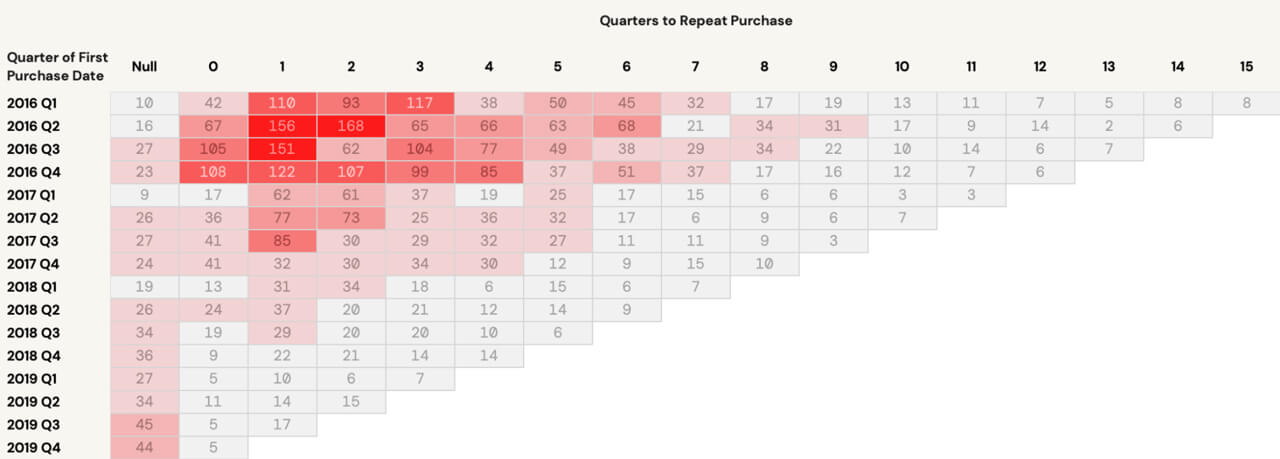
3.2: Analyzing the result
There are several key insights and takeaways to be derived from the visualization we have just developed:
- Among customers who first made a purchase in 2016 Q2, 168 customers took two full quarters until they made their second purchase
- NULL values would indicate lapsed customers - those that did not make a second purchase after the initial one. This is an opportunity to drill down further on these customers and understand their buying behavior
- Opportunities exist to shorten the gap between a customer’s first and second purchase through proactive marketing programs
Conclusion
Congratulations! After completing the steps above, you have just used Fivetran, dbt, and Tableau alongside the Databricks Lakehouse to build a powerful and practical marketing analytics solution that is seamlessly integrated. I hope you found this hands-on tutorial interesting and useful. Please feel free to message me if you have any questions, and stay on the lookout for more Databricks blog tutorials in the future.
Learn More
- Databricks and Fivetran: https://docs.databricks.com/integrations/ingestion/fivetran.html
- Databricks and dbt: https://docs.databricks.com/integrations/prep/dbt.html
- Databricks and Tableau: https://docs.databricks.com/integrations/bi/tableau.html