Enhanced Workflows UI reduces debugging time and boosts productivity

Data teams spend way too much time troubleshooting issues, applying patches, and restarting failed workloads. It's not uncommon for engineers to spend their entire day investigating and debugging their workloads.
We have now made it easier for data engineers to monitor and diagnose issues with their jobs. With these capabilities you know when a job run fails or takes an unusually long amount of time, understand the reason for the failure, and quickly remediate the root cause of the problem.
Visual job runs in a Timeline view
As a data engineer, the first step in optimizing a workload is understanding where time is spent. In a complex data workflow, it can feel like searching for a needle in a haystack. The new Timeline view displays job runs as horizontal bars on a timeline, showing task dependencies, durations, and statuses. It allows you to quickly pinpoint bottlenecks and areas of significant time expenditure in your DAG runs. By providing a comprehensive overview of how tasks intersect and where delays occur, the Timeline View helps streamline your processes and improve efficiency.
Run Events: See important information about job progress
Tracking the progress of workflow runs can often be opaque and cumbersome: reviewing detailed logs to gather essential troubleshooting information. We have built run events to visualize run progress directly within the product. With this feature, important and relevant events (such as compute startup and shutdown, users starting a run, retries, status changes, and notifications, etc.) are easy to find.
Better, simpler, and actionable errors
Navigating error messages can often be daunting, confusing, and time-consuming, especially when those messages are inconsistent and overly technical. We've simplified error codes and made them much more actionable. This helps you monitor unusual errors across jobs, filter runs by error codes, and resolve run failures much faster. These error descriptions make it easy for you to quickly understand what went wrong without sifting through complex logs and re-understanding the entire code. For example, UnauthorizedError for a run can tell that there is a permission issue accessing the resource for the job run.
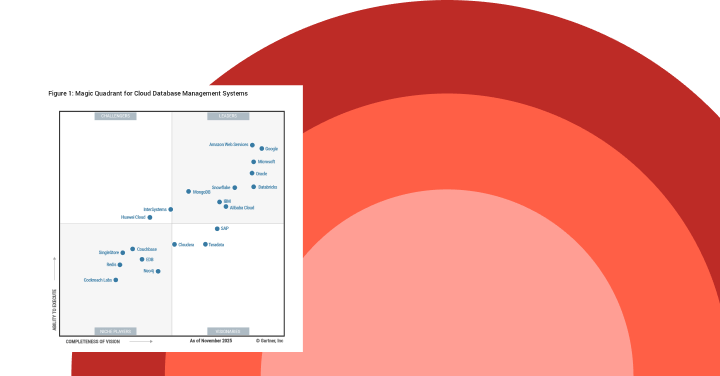
Gartner®: Databricks Cloud Database Leader
Databricks Assistant now integrated with Workflows
Databricks Assistant, our AI-powered Data Intelligence Engine, now diagnoses job failures and offers steps to fix and test the solution. You get context-aware help within Databricks Workflows, when and where you need it the most. This feature is supported for notebook tasks only but support for other task types will be added soon.
List the Python libraries used by your jobs
Conflicting versions, broken packages, and cryptic errors make debugging library issues a frustrating and time-consuming challenge. You can now list the Python libraries used by your task run including the version number used. This is specifically helpful as Python packages might already be pre-installed as part of your DBR image or during bootstrap actions on your compute cluster. This feature also highlights which of the above resulted in the package version used.
How to get started?
To get started with Databricks Workflows, see the quickstart guide. You can try these capabilities across Azure, AWS & GCP by simply clicking on the Workflows tab today.
What's Next
We will continue to expand on improving monitoring, alerting and managing capabilities. We are working on new ways to find the jobs you care about by improving searching & tagging capabilities. We'd also love to hear from you about your experience and any other features you'd like to see.