Improving Public Sector Decision Making With Simple, Automated Record Linking

What is data linking and why does it matter?
Availability of more, high quality data is a critical enabler for better decision making.
One way of acquiring more data is to connect what you have with what someone else has on the same topic. Imagine, for example, an auditor investigating a tax fraud. The auditor needs to build a complete picture of his subject, which will involve bringing data together from lots of different sources: tax history, land ownership, banking information, and employment details to name a few. With this information collected by different agencies, at different times, and in different systems, it is almost guaranteed that they will not easily be connected. Imagine a John Albert Smith, born 01-01-1960 in one system, with JA Smith, January 1960 in another. Add in typos and abbreviations in address (street or st, road or rd) data of different ages and it gets even harder.
Now scale this out to hundreds of thousands or millions of individuals - this is a pattern that repeats itself worldwide, in the public and private sectors. Solving this problem is the domain of data linking, also known as entity resolution. Making it easier to link different data sets is a direct driver of better data-driven decisions, through:
- Reduced effort - less manual work. Reducing the difficulty of access makes it easier to use more data in one's analysis, increasing the knowledge base a decision is made from.
- Increased timeliness - link data faster. Bringing data together quickly reduces the time it takes to make a decision.
- Better quality data and analysis. An analysis on incomplete data is an incomplete analysis. Minimizing missing data in an analysis improves analytical quality, allowing for better decisions.
In a previous post (https://www.databricks.com/blog/2023/01/12/better-data-better-decisions-public-sector-through-entity-resolution-part-1.html) we discussed how data linking is a foundational capability for better decisions. The National Data Strategy explicitly addresses improving the use of data in government, while the UK Government Data Quality Framework sets out an approach for how civil servants using data must ensure it is fit for purpose. To further show that data linking is recognized internationally is a challenge, the U.S. Federal Government has its Data Quality Framework and the European Medical Agency has published a draft Data Quality Framework, which both reference the importance of data quality, standards, and usability (reusability), all of which tie back to the ability to link data together.
Previously, we considered the whys and wherefores of data linking. This article will explore in more detail the how, focusing on an automated, unsupervised machine learning driven approach. Our experiences in the field have shown the need for easily accessible data linking tools which do not require deep expert knowledge to get started with. As such, we are delighted to announce the launch of Databricks Arc (Automatic Record Connector), a simple approach to data linking built on the open source project Splink. Arc does not require expert knowledge, labor intensive manual efforts or long duration projects to produce a linked set of data. Arc simplifies data linking and makes it accessible to a wide user base by leveraging Databricks, Spark, MLFlow, and Hyperopt to deliver a simple, user friendly, glass box, ML driven data linking solution.
How is data linking performed?
Recognizing the problem is just the beginning, however, solving the problem is a different matter. There are many approaches to data linking, ranging from open source projects such as Zingg or Splink to proprietary enterprise solutions. Modern approaches use machine learning (ML) to recognize patterns among the vast amounts of data present in the modern world, running on scalable compute architectures such as Spark. There are two different ML approaches; supervised and unsupervised.
In supervised learning, the ML models learn from explicit examples in the data - in the context of data linking, this would mean an explicit example of record A linking to record B, providing a pattern for the model to learn and apply to unlabeled records. The greatest challenge with supervised learning is finding enough of the right type of explicit examples, as these can only be reliably created by a human subject matter expert (SME). This is a slow and costly process - the SMEs able to label these examples typically have full time jobs, and pulling them away to work on labeling data with the required training is time consuming and costly. In most organizations, the largest part of their data estate won't have labeled samples that we can use for supervised learning.
Conversely, unsupervised learning approaches use the data as is, learning to link records without any explicit examples. Not requiring explicit examples makes it much easier to get started, and in many, if not most cases, it is going to be unavoidable - if every time two government departments want to share data a labor intensive manual data linking exercise is required, low effort cross government data sharing will continue to be a dream. However, the lack of explicit examples also makes evaluating unsupervised approaches hard - how do you define "good"?
Splink is an open source data linking project which uses an unsupervised machine learning approach, developed and maintained by the UK Ministry of Justice and in use across the world, with over 230,000 monthly downloads from PyPI. Splink provides a powerful and flexible API which allows users fine grained control over the training of the linkage model. However, that flexibility comes at the cost of complexity, with a certain degree of familiarity with data linking and the methods used as a requirement. This complexity makes it difficult to get started for users new to data linking, presenting a hurdle for any project depending on linking multiple data sets.
Powerful, simple and automated

Databricks Arc solves this complexity by presenting a minimal API requiring only a few arguments. The burden and complexity of choosing blocking rules, comparisons, and deterministic rules is removed from the user and automated, identifying the best set of parameters tuned to your data set - technical details of the implementation are at the bottom of this post.
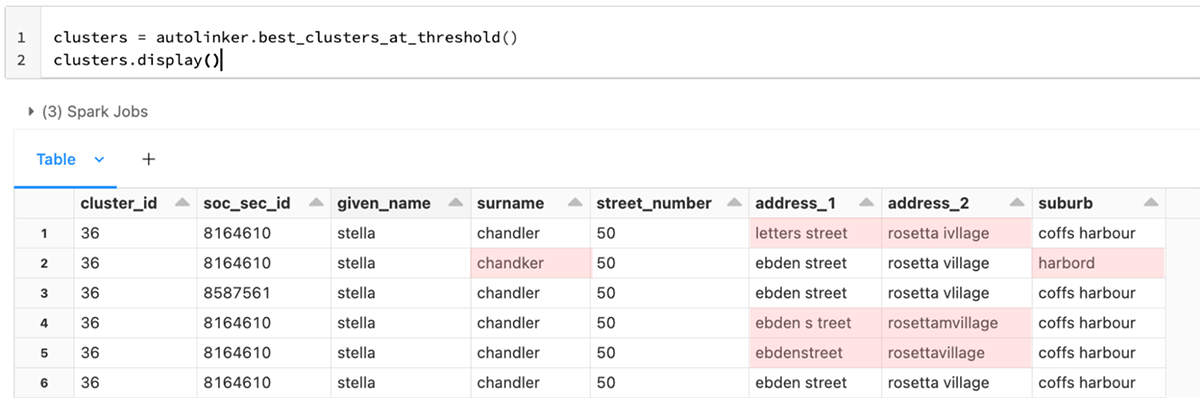
A picture is worth a thousand words; the below snippet shows how, in a few lines of code, Arc can run an experiment to de-duplicate an arbitrary data set.

These two examples show how in just 10 lines of code a linking model can be trained with zero subsequent human interaction, and furthermore that the links the model finds are sensible. The model has not linked apples with oranges, but has instead linked similar records that a human will agree are sensible linkages. The column cluster_id represents the predicted true identities, while soc_sec_id represents the actual identities that were not used during the training process - this is the "true" value which is so often absent in real world data to give an answer key. Strictly speaking, in this particular case the model has made an error - there are two distinct values for soc_sec_id in this cluster. This is simply a side effect of generating synthetic data.
Accuracy - to link, or not to link
The perennial challenge of data linking in the real world is accuracy - how do you know if you correctly identified every link? This is not the same as every link you have made being correct - you may have missed some. The only way to fully assess a linkage model is to have a reference data set, one where every record link is known in advance. This means we can then compare the predicted links from the model against the known links to calculate accuracy measures.
There are three common ways of measuring the accuracy of a linkage model: Precision, Recall and F1-score.
- Precision: what proportion of your predicted links are correct?
- Recall: what proportion of total links did your model find?
- F1-score: a blended metric of precision and recall which gives more weight to lower values. This means to achieve a high F1-score, a model must have good precision and recall, rather than excelling in one and middling in the other.
However, these metrics are only applicable when one has access to a set of labels showing the true links - in the vast majority of cases, these labels do not exist, and creating them is a labor intensive task. This poses a conundrum - we want to work without labels where possible to lower the cost of data linking, but without labels we can't objectively evaluate our linking models.
In order to evaluate how well Arc Autolinker does, we used FEBRL to create 3 synthetic data sets which vary by the number of rows and the number of duplicates. We also used 2 publicly available benchmark data sets, the North Carolina voters and the Music Brainz 20K data sets, curated by the University of Leipzig, to evaluate performance against real-world data.
| data set | Number of rows | Number of unique records | Duplicate rate |
|---|---|---|---|
| FEBRL 1 | 1000 | 500 | 50% |
| FEBRL 2 | 5,000 | 4,000 | 20% |
| FEBRL 3 | 5,000 | 2,000 | 60% |
| NC Voters | 99,836 | 98,392 | 1% |
| Music Brainz | 193,750 | 100,000 | 48% |
Table 1: Parameters of different data sets Arc was evaluated against. Number of unique records is calculated by counting the number of distinct record ID. The duplication rate is calculated as 1 - (number of unique records / number of rows), expressed as a percentage.
This data allows us to evaluate how well Arc performs across a variety of scenarios likely to arise in real-world use cases. For example, if 2 departments wish to share data on citizens, one would expect a high degree of overlap. Alternatively, if a purchasing office is looking to clean up their supplier information, there may be a much smaller number of duplicate entries.
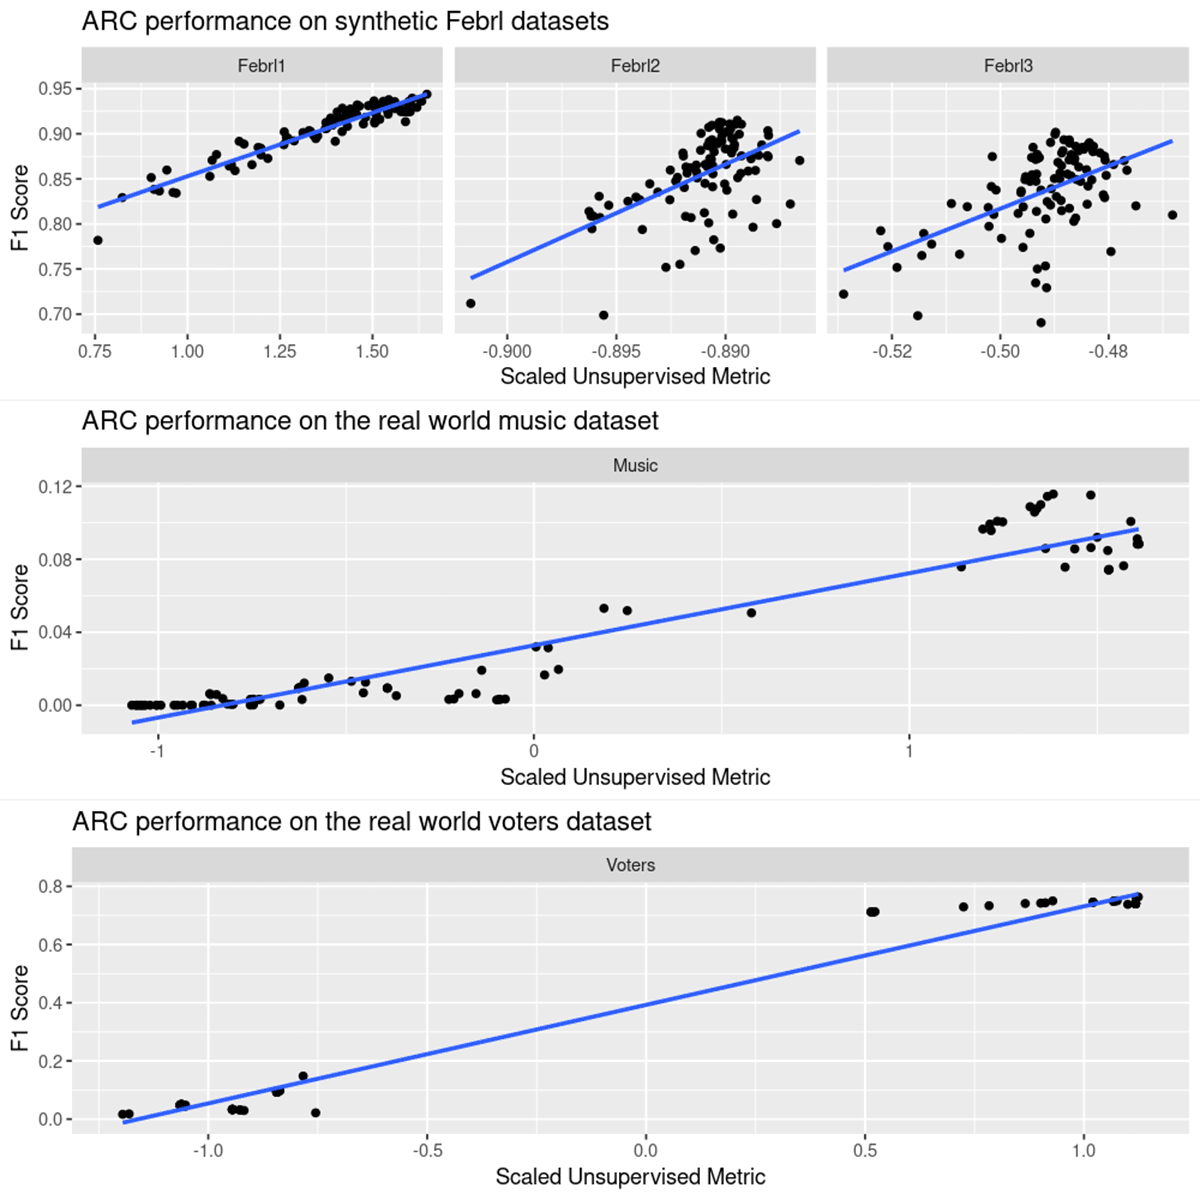
To overcome the lack of labels in most data sets, the manual effort to produce them, and still be able to tune models to find a strong baseline, we propose an unsupervised metric based on the information gain when splitting the data set into predicted clusters of duplicates. We tested our hypothesis by optimizing solely for our metric over a 100 runs for each data set above, and separately calculating the F1 score of the predictions, without including it in the optimization process.
The charts below show the relationship between our metric on the horizontal axis versus the empirical F1 score on the vertical axis. In all cases, we observe a positive correlation between the two, indicating that by increasing our metric of the predicted clusters through hyperparameter optimization will lead to a higher accuracy model. This allows the Arc Autolinker to arrive at a strong baseline model over time without the need to provide it with any labeled data.

These plots highlight the difference between synthetic and real world data. Synthetic data is ready for linking without any preprocessing, which makes it an excellent candidate to evaluate how well a linking tool can work in ideal circumstances. Note that in each case of the synthetic Febrl data sets there is a positive correlation between our unsupervised metric, which is applicable to all data sets, and the F1 score. This provides a strong data point to suggest that maximizing our metric in the absence of labeled data is a good proxy for correct data linking.
The real world plots show the same positive correlation, but with additional information. The Music data set is a very messy example, containing song titles from multiple languages. In reality, one would preprocess this data to ensure that like is compared with like - there is no point in comparing a title in Japanese with a title in English. However, even in the case of this messy data, Arc is still able to improve the quality of the linking with sufficient time. The Voters data set results is most likely a result of the low level of duplication (just 1%) within the data - a small change in model behavior results in a large change in model outcomes.
Together, these plots give confidence that when presented with a data set of unknown quality, Arc will be able to create a good linkage model with zero human effort. This positions Arc as an enabler for a variety of projects;
- Exploratory linking projects. By reducing the time to insight, projects which may have been deemed otherwise too complex become viable candidates for exploration - use Databricks Arc to determine viability before investing more valuable resources.
- Inter-departmental data sharing. Hindered by requiring a time investment from both sides to bring their expertise to bear, Arc can link with minimal intervention.
- Sensitive data sharing. Particularly within a government context, sharing data is highly sensitive to citizen privacy. However, increased departmental collaboration can lead to better citizen outcomes - the ability to link data sets and derive insights without needing to explicitly share the data can enable privacy sensitive data sharing.
- Citizen 360. Having a complete view of a citizen can massively improve the ability to properly assign benefits and properly design the benefits in the first place, leading to a government more in tune with their citizens.
- Finding links between data sets. A similar concept, this approach can also be used to join data together that does not share any common values by instead joining rows on record similarity. This can be achieved by enforcing comparisons between records from different sources.
You can get started with Arc today by downloading the solution accelerator directly from Github https://github.com/databricks-industry-solutions/auto-data-linkage in your Databricks workspace using repos. Arc is available on PyPI and can be installed with pip as many other Python packages.
Technical Appendix - how does Arc work?
For an in-depth overview of how Arc works, the metric we optimise for and how the optimisation is done please visit the documentation at https://databricks-industry-solutions.github.io/auto-data-linkage/.
Never miss a Databricks post
What's next?

Partners
February 22, 2024/4 min read
Strengthening Cyber Resilience through Efficient Data Management

Security and Trust
April 30, 2024/4 min read
