Nousot and Xcel Energy: Harnessing AI and Geospatial Intelligence for Natural Disaster Mitigation
Leveraging complex geographic data and AI to gain actionable insights using Databricks

Summary
- Understanding the complexities of geospatial Data
- Understanding the tools available in Databricks to help process geospatial Data
- Understanding the use of SQL Functions to democratize analysis of geospatial Data.
For utility companies such as Xcel Energy, wildfire mitigation is critical to protecting electrical infrastructure and minimizing the risk of utility-related ignition events. Typical mitigation strategies include vegetation management, grid hardening, risk assessments, public safety power shutoffs (PSPS), and leveraging advanced technologies like AI and sensors. A common challenge for this use case is the analysis of geospatial data in conjunction with the structured data available. Geospatial analysis involves studying data linked to specific locations on Earth, which is crucial for understanding various phenomena and interactions. Common examples include navigation apps, geotagged photos, and weather maps. However, working with geospatial data presents challenges regarding data privacy and location tracking, the need for complex software tools to handle various data formats (like GeoJSON and Shapefile), and the management of large datasets that can be computationally intensive. Additionally, challenges around accuracy and distortion can arise when merging data from different sources due to varying coordinate systems and measurement units. Despite these complexities, geospatial data plays a vital role in Xcel Energy’s strategy and operations. To fully leverage this vital data, a solution that overcomes these challenges is needed to enable effective integration and analysis of geospatial insights to address wildfire risks.
Use Case:
Wildfire Mitigation is a major initiative for Xcel Energy, with $500 million invested in wildfire mitigation activities since 2020. Xcel Energy has proposed a multifaceted strategy in its 2025-2027 Wildfire Mitigation Plan for Colorado, which includes system maintenance and upgrades, operational preventative measures, and broad situational awareness. These efforts rely on advanced geospatial and machine learning models to calculate wildfire risk metrics based on real-time weather forecasts. In collaboration with Nousot, Xcel Energy uses the Databricks Data Intelligence Platform and geospatial libraries like H3 indexing to transform complex weather data into simplified tabular outputs. This streamlined data supports efficient machine learning workflows and opens doors for generative AI solutions to contextualize and query geospatial information. These technologies enable faster, more accurate risk insights for meteorology and asset teams. The initiative increases the coverage of Xcel Energy’s power outage data analyzed by 3.3X, improves the accuracy by 4.1X, while reducing the processing time by 64X.
Using Databricks Spatial SQL and H3 functionality, we are able to process terabytes of geospatial weather data which enables faster high-impact decision-making. — Rob Foster, Principal Data Scientist, Xcel Energy
Performing Geospatial Analytics on the Databricks Platform
The power of performing geospatial analytics on the Databricks Platform is in the solution’s high performance, accuracy, and scalability. Xcel Energy can more efficiently process and analyze hundreds of large weather files—many containing multiple data bands—in under an hour. This feat would have been virtually impossible with legacy GIS systems. Such capability enables meteorology and asset management stakeholders to make timely, informed decisions to mitigate the risk of wildfires sparked by electrical assets. In 2025, Xcel Energy plans to leverage the tabular outputs of this process to train machine learning models that can help predict fire risks and power outages.
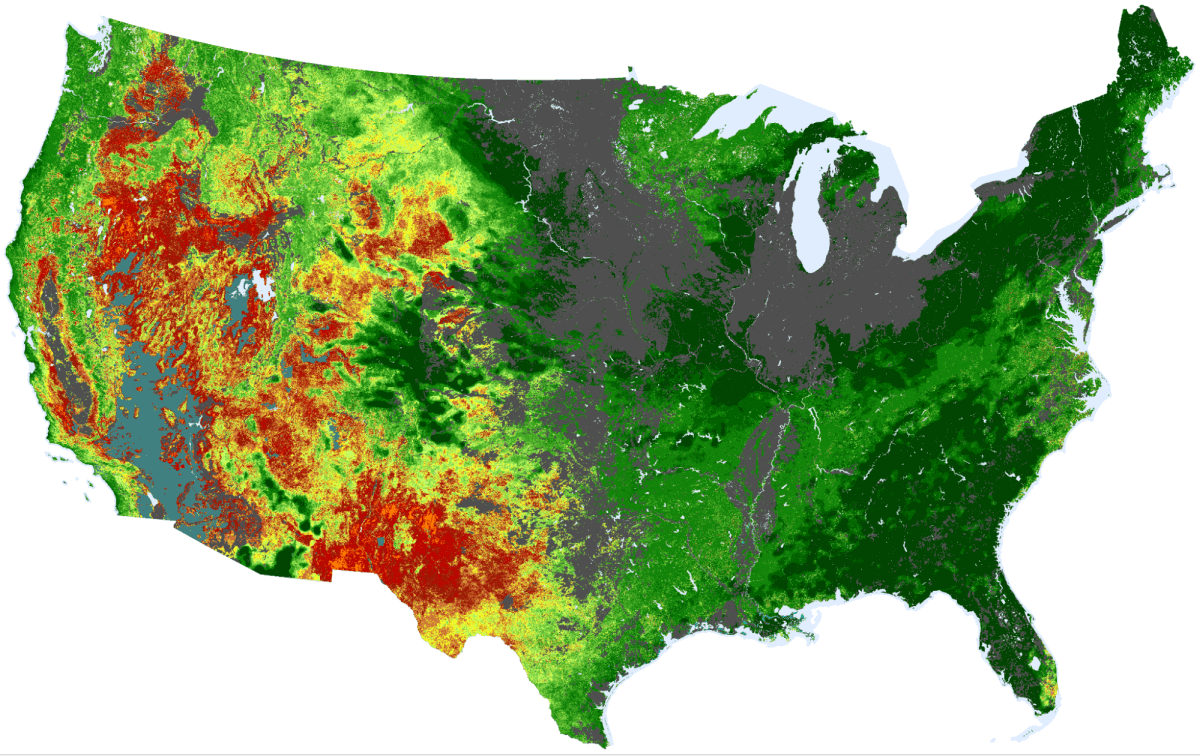
The following example demonstrates how the Databricks Platform supports geospatial analytics, using the Wildland Fire Potential Index (WFPI) as calculated by the United States Geological Survey (USGS). USGS releases 7 days of WFPI forecasts every day, which Xcel Energy uses as a part of their arithmetic and AI wildfire risk modeling. A map of WFPI measurements in the United States is shown in Figure 1 below. Yellow and red pixels indicate high fire risk, green shows lower risk, and grey/white areas represent unmeasured regions like agricultural land or snow. Considering the sensitive nature of Xcel Energy’s asset data, this example uses the State of Oregon as a proxy (Xcel Energy does not operate in Oregon).
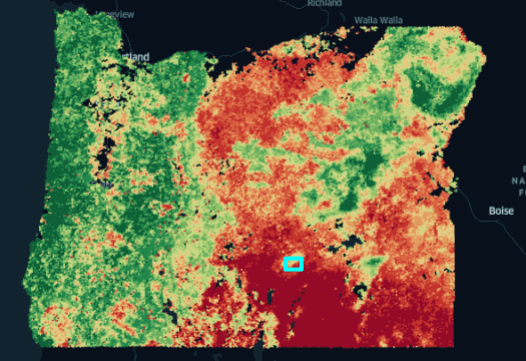
Geospatial image data often covers enormous areas, as shown in Figure 1. Performing H3 indexing at fine-grain resolutions over such a large area can be computationally expensive and often unnecessary; Xcel Energy only needs to process the geographic areas in which their assets reside. To address this, the next step is to “crop” the initial image and focus on areas of interest. We then calculate Wildland Fire Potential Index (WFPI) values for each H3 hexagon at the desired resolution within the area of interest. These H3 values can then be stored in Delta Live Table or visualized with Python libraries. Staying with theState of Oregon example, Figure 2 is a visualization of the cropped and indexed WFPI risk levels for a particular summer day. Note that the visualization can be generated in a Databricks Notebook or on Databricks Apps.
To illustrate the spatial resolution of H3, let’s zoom in on the area highlighted by the green box.
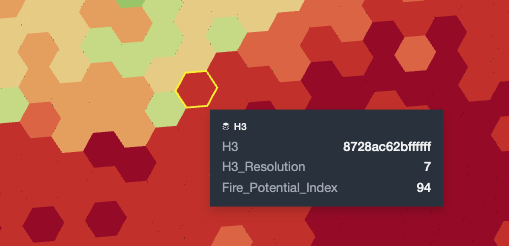
At H3 resolution 7, each hexagon covers approximately 5.16 square kilometers with a side length of about 1.41 km.
Many features of the visualization are customizable; in this example, the measured fire potential values are mapped to the same colors as the original image. Notice the sharp contrasts in color between bordering hexagons. These variations in WFPI highlight the accuracy enabled by the H3 indexing system.
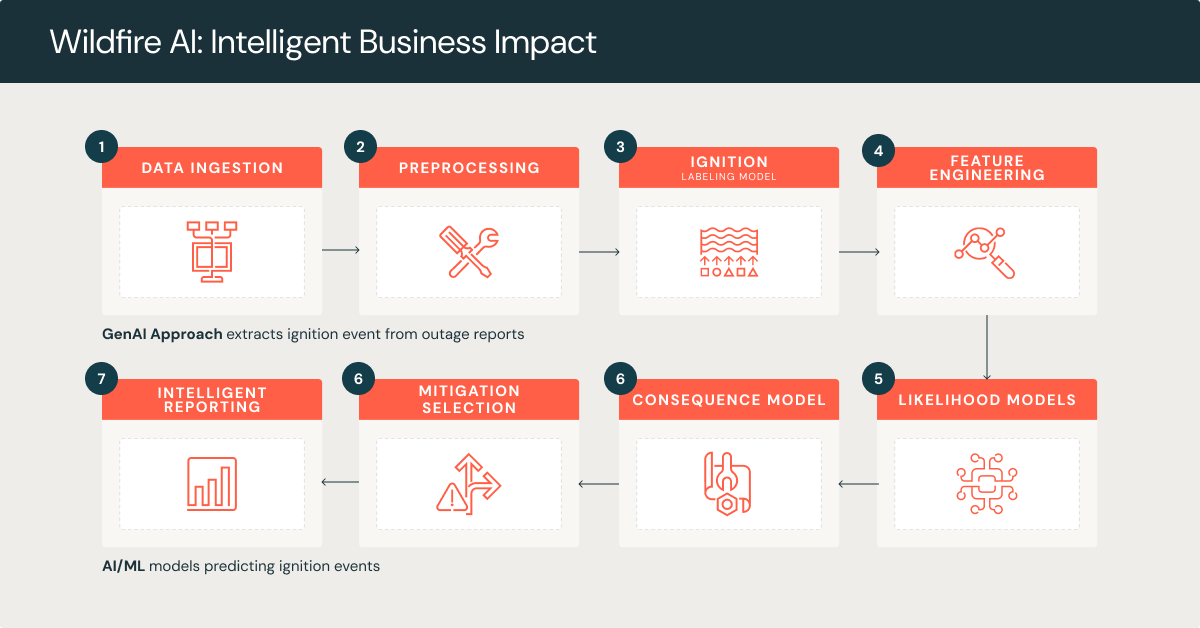
This same process is repeated for numerous weather forecasts and observations, along with multiple Xcel Energy asset types. The result is a collection of environmental and asset data, all in the same H3 domain. This data serves as a strong foundation for training ML and GenAI models. There are multiple areas of impact for Wildfire AI. These include using Large Language Models (LLMs) to review work order notes and outage reports from field crews to determine if an ignition event occurred, such as sparking. Sparking is typically due to contact with dry vegetation, downed wires, or malfunctioning equipment, and could possibly start fires. The LLMs are logged in MLflow for development, experiment tracking, and management. The LLMs can be productionized for real-time inference with Databricks Model Serving. This GenAI powered approach achieves 100% data completeness for outage events, a transformative improvement over the previous manual process, which captured only 30%—eliminating critical data gaps, saving staff hours, and enhancing operational capabilities. Several other AI/ML models are currently being designed to predict and simulate a range of scenarios, including predicting asset ignition likelihood.Interactions with H3 data using natural language are made easy with Databricks tools such as AI/BI Genie and AI Functions.
This approach easily scales on Databricks and unlocks AI by accelerating ML model delivery. — Cindy Hoffman, Director of Data Strategy, Xcel Energy
By integrating geospatial analytics on the Databricks Platform, Nousot equips Xcel Energy with the precision and scalability needed to proactively address wildfire risks. This solution empowers the company to quickly make informed, data-driven decisions based on localized risk analysis and efficient processing of complex weather data, enhancing both community safety and operational efficiency.
Databricks Solutions
The Databricks Data Intelligence Platform addresses the limitations of traditional data lakes in analytics and transactions, as well as the high costs and inflexibility of data warehouses. It is highly scalable for all data types, while supporting ACID transactions for reliability and data versioning and schema enforcement for consistency. Unity Catalog enhances data management by providing centralized control for access, auditing, and metadata management of both unstructured and structured data as well as ML and AI models. Additionally, the platform supports serverless compute for quick availability in SQL Warehouses and Notebooks, while the Photon Engine significantly boosts query performance. Databricks also facilitates flexible workload configurations and timely updates through its Workflows, Jobs, and Delta Live Tables, all integrated within Unity Catalog for improved visibility into data lineage and transformations.
The agentic AI playbook for the enterprise

Why Databricks for Geospatial Analysis?
Beyond its advanced data warehousing, versioning and governance capabilities, the Databricks Platform has several features that support geospatial workloads.
Spatial SQL
Currently in private preview, Databricks offers 70+ Spatial SQL functions for working with vector data such as coordinates, points, lines, and polygons. Access to the preview functions can be requested through this form. This new feature gives users easy access to complex geospatial data through the SQL data language, rather than requiring proprietary skillsets.
Grid Indexing
Geospatial grid indexing is a technique that organizes spatial data into a grid to improve performance and make it easier to retrieve. Among various indexing systems, H3 Global Grid Indexing is recommended for its ability to scale with high performance.
Developed and open-sourced by Uber, H3 models Earth's surface using a hierarchy of hexagonal grids (with some pentagons). It offers 16 resolution levels, with lower resolution numbers indicating larger geospatial areas. For example:
- Resolution 0: Average cell area of 4.3 million square kilometers
- Resolution 15: Average cell area of 0.895 square meters
This flexibility allows businesses to select the resolution granularity best suited to their needs. Databricks supports H3 Global Grid Indexing through H3 SQL functions, with over 30 functions currently available for streamlined geospatial data processing. Figure 5 illustrates an example of H3 indexing.

Advanced Geospatial Analysis
Rasters (such as weather forecast maps and satellite images) can be more difficult to work with. In a raster each pixel in the image represents a measurement over a specific geospatial area. For example, the ERA5 climatology dataset contains estimates of atmospheric, land, and oceanic climate variables at a spatial resolution of 30km per pixel. The NOAA Operational Model Archive and Distribution System (NOMADS) project enables sharing of data and models from multiple agencies and institutions, such as atmospheric forecasts in several different resolutions. Rasters from these agencies can contain multiple layers or bands of data in the same file, meaning that there might be separate bands for surface temperature, wind speed, and relative humidity, and be in a range of file formats including GeoTIFF, NetCDF, GRIB, and HDF4/5.
The databricks-mosaic library from Databricks Labs supports interaction with these complex file types as well as emerging raster support from a successor project, spatial-utils. Databricks-mosaic is a scalable geospatial extension for Apache Spark™ that brings together the capabilities of multiple open-source frameworks. The library has functions to read file and band metadata, extract the desired bands, and perform H3 indexing on rasters as well as take measurements (min, max, average, or median) of pixel values within each H3 cell. This process turns complex rasters into simple tabular data.
Support for common libraries
The Databricks Platform supports the use of many third party, Python-based geospatial libraries such as Shapely, GeoPandas, Rasterio, Sedona, and Xarray. A newer library gaining in popularity is CARTO’s free Analytics Toolbox for Databricks which combines native Databricks and Sedona and CARTO-provided functions. Esri’s GeoAnalytics Engine on Databricks is another powerful option, while visualizations are supported through libraries such as matplotlib, Plotly, Cartopy, and Kepler.gl. Using Databricks Dashboards and Databricks Apps to serve charts, tables, and maps provides a simple interface for users to glean insights and explore the data.
Databricks has been innovating at the forefront of data and AI since our inception. Through our ongoing investments, along with great partners such as Nousot, customers are using our Data Intelligence Platform to efficiently handle ingestion, processing, analysis, model building and serving needs as they scale spatial use cases. — Michael Johns, Geospatial Specialist Leader, Databricks
Expanding Use Cases
Whether working with point data or complex rasters, Databricks is an ideal platform for geospatial analytics. Xcel Energy’s wildfire mitigation use case is also applicable to other initiatives, such as weather forecasting, storm response, vegetation management, risk mitigation, demand forecasting, human mobility, infrastructure planning, retail operations, and precision farming.
Geospatial analytics on Databricks provides the opportunity to deliver quantifiable business value by capitalizing the solution assets and reducing traditional O&M costs. — Giacomo Listi, Energy & Utilities Practice Lead, Nousot
Databricks continues to invest in its geospatial capabilities, with support for dozens of geospatial SQL functions, H3 indexing, and powerful open-source libraries. These solutions provide a solid foundation for building GenAI and ML models with spatial context and awareness.
Nousot is a Databricks consulting partner focused on delivering AI and analytics use cases driven by business outcomes. Their Energy & Utilities practice tailors solutions to the specific challenges of this sector, delivering transformation across energy demand forecasting, rate case outcomes, AMI smart meter, GenAI customer engagement, wildfire mitigation, grid resilience, GenAI accelerated regulatory compliance, and more.
This blog post was jointly authored by Caleb Morrison & Giacomo Listi (Nousot), Cindy Hoffman & Rob Foster (Xcel Energy), and Michael Johns (Databricks).
If you have use cases you’d like to talk through, reach out to Nousot at [email protected]