Predict & Analyze marketing campaign effectiveness with SAP Datasphere and Databricks Data Intelligence Platform

This blog is authored by Sangeetha Krishnamoorthy, Cloud Architect at SAP
An effective campaign can help improve a company's revenue by increasing the sales of its products, clearing out more stock, bringing in more customers and also help introduce new products. Campaigns can include sales promotions, coupons, rebates, and seasonal discounts via offline or online channels.
Therefore, it's crucial to plan campaigns meticulously to ensure their effectiveness. It's equally important to analyze the impact of the campaigns on sales performance. A business can learn from past campaigns and improve its future sales promotions through efficient analysis.
Challenge and motivation:
Analyzing historical data and making accurate machine learning predictions for marketing campaigns can be quite challenging. Each campaign has its own unique set of metrics, making it necessary to adapt analytical approaches to fit each case. Furthermore, campaigns may utilize different data sources and platforms, resulting in a wide variety of data formats and structures. Consolidating data from these diverse sources into a unified dataset can be daunting, requiring thorough data integration and cleansing procedures. It's essential to ensure data accuracy, align time frames, and engineer relevant features for prediction, which further compounds the complexity of this analytical task.
Solution:
This is where a solution supporting the business data fabric architecture can make it all easier and more efficient.
SAP Datasphere is a comprehensive data service built on SAP BTP and is the foundation for a business data fabric architecture; an architecture that helps integrate business data from disjointed and siloed data sources with semantics and business logic preserved. With SAP Datasphere analytic models, data from these multiple sources can then be harmonized without the need for data duplication. One of the key metrics to evaluating campaign effectiveness is through the traffic metrics that includes clicks and impressions. It's important to have an efficient way to stream, collect and consolidate all the metrics around campaigns.
The Databricks Data Intelligence Platform enables organizations to effectively manage, utilize and access all their data and AI. The platform — built on the lakehouse architecture, with a unified governance layer across data and AI and a single unified query engine that spans ETL, SQL, machine learning and BI — combines the best elements of data lakes and data warehouses to help reduce costs and deliver faster data and AI initiatives. The cherry on top is the Unity Catalog which empowers organizations to efficiently manage their structured and unstructured data, machine learning models, notebooks, dashboards, and files across various clouds and platforms. Through Unity Catalog, data scientists, analysts, and engineers gain a secure platform for discovering, accessing, and collaborating on reliable data and AI assets. This integrated governance approach accelerates both data and AI initiatives, all while ensuring regulatory compliance in a streamlined manner.
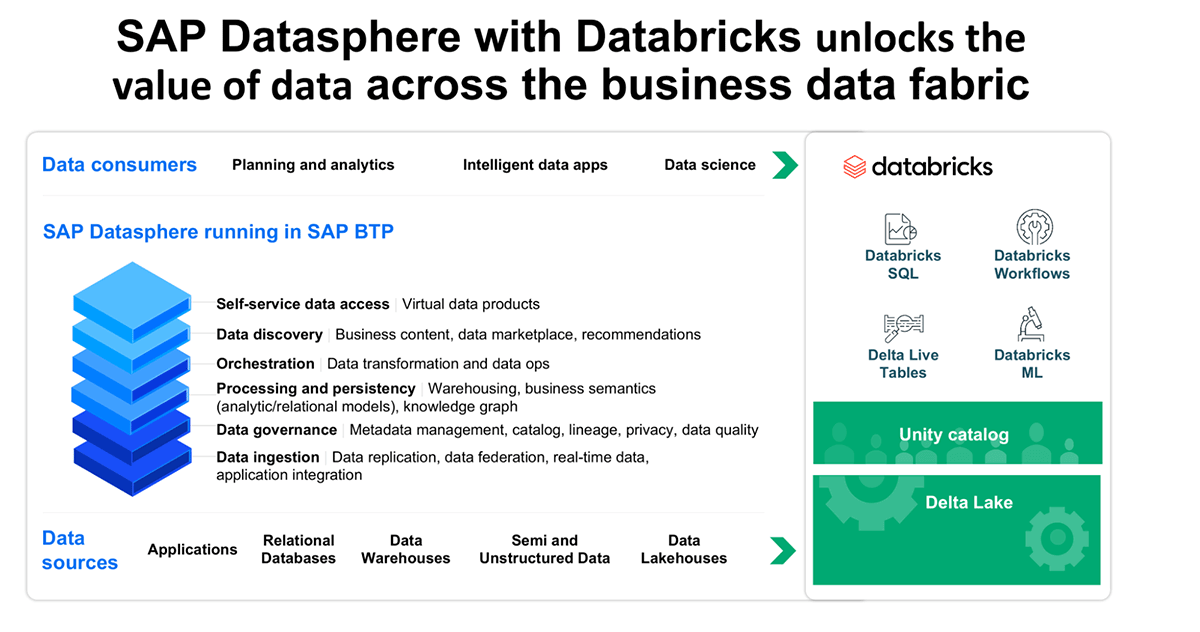
Together, SAP Datasphere and Databricks Platform help bring value to business data through advanced analytics, prediction and comparison of sales against campaign spend for the use case of 360o campaign analysis.
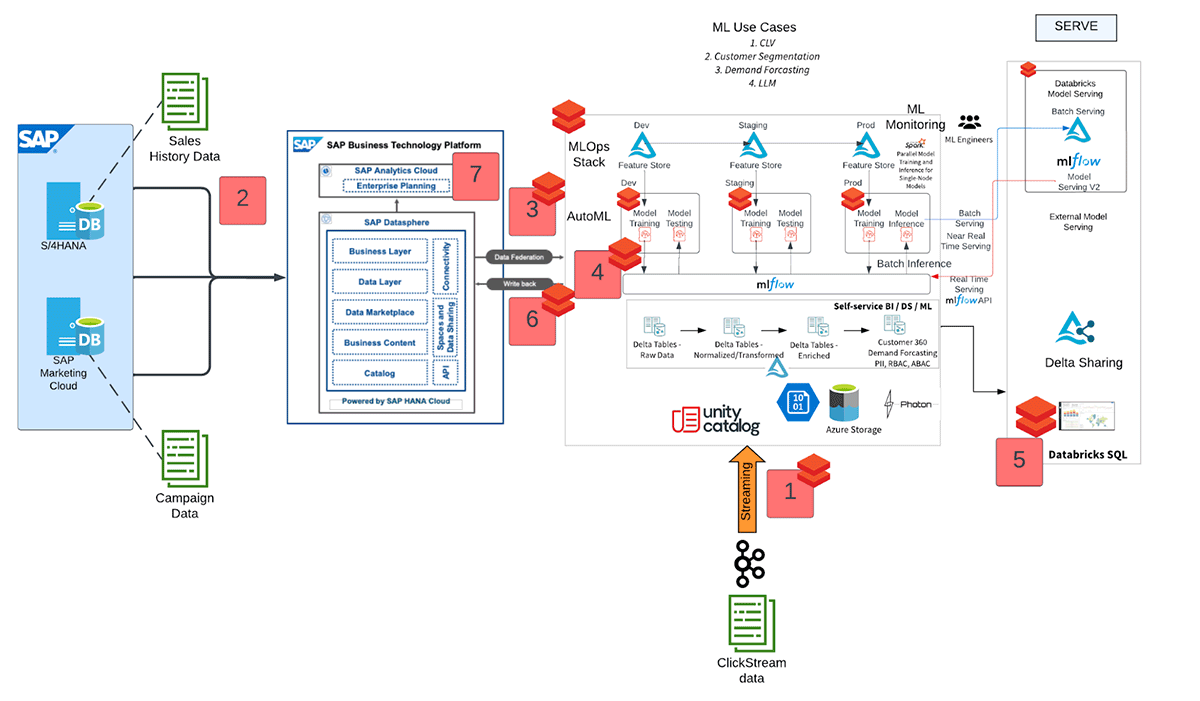
Three data sources fuel our campaign analysis:
a. Sales History Data: This data originates from SAP S/4HANA financials, providing a rich source of historical sales information.
b. Campaign Data: Sourced from the SAP Marketing Cloud system, this data offers insights into different marketing campaign strategies and outcomes.
c. Clickstream Data: Streaming in via Kafka into Databricks, clickstream data captures real-time user interactions, enhancing our analysis.
Let's explore the comprehensive analysis of campaign data spanning two distinct platforms. Leveraging the strengths of each platform, SAP Datasphere unifies data from various SAP systems. Databricks, with its powerful machine learning capabilities, predicts campaign effectiveness and Databricks SQL crafts insightful visualizations to enhance our understanding.
1. Stream and collect data clickstream data
Using structured streaming capabilities native to Databricks via Apache Spark™, has seamless integration with Apache Kafka. Using the Kafka connector we can stream Clickstream data into databricks in real-time for analysis. Here is the code snippet to connect and read from a Kafka topic and link to the detailed documentation.
2. Integrate and harmonize data with SAP Datasphere analytic models
SAP Datasphere's unified multi-dimensional analytic model helps virtually combine Sales and Campaign data from SAP sources with ClickStream from Databricks without duplication. For information on how to connect various SAP sources to SAP Datasphere that would help access sales history & campaign data, please refer here:
SAP Datasphere can federate the queries live against the source systems while giving flexibility to persist and snapshot the data on SAP Datasphere if needed. The analytic models created are deployed to create the runtime artifacts in SAP Datasphere and can be consumed by SAP Analytics Cloud and by Databricks Platform through SAP FedML.

3. Federate data using SAP FedML into Databricks Platform for Sales predictions
Using SAP FedML python library for Databricks, data can be federated into Databricks from SAP Datasphere for machine learning scenarios. This Python library (FedML) is installed from the PyPi repository. The biggest advantage is that the SAP FedML package has a native implementation for Databricks, with methods like "execute_query_pyspark('query')" that can execute SQL queries and return the fetched data as a PySpark DataFrame. Here is the code snippet, but for detailed steps, see the attached notebook.
4. AI on Databricks
AI Application Architecture
Databricks has several machine learning tools to help streamline and productionalize ML applications built on top of data sources such as SAP. The first tool utilized in our application is the feature engineering in Unity Catalog, which provides feature discoverability and reuse, enables feature lineage and mitigates online/offline skew when serving ML models in production
Additionally, our application utilizes the Databricks-managed version of MLflow to track model iterations and model metrics through Experiments. The Feature Engineering client supports registering the best model to the Model Registry in a "feature-aware" fashion, enabling the application to look up features at runtime. The Feature Engineering client also contains a batch scoring method that invokes the same preprocessing steps used during training prior to performing inference. All of these features work together to create robust ML applications that are easy to put into production and maintain. Databricks also integrates with Git repositories for end-to-end code and model management through MLOps best practices.
Feature and Model Details
The goal of our model is to predict unit sales based on currently running marketing campaigns and website traffic and to analyze the impact of the campaigns and traffic on sales. The initial data is derived from orders, clickstream website interactions, and marketing campaign data. All data was aggregated by day per item type and region so that forecasts could be performed at the daily level. The joined data is stored as a feature table, and a linear regression model is trained. This model was logged and tracked using MLflow and the Feature Store Engineering client. The model coefficients were extracted to analyze the impact of website traffic and marketing campaigns on sales.
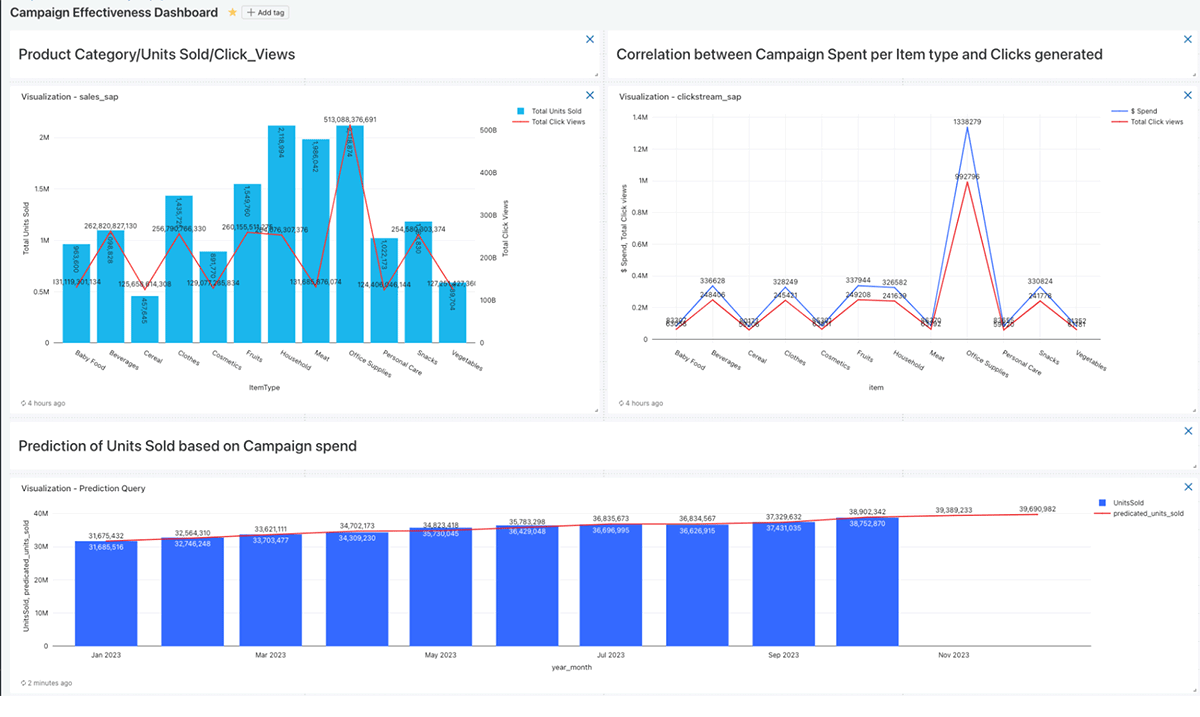
5. Visualization in Databricks SQL:
Databricks SQL stands out as a rapidly evolving data warehouse, featuring robust dashboard capabilities for versatile visualizations. Customize and create impressive dashboards, seamlessly transitioning from historical data analysis to predictive insights post ML analysis done in the previous step. We recently announced Lakeview Dashboards (blog), which offer many major advantages over previous-generation counterparts. They boast improved visualizations and renders up to 10 times faster. Lakeview is optimized for sharing and distribution, with consumers in the organization who may not have direct access to the Databricks. It simplifies design with a user-friendly interface and integrated datasets. Moreover, it unifies with the platform that provides built-in lineage information for enhanced governance and transparency.
6. Bring results back to SAP Datasphere and compare sales against campaign metrics and sales predictions.
SAP FedML also provides the ability to write the prediction results back to SAP Datasphere, where the results can be laid against the SAP historical sales data and SAP campaign master data seamlessly in the unified semantic model.
After the EDA and ML analysis has been performed on the dataframes. The inference result can be stored in SAP Datasphere.
Using create_table API call we can create a table in SAP Datasphere.
Write the prediction results to DS_SALES_PRED table in SAP Datasphere using insert_into_table method. Here, the ml_output_dataframe is the output of the ML model predictions. Check the detailed machine learning notebook for more information.
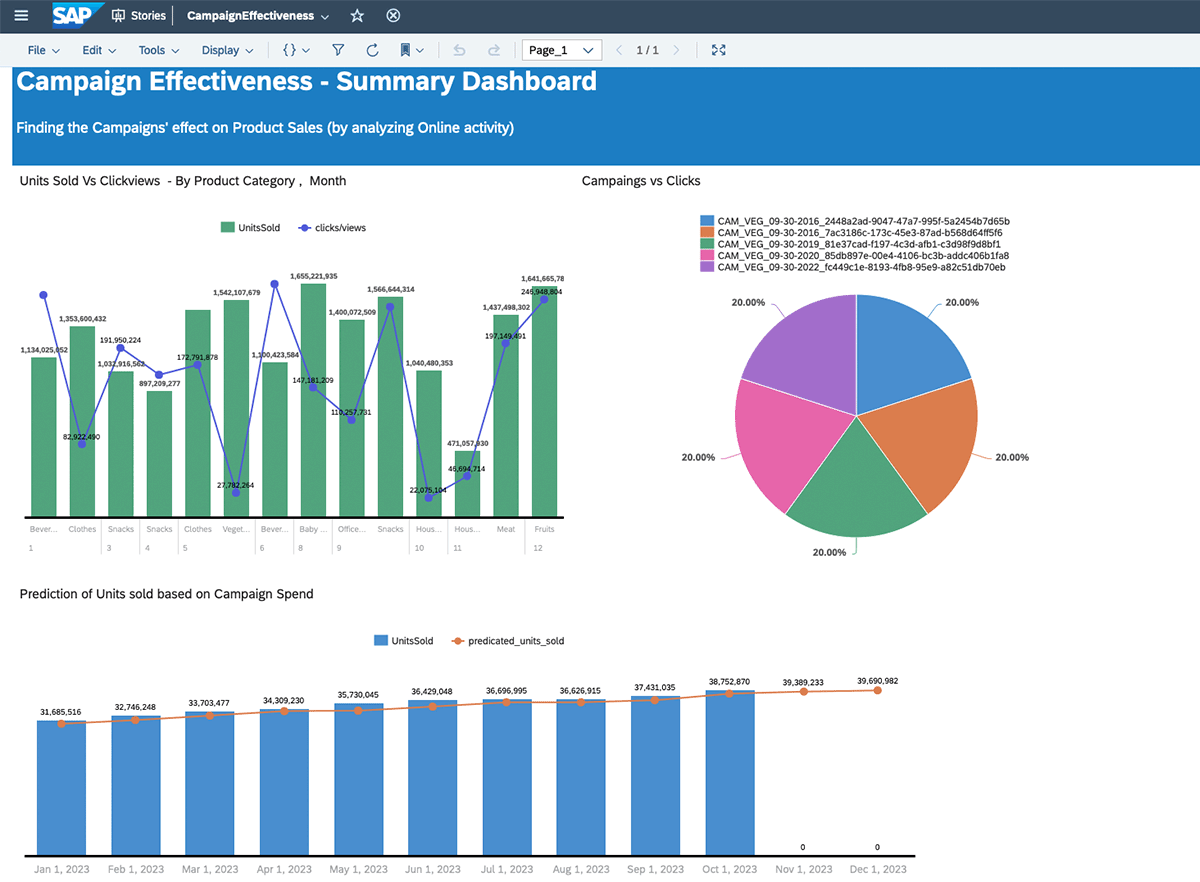
7. Visualization in SAP SAP Analytics Cloud
This unified model is exposed to the SAP Analytics Cloud, which helps business users perform efficient analytics through its powerful self-serve tool and visualization capabilities, infused with AI smart insights.
Summary:
The Databricks Data Intelligence Platform and SAP Datasphere complement each other and can work together to solve complex business problems. For instance, predicting and analyzing marketing campaign effectiveness is essential for businesses, and both platforms can assist in accomplishing it. SAP Datasphere can aggregate data from SAP's critical systems, such as SAP S/4HANA and SAP Marketing Cloud. While, the Databricks Platform can integrate with SAP Datasphere and ingest data from many different sources. Additionally, Databricks provides powerful tools for AI, which can help with predictive analytics for marketing campaign data. The in-depth analysis and visualization can be done using the Databricks SQL Lakeview dashboard.
Check the detailed Notebooks:
- Data engineering notebook: This notebook covers SAP FedML to bring in data from SAP Datasphere, and modeling of all the datasets Campaign+Sales+Clickstream
- Machine Learning notebook: This notebook covers Machine Learning on Databricks like MLflow, Feature Store ,model training/Prediction.
Never miss a Databricks post
What's next?

Product
November 21, 2024/3 min read
