What is a Pandas Dataframe?
Python pandas' primary two-dimensional labeled data structure with typed columns, offering powerful data manipulation, indexing, and analysis capabilities
- A pandas DataFrame is a two dimensional, table like data structure in Python that organizes data into labeled rows and columns for easier manipulation and analysis.
- DataFrames let users load data from many sources and reshape, clean and transform it using powerful indexing, filtering and formatting operations that feel familiar to spreadsheet users but are more flexible and programmable.
- Because pandas integrates tightly with Python and other data science libraries, DataFrames have become a core building block for data preparation, analysis and visualization workflows.

When it comes to data science, it's no exaggeration to say that you can transform the way your business works by using it to its full potential with pandas DataFrame. To do that, you'll need the right data structures. These will help you be as efficient as possible while you're manipulating and analyzing data.
One of the most useful data structures you can use for this purpose is pandas DataFrame.
pandas is an open-source library written for the Python programming language which provides fast and adaptable data structures and data analysis tools. Wes McKinney originally wrote this easy-to-use data manipulation tool. It's built on the NumPy package, and its key data structure is called the DataFrame.
If you're thinking, "Hang on. Slow down. What is pandas DataFrame?"', then don't worry, we'll go into depth about it shortly. For now, all you need to know is that pandas DataFrame is a user-friendly tool that's well-suited for use in fields that rely heavily on data. That includes scientific computing, machine learning and, as mentioned, data science.
We'll break down the specifics of pandas just below. Some of the topics we'll be covering include how to make a pandas DataFrame and how to start working with pandas DataFrame, as well as the advantages of using pandas DataFrame.
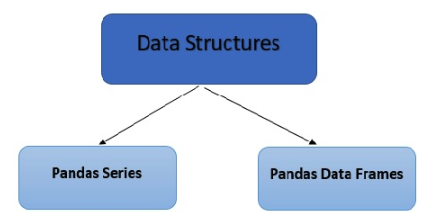
pandas provides two types of data structures:
- pandas DataFrame (2-dimensional)
- pandas Series (1-dimensional)
pandas uses data such as CSV or TSV files or a SQL (Structured Query Language) database and turns them into a Python object with rows and columns known as a DataFrame. These objects are quite similar to tables available in statistical software (e.g., Excel or SPSS). Similar to the way Excel works, pandas DataFrames allow you to store and manipulate tabular data in rows of observations and columns of variables, as well as to extract valuable information from the given data set.
You can execute pandas API on Apache Spark 3.2. This lets you evenly distribute pandas workloads, ensuring everything gets done the way it should.
Now that we've covered the two types of data structure that pandas offers, it's time to take a step back and look at what a pandas DataFrame actually is. We'll give you a quick definition, followed by a handy list of the types of inputs that the DataFrame can accept.
What is a pandas DataFrame?
pandas DataFrame is a way to represent and work with tabular data. It can be seen as a table that organizes data into rows and columns, making it a two-dimensional data structure. A DataFrame can be created from scratch, or you can use other data structures, like NumPy arrays.
When you use pandas DataFrame, you can import data in various formats and from various sources. You can, for example, import NumPy arrays, alongside being able to import pandas content.
Here are the main types of inputs accepted by a DataFrame:
- Dict of 1D ndarrays, lists, dicts or Series
- 2-D numpy.ndarray
- Structured or record ndarray
- A Series
- Another DataFrame
Common questions on how to work with pandas DataFrames
Knowing which structures pandas provides and what exactly a pandas DataFrame is doesn't necessarily equate to knowing everything about pandas DataFrames. That's why we're dedicating this section to answering some of the most common questions regarding how to go about working with pandas DataFrames.
If your questions aren't among the six we'll be answering below, please keep reading. We'll be covering several other topics, as well as answering a few more key questions before this article's over.
1. How to delete indices, rows or columns from a pandas DataFrame
Not all DataFrame columns (or rows or indices) are always equally necessary. In fact, sometimes, you'll find you need to delete a DataFrame object, which is why we'll show you how to do so.
We'll go through how to delete each one in turn, starting with indices. For these and all following examples in the article, we'll abbreviate "DataFrame" as "df" in our code, as it is a common practice.
While DataFrames always have some kind of index, making it difficult to delete indices completely, you can modify your index label or remove its name altogether. Removing the name works by executing the del df.index.name command.
You can also choose to reset your DataFrame index. This helps when you've got duplicate index values. All you need to do is reset your index, drop any duplicates and then reinstate the new, duplicate-free column index.
Deleting columns is a little easier. By using the drop ( ) method, you can take out columns. This requires you to enter the column labels you want to get rid of, so make sure you've got the right column names down before you issue the drop ( ) command. Also, if you set inplace to True, you'll be able to remove columns without reassigning the DataFrame.
Lastly, we'll show you how to delete DataFrame rows.
Executing df.drop_duplicates( ) will remove duplicate rows depending on the criteria you provide for row labels. You can also opt for the same .drop() method that also works for columns, except you'd be providing a row index to drop instead. Be sure to reset the index after you do this.
To specifically remove rows with missing values, you can use DataFrame.dropna(axis=0, how='any', thresh=None, subset=None, inplace=False). This will automatically take out any rows with null values. You can also adjust the parameters of the function to determine whether missing values get removed in a particular selection of data.
If you're looking to replace the null values with specific values, you can use the .fillna() command instead of deleting them with .dropna().
2. How to rename the index or columns of a pandas DataFrame
Renaming indices and columns is a lot easier and more straightforward than deleting them. To rename these objects, all you have to do is use the .rename( ) method and fill in the index (or columns) you want to give a new value.
If you change the inplace argument to False in the renaming task, the DataFrame won't be reassigned when changing the names of the columns.
3. How to format the data in your pandas DataFrame
Most of the time, DataFrame users need to edit, change and format the values in their DataFrames. We're going to look at some of the most important strategies to know about if that's what you're looking to do.
When you want to replace every instance of a string, you can use the .replace() command, filling in the gaps in the format of (value you're changing, value you're changing it to).
The program then automatically substitutes every instance of the string or value you're looking to change for the item you're changing it to.
Another type of formatting you might need is the ability to take away parts of strings that you don't need. The map ( ) command will apply your chosen lambda function to each element in that column if you use it on the "result" column.
You can also split column text into multiple rows, though this is a little more complicated, so please bear with us as we walk you through a brief tutorial.
First, you've got to identify the rows that are too long so that you know which ones you're looking to split. Once you've got them down, you'll want to take the column that they're in and strings on a space. The next step is to take the values that will be split across rows and put them into a Series object.
If you've got NaN values in your Series, don't worry, you're heading in the right direction. Simply stack the Series, and you'll guarantee the final copy of the Series won't have any unwanted NaN values.
To get the stacked Series into the desired format, you'll have to drop the level so it lines up with the DataFrame. After that, it's just a matter of transforming your Series to a DataFrame, putting it back into the DataFrame it came from and then deleting the faulty column from your original DataFrame. The last step (deleting the column) prevents you from generating duplicates.
The last kind of formatting you can apply to the data in your DataFrame takes the form of applying a function to the DataFrame's rows or columns.
Start by selecting the row you'd like to work on using .loc[ ] or .iloc[ ].But since we're in DataFrame, you'd more specifically be using df.loc and df.iloc. Then, once you've got the right rows picked out, you can use apply ( ) to, as it happens, apply functionalities like doubler to either a row or a column.
4. How to create an empty DataFrame
Creating an empty DataFrame boils down to using the pandas DataFrame() function.
If you're hoping to initialize the DataFrame with NaNs, you can simply opt for using numpy.nan, which has a type float. This means the data values in your new DataFrame will also be of type float by default. By entering the dtype attribute and then filling in the type you're looking for, you can get around this default setting.
The DataFrame ( ) function relies on you passing the data you're looking to put into your DataFrame, as in, your indices and columns. This data can have as many different types as you need. Plus, as we've established, you can always force its data type to be what you want it to be using the dtype attribute.
You can choose to specify the axis labels or index that your empty DataFrame will use. If you don't do this, the pandas DataFrame will automatically construct them for you using common sense rules.
5. Does pandas recognize dates when importing data?
In principle, yes, it does. In practice, it's a little more complicated.
pandas can pick up on the fact that dates are being entered, but it works best when you give it a small nudge in the right direction. To be more specific, you'll want to add in the parse_dates argument whenever you're importing data from a CSV file or something similar. For a CSV file, that would look something like this:
pd.read_csv('yourFile', parse_dates=True)
This approach works best for dates that use numeric formatting. However, not all dates take this type of format.
For unusual date formats, or for ones that DataFrame has some trouble recognizing, you'll want to create your own parsers. These might take the form of a lambda function that uses a format string to control the date and time input recognition.
Whichever way you choose to go about giving pandas that nudge, it will recognize dates and times after you're done. That means that with minimal input on your end, you can instruct your DataFrame to pick up on any date-based information you feed it.
6. When, why and how you should reshape your pandas DataFrame
Data analysis is one of the most important uses of pandas DataFrame. That's why it's important to be able to shape and reshape your DataFrame, so the structure you shape it into is ideally suited for your data analysis needs.
So, the answer to the question "When should I reshape my DataFrame?" is: when its current format isn't useful to the data analysis you plan to conduct and when you're not looking to create new columns or rows for that purpose. And the reason why you should reshape it is that you're looking for the shape that's the best fit for your data analysis.
That leaves just one question: "How?"
You can choose to pivot or stack. You can also use the "unstacking and melting" method. We'll break down in detail how each one of those three approaches works and how you can go about using them for reshaping your DataFrame.
Reshaping your DataFrame with the Pivot method
Let's start by looking at the pivot option. This creates a new table from your original one, allowing you to shape the new copy to look just the way you want it. Using this function relies on passing three arguments.
First, there are the values. This argument is the point at which you choose the values of the original DataFrame that are going to be incorporated into the new one, so you can choose what to include and what you'd rather leave out.
Next, you'll pass columns. Any that you do pass are going to become columns in your final table.
Lastly, you've got to choose which indices you want to use in your new table.
It's important to be specific about what data you want to incorporate in your resulting table. You can't, for example, include rows that contain duplicate values in your specified columns because an error message will appear. Another example is that you'll pivot by multiple columns if you don't pick out exactly which values you want to include in the final table.
We'll move on to considering stacking next.
Reshaping your DataFrame with the Stacking method
Stacking DataFrames makes them taller. You might recognize that fact. We touched on stacking in the third question during the walkthrough of how to format the data in your DataFrame.
The technical explanation is that you're moving the innermost column index, changing it into the innermost row index instead. This gets you a DataFrame that's got a new index with a new level of row labels, which will be located at the innermost level.
Now it's time to consider how to unstack. As you might imagine, it's the inverse process of stacking; where stacking moves the innermost column index, unstacking moves the innermost row index. So, when you unstack, you're moving the innermost row index so it can be used as the innermost column index instead. Unstacking is used in conjunction with melting, so we'll look at that next.
Reshaping your DataFrame with the Melting method
Melting is ideal for times when your DataFrame uses one or more columns as identifier variables, with the rest of the columns being measured variables. In those instances, melting basically lets you make your DataFrame longer, not wider.
You'll essentially un-pivot your measured variables to the row axis so that the melt can make sure the measured variables are placed in the height of the DataFrame rather than its width. The final product will contain two columns: one for variables and one for values.
How to use pandas DataFrames
You can use DataFrames in much the same way you'd use Excel spreadsheets, and pandas DataFrame is no exception.
Essentially, you can use pandas DataFrame as a data structure. It can also be used to process and analyze data, just like a spreadsheet can be.
When you've got data you need to read or manipulate, pandas is a useful tool to help you accomplish that goal. We've already described how to input data into pandas DataFrame, and since pandas is compatible with a lot of different types of data, you can import lots of types of data into it. This ensures you can work with your information no matter what format it takes.
You can then use the formatting processes we've outlined above to transform your data into the format you need it to be in. You can transform the data you've already got, shaping it into a more usable format that's better suited for your needs.
Since pandas was designed specifically to be used with Python, you can use the two in conjunction pretty much all of the time. That means you can easily perform tasks like scaling SHAP calculations with PySpark and pandas.
We're going to get more specific on how to perform particular tasks and functions within pandas DataFrames. We'll cover things like creating pandas DataFrames, indexing and iterating before getting into the details regarding the advantages of using pandas in the first place.
How to create a pandas DataFrame
Since pandas DataFrames are versatile tools that can be used in lots of different ways, they can also be created using a few different strategies.
We've already covered how to set up an empty pandas DataFrame in the response to question 4. This is one of the methods you can use to create a new pandas DataFrame. This method is best for when you don't already have another data structure to essentially "relocate" into pandas, or in other words, when you want to start with a completely blank slate.
We'll be looking at how to create a pandas DataFrame from a NumPy ndarray just now.
The short of it is that you can make DataFrames quite easily from NumPy arrays. All you need to do is pass your chosen array to the DataFrame ( ) function in your pandas data argument, which will then use your NumPy data to shape your new DataFrame. The argument will look something like this:
print(pd.dataframe [ ] )
And the data you're entering goes inside the angle brackets.
The values, index, and column names should already be included in your NumPy array so that pandas can use your specific information to create the right DataFrame for you.
One benefit of using pandas DataFrames is that the DataFrame ( ) function can take on a lot of different structures as input. When you're creating structures using non-NumPy structures, the process works pretty much the same way. That is to say, you'd still be passing your arrays into the DataFrame ( ) function, then instructing pandas to use that information to create your new DataFrame.
You can even use a DataFrame as your input to create the new DataFrame. To do this, you'd use my_df = pd.DataFrame ( ), inserting your input data into the formula.
The keys of your original dictionary will be contained within the index of your Series and, with it your DataFrame. Once the import is complete, your keys will be sorted automatically.
You can use the shape property, together with the .index property, to learn about the dimensions of your newly-created DataFrame. This will show you both its width and height. If you're looking to find out exclusively about its height, you'll want to use the LEN ( ) function (again, together with the .index property), which will show you your DataFrame's height.
Both of these approaches show you the dimensions of your DataFrame inclusive of all NaN values. On the other hand, using df[0].count ( ) will show you the DataFrame's height without any NaN values.
Indexing in pandas DataFrames
You can think of indexing data in the same way you'd think of indexing physical items in a collection. In other words, indexing in pandas involves sorting data and organizing it by picking out the specific values, rows and columns you're looking to work with.
The indexing that pandas DataFrame lets you do is similar to the kind that you can perform in Excel. The biggest difference is that pandas indexing is more detailed and versatile, giving you access to a wider range of options for handling your data in the way you want to.
In pandas, you can start indexing by choosing the specific rows and/or columns of data in your DataFrame that you're looking to work with. The exact selection can take a lot of forms. Sometimes, you'll want to use only a few rows but all columns; other times, it's the other way around. You might also need a handful of specific rows and columns.
Since you're choosing specific subsets of data, indexing is also sometimes referred to as subset selection.
Let's talk about how indexing works in pandas DataFrame.
You can actually use four separate ways to index in pandas, so we'll give a quick overview of each of these. First, there's df[ ], which is an indexing operator function. You can also use df.loc[ ] when you're dealing with labels. df.iloc[ ] is mainly used for data that's focused on positions and/or integer-based data. Lastly, there's df.ix[ ], a function for both label- and integer-based data.
The four indexing styles we just mentioned are called indexers, and they're some of the most common methods of indexing data.
The agentic AI playbook for the enterprise

Iterating through a pandas DataFrame
It's a good idea to be prepared for the times when you need to repeatedly execute the same group of statements in pandas DataFrame, or, in other words, when you want to iterate over rows.
This is another function that's quite easy to perform in pandas. You'll want to use both a for loop and an iterrows ( ) command together to set up the iteration. This lets you put your DataFrame rows into a loop in the form of (index, Series) pairs.
That way, you can get (index, row) tuples in your results.
When you're iterating in pandas, you're instructing the DataFrame to iterate as a dictionary would. That is to say, you're iterating over the keys of the object, taking the items one after another in rows and columns.
Advantages of using pandas DataFrames
- Can easily load data from different databases and data formats:
- Can be used with lots of different data types
- Have intuitive merging and joining data sets that use a common key in order to get a complete view
- Segment records within a DataFrame
- Allow smart label-based slicing, creative indexing and subsetting of large data sets
- Aggregate and summarize quickly in order to get eloquent stats from your data by accessing in-built functions within pandas DataFrames
- Define your own Python functions featuring certain computational tasks and apply them on your DataFrame records
- Have syntax that helps you get more work done with less writing
- Allows you, in two lines or less, to accomplish the same things that may take up to 15 lines in C++ or Java
- Streamline workflows, get more done each day and increase the amount of data you're actually able to process and analyze
- Access to a wide variety of features, all of which are fully compatible with Python, since pandas was designed to be used with Python
- Are more accessible due to the Python-pandas combination, given that many industry professionals are well-versed in Python
- Handle large volumes of data with ease and efficiency, and, thanks to the syntax we've already mentioned, speed
- Customize your data approach thanks to flexible data handling that lets you edit data easily, as well as apply any necessary functions to it
- Are more accessible due to the fact they are open-source, ensuring anyone who needs them can use them
- Are compatible with lots of different types of programming languages, even beyond the one they were designed for. It works with Java and HTML, for example
- Can easily be converted into other formats, such as _json
Top 5 pandas DataFrame visualization tools
While pandas DataFrame offers users the chance to use a lot of different features and functions and to flexibly manipulate any data they enter into the pandas library, it's not designed to be a highly visual tool. Basically, it gives you more of a backstage view.
That's incredibly useful for a lot of reasons. For example, sometimes, you do need a visual representation of the data you're entering.
Consider, for example, how pandas compares to a similar tool like Excel. In Excel, you can click a few buttons and automatically turn your purely numerical data into a visually appealing graph, chart or other representation. pandas doesn't come with a feature like this.
For that reason, you'll want to look outside of pandas DataFrame itself for data visualization tools.
We've compiled the five best DataFrame visualization tools below. The top two are JavaScript tools, while the other three are data analysis applications that aren't associated with Java. We'll break down the details of each tool, showing you why it's useful and what earned it the ranking we've given it.
With all of that said, let's start with a look at the top two tools and why JavaScript tools take those spots.
JavaScript tools
Originally referred to as LiveScript, JavaScript is one of the most popular programming languages today, thanks to its flexible, dynamic nature. The syntax that it uses is similar to that of C, another widely-used programming language.
When you use JavaScript, you can create interactive web pages. You can also adjust existing web pages. Like pandas DataFrame, JavaScript is capable of manipulating data, so you can use it to perform calculations or validate data-based conclusions. It's also useful for anyone looking to insert dynamic text into HTML or CSS documents.
In this instance, we're looking at JavaScript tools that can be used for pandas DataFrame visualizations.
The reason why JavaScript tools are able to take the top two spots on our list of best visualization tools is that JavaScript, as a language, is always evolving. It's widely used not just because it's broadly useful, but also because it's constantly growing and developing the more people use it. So tools created using this language can be more flexible and up-to-date with the needs of their users.
Now, let's look at Qgrid, the top JavaScript tool for pandas DataFrame visualization, followed by PivotTable.js, which is the second-best tool for this purpose.
1. Qgrid
Developed by Quantopian, Qgrid gives your DataFrame extra interactivity by using the SlickGrid component, letting you sort and filter the data in your pandas DataFrame in a displayed version. Qgrid is a Jupyter notebook widget.
Using Qgrid, you get to filter your data by its type. This means you get access to an easy-to-use filtering system with Qgrid.
A particularly useful Qgrid feature when it comes to data visualization is its ability to let you configure rendering features. After you've finalized your configurations, you can then read your chosen data in a DataFrame. This makes Qgrid particularly well-suited for data manipulation or for anyone who needs to closely inspect their data.
Let's look at a quick overview of how Qgrid works.
To use it, you assign a specific amount of space to QGridLayout using its parent layout or with a parentWidget ( ). The tool then splits this space into rows and columns, placing each widget that's been assigned to it into the appropriate cell.
2. PivotTable.js
Taking second place on our list of top tools to use with pandas, PivotTable.js is a JavaScript module that uses a pivot table library. It lets you summarize and pivot data, helping you interact with your data more easily and accessibly.
A major benefit of PivotTable.js is that it's really easy to use. All you need to do is click and drag, and you'll be able to make full use of its features.
Those features include simple visualization, alongside statistical analysis of the data in your pandas DataFrame. It's a great tool for pivoting and summarizing data so that you can get an overview of the data in your pandas DataFrame that's easier to understand at a glance. Also, after you've built a table, you can filter the data that's contained within it, giving you extra utility with the same widget.
PivotTable.js is also useful for dragging and dropping pivot charts and tables into pandas DataFrame. You can use this method to transfer tables from Jupyter and IPython Notebook, giving you more flexibility regarding the data that you input into your pandas library.
Data analysis applications
pandas DataFrams are, as we've established, highly useful for anyone looking to analyze their data.
Working with data can be complicated. When data gets generated, it won't be automatically organized unless you plug it into the right tool or apply the correct formulas to it. That's part of what makes data analysis applications so valuable; analyzing data, even well-organized data, is just a lot quicker when you can program a function to do it for you.
In this section, we're going to consider the three data analysis applications that are best suited to helping you visualize information stored in your pandas DataFrame.
3. pandasGUI
pandasGUI is a Python-based library that was created to help with data manipulation and summary statistics. They're applied to the data in your DataFrame library using a GUI (graphical user interface), which involves performing any intended operations in the interface. pandasGUI is designed to let you input commands in the UI (user interface), and the program then executes them in pandas itself.
A quick note for anyone looking to install pandasGUI is that it's best to set up a new, separate virtual environment for this specific purpose. You can then install your pandasGUI library in this environment. That way, you'll have a cleaner installation and be able to use the tool more quickly.
Once the installation and setup are complete, you can get started right away. Pass your DataFrame to the function, and pandasGUI will automatically be populated with rows and columns that it draws from your data set. You can even load more than one data set at a time using this method, letting you get an easy overview of lots of information at once.
Your data will be accessible to you from the GUI once it's been passed to the function successfully. From there, you can interact with, edit, analyze and manipulate that data in lots of different ways. It more or less works like an Excel spreadsheet in terms of available functions and layout appearance.
Data in the GUI format can be copied and pasted into other formats as well. This makes it particularly easy to transfer the data to your visualization tool of choice if the type of visualization you're looking for is something like a chart or a graph.
Essentially, pandasGUI is particularly simple to use. It's also very user-friendly, even to less experienced coders. That's why it's earned this spot as the third-most useful data visualization tool for pandas DataFrame.
4. Tabloo
Tabloo describes itself as a "minimalistic dashboard app for visualizing tabular data." You can run it from Python, meaning it's fully compatible with pandas as well.
This data visualization tool uses a Flask backend, though it's also compatible with other types of backend languages. The backend gets used to give you a simple interface that lets you make visual sense of the data you're putting into your pandas DataBase.
Tabloo also lets you plot your data. That means you don't have to turn to external software to start seeing those graphs and charts you need, which is convenient if you're looking for a quick visualization and don't want to have to go searching for more tools to give that to you.
In terms of the way it's used, Tabloo has a lot in common with pandasGUI. It also organizes data into cells, which can then be manipulated using much the same functions that pandasGUI is also capable of running. However, it's a little more difficult to apply more than one filter at a time in Tabloo, which is something pandasGUI is very capable of handling.
The syntax Tabloo operates on is query syntax, like pandasGUI.
An important difference between pandasGUI and Tabloo is that the former is more feature-rich. You simply get more options for handling your data when you use pandasGUI, which is why Tabloo ranks lower on this list despite providing users with undeniably useful features.
5. D-Tale
Featuring an architecture that's comparable to Tabloo's, D-Tale takes up the last spot on this list. D-Tale uses a Flask backend, much like Tabloo, alongside a React front end that helps you make the most of the extensive array of options D-Tale lets you use.
The user interface you see when you use D-Tale is, as the application's name suggests, quite detailed. You can access this by importing your pandas data into D-Tale. It'll then automatically be organized into rows and columns for you, which come with a great number of sorting features you can use to get the data set to look exactly as you want it. You can use Lock, Hide, Delete and Rename features, among others, for any row or column you choose, for example.
D-Tale also lets you draw up visual representations of your data that range from charts to histograms and beyond.
A useful D-Tale feature is that you can export code from the application at any time. That code can then easily be pasted into another application to check its validity or to process the data in other ways.
D-Tale also lets you handle the formatting of your data. For example, let's say you've got dates included in your data set. If you'd like your dates to separate months and days from each other using a backslash instead of a period, you can adjust this in D-Tale.
pandas DataFrames in a nutshell
When you're looking to process, manipulate and analyze data, pandas DataFrame is your friend.
It's a library that's designed to be used in combination with Python, making it accessible to just about anyone with even a passing familiarity with Python. It's capable of processing data in lots of different kinds of formats, too, ensuring you can input your data easily no matter what form that data takes.
We've covered the biggest advantages that come with using pandas in this article, but we'll give you a quick summary of them anyway. pandas DataFrame lets you aggregate data quickly and easily. It's also compatible with multiple visualization tools, providing maximum flexibility. Unlike other scripting languages, it's able to do a lot of things with just a few lines of code commands, making it quicker to use on a regular basis.
In a word, pandas DataFrame is useful, and that's true for anyone looking to process their data.
Additional Resources
Get the latest posts in your inbox
Subscribe to our blog and get the latest posts delivered to your inbox.