PanTera Big Data Visualization Leverages the Power of Databricks

This is a guest blog from our one of our partners: Uncharted formerly known as Oculus Info, Inc.
About PanTeraTM
PanTera was created with the fundamental guiding principles that visualization, interaction, and nuance are critical to understanding data. PanTera unlocks the specific opportunity and richness presented by large amounts of data by enabling interactive visual exploration at scale while preserving detail. These visualizations harness the power of human perception to rapidly identify patterns and form new hypotheses.
Current tools have powerful libraries for data manipulation and analysis but largely rely on sampling or aggregation for visualization. This often means seeing the big picture at the expense of the whole picture. At Uncharted, we avoided this compromise by creating an application to allow the exploration of the entirety of large datasets with the ability to focus on any area of interest, all the way down to a single data point.
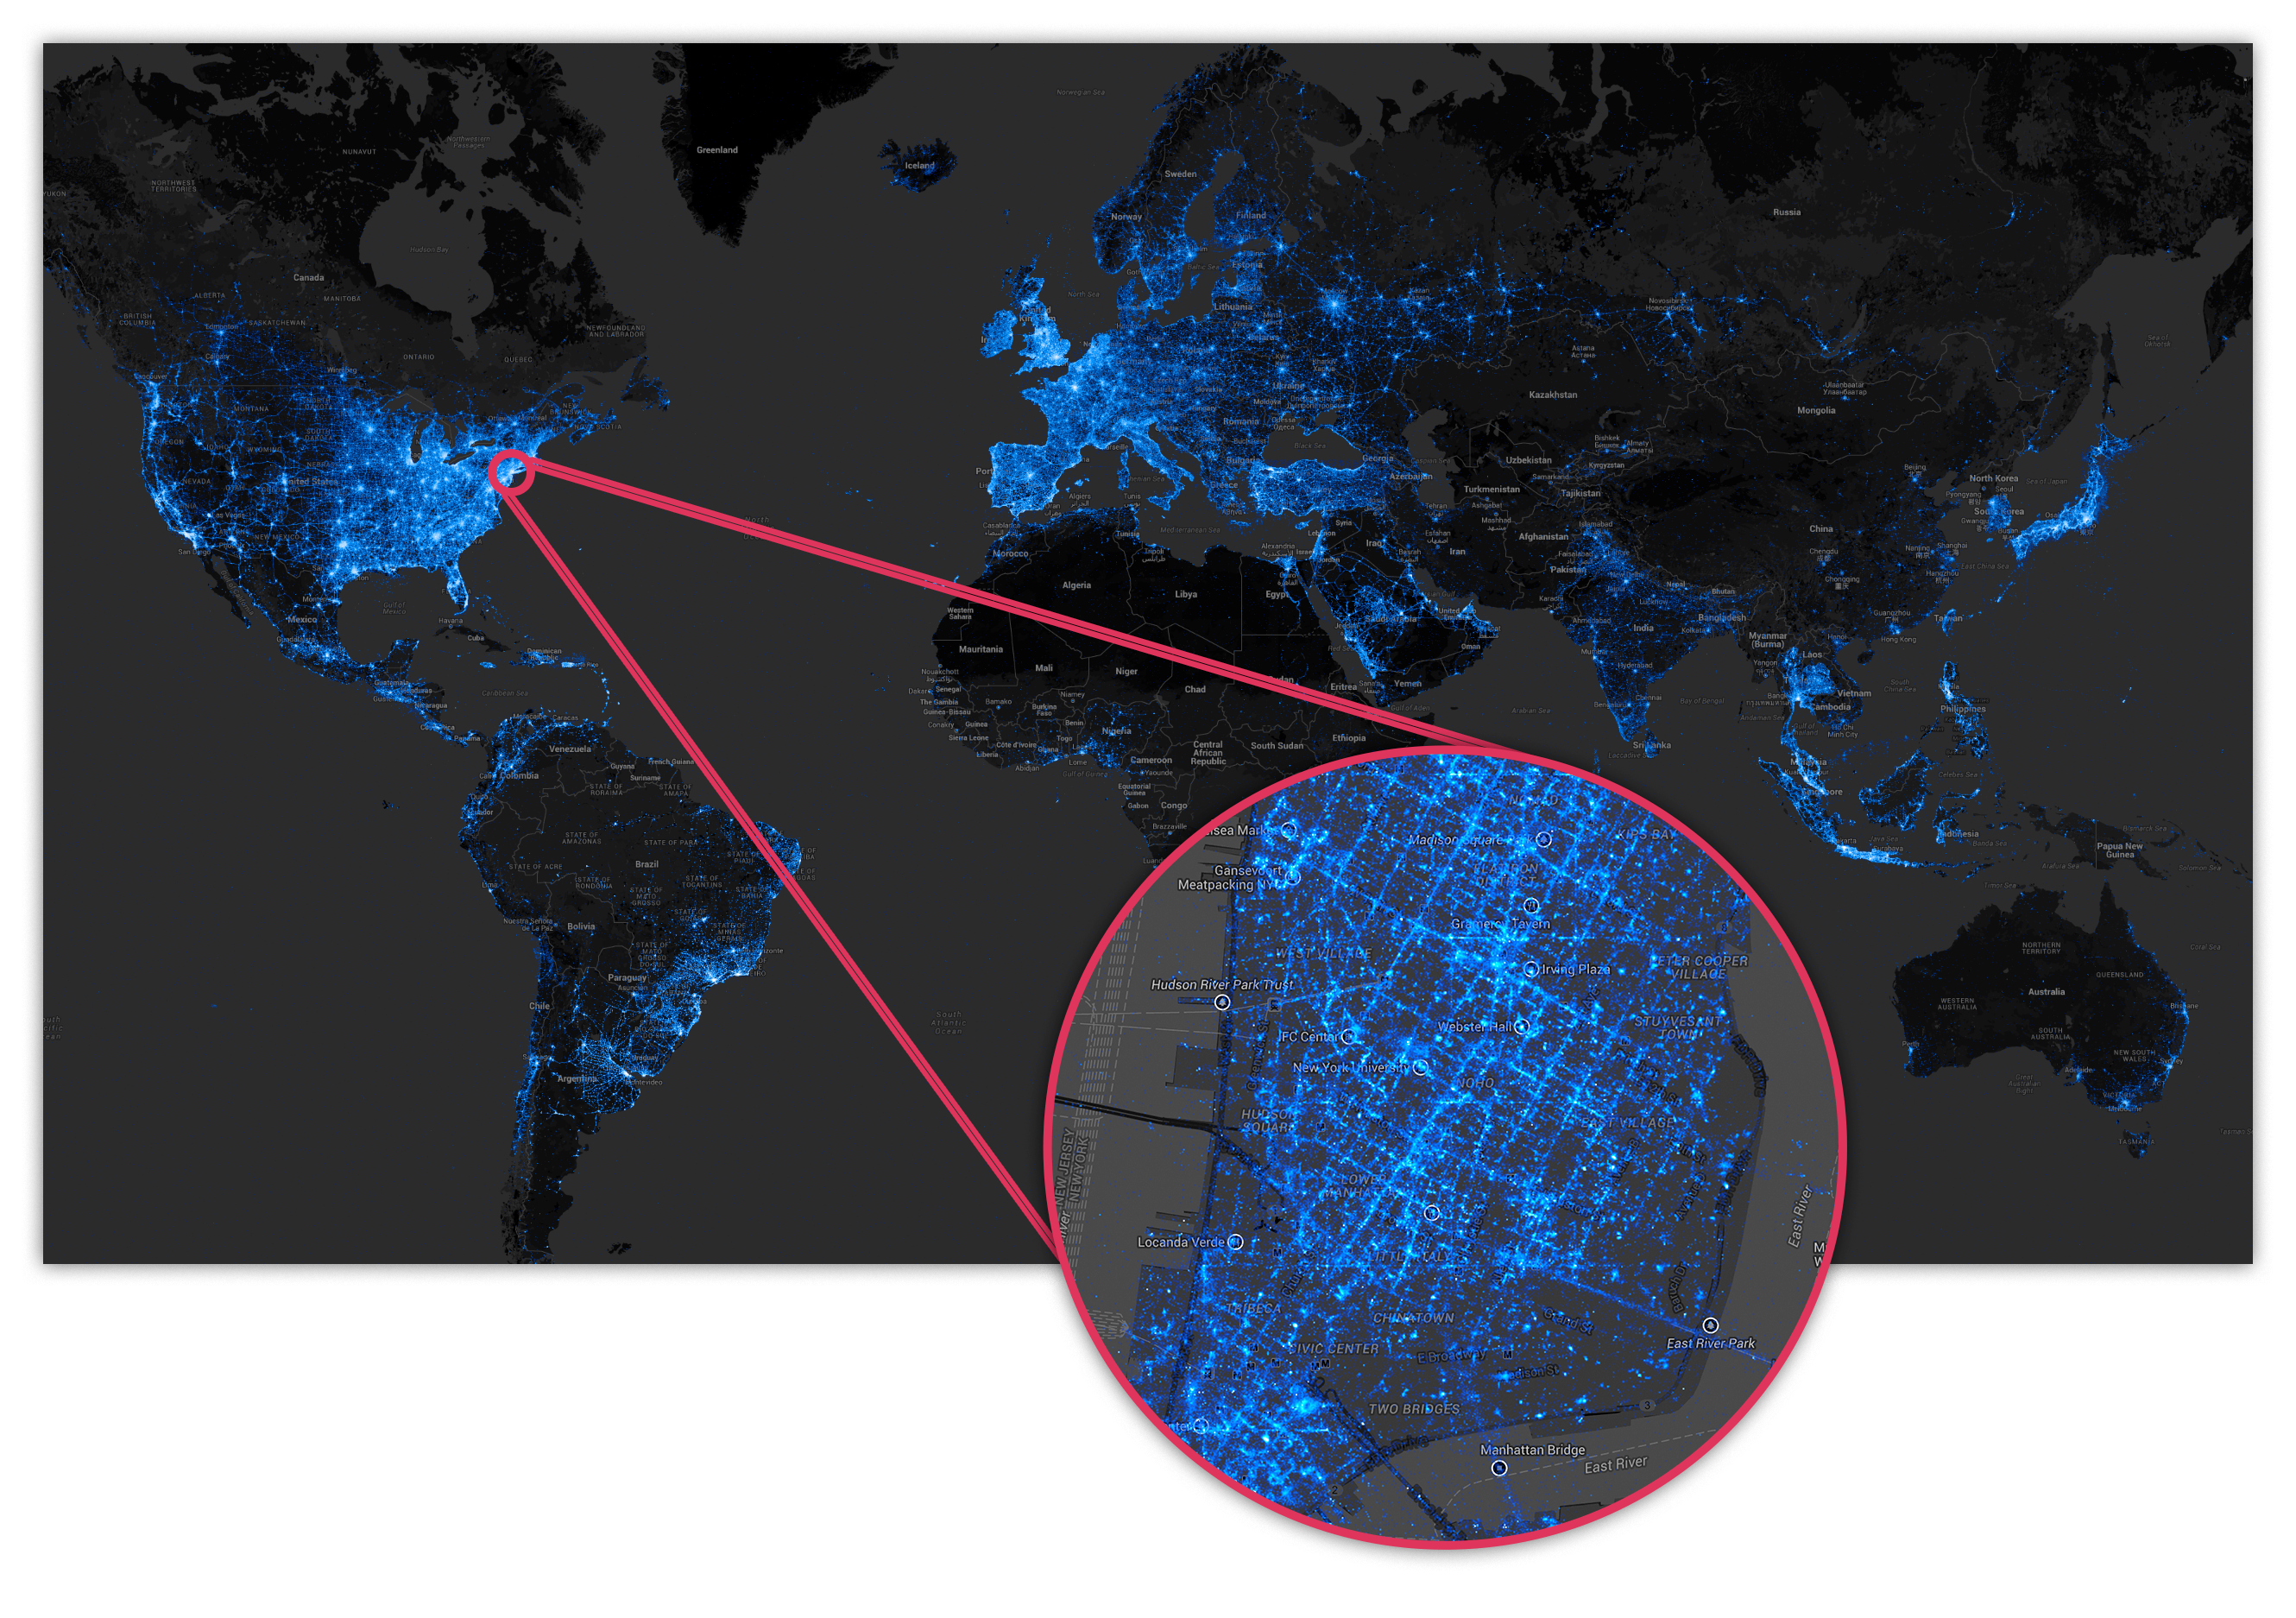
Figure 1: 1.6 B Geolocated Instagram posts provide an overview of global usage. Zooming in on New York City, reveals detail showing quantization of some of the location data
PanTera and the Databricks make the visual exploration of big data accessible to any analyst, on a platform that is powerful enough for even the most experienced data scientists and developers. The application lets analysts work with multi-dimensional, high-resolution data without making assumptions for them.
Built with the Speed and Flexibility of Spark
PanTera allows users to quickly and iteratively explore the entirety of large datasets. To accomplish this, PanTera harnesses the power of Apache Spark to create a tile-based visualization system with parallels to browser-based, geographic maps such as Google Maps. Uncharted chose Spark because it gave us the most flexibility and speed.
Spark allows us the flexibility to work with pre-existing or live streaming data, and to implement batch or on-demand processing, all with a single code base. Spark’s ability to handle SQL queries as well as Scala and Java code let us quickly create a tool that can handle tiling any kind of data, numerical or unstructured text. Most importantly, Spark’s memory-optimized computation caches entire datasets, allowing us to make deep exploration fast and easy.
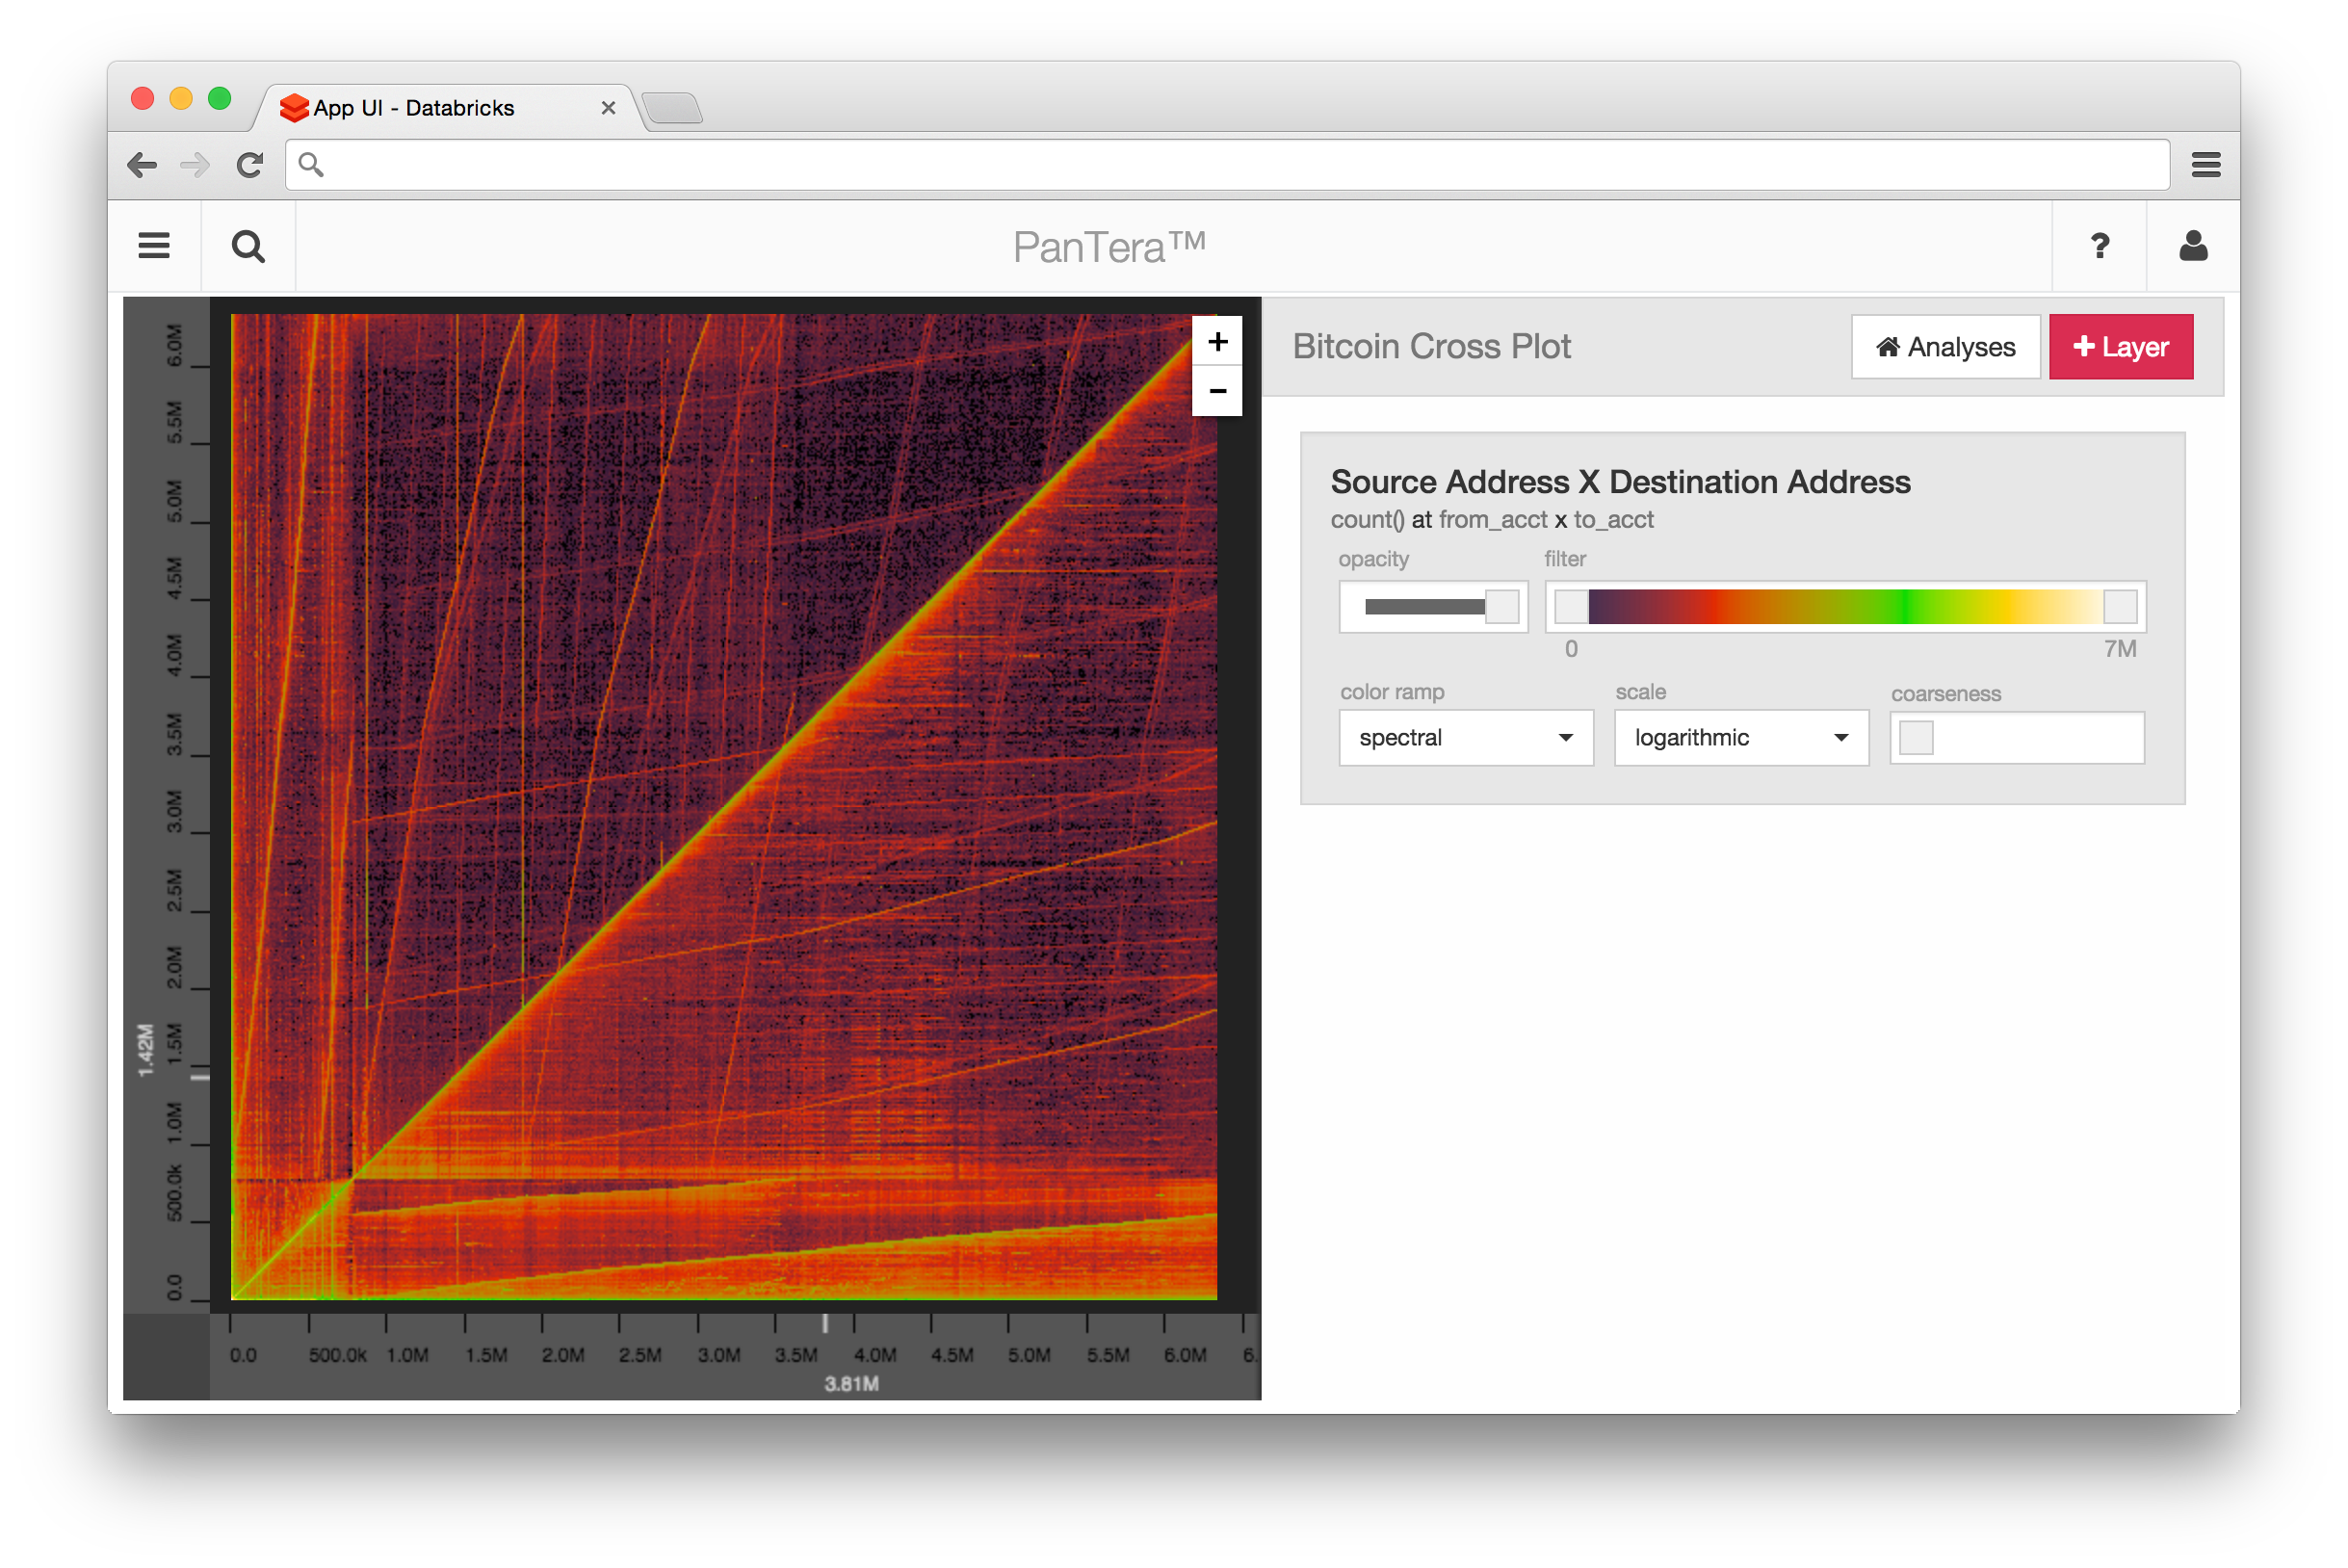
Figure 2: Cross-Plot of 13M Bitcoin Transactions in PanTera
Discovery with the ease of Databricks
The real-time exploratory nature of PanTera is only possible with on-demand access to cluster computing resources. Databricks allows easy provisioning of the right cluster for the job, and enables flexibility as needs change. Essential elements of data capture and ETL are also handled by Databricks, allowing us to focus on creating great visualizations.
For our users, Databricks extends PanTera’s capabilities by creating an iterative workflow where analysts visualize data, then perform data manipulation in the Databricks Notebook and visualize again. These critical Databricks features enable our users to perform great analysis and avoid infrastructure headaches.
Don’t forget to check out our website to learn more about PanTera and experience how our visual interface for big data enhances statistical exploration on Databricks.

