Easier Spark Code Debugging
by Chaoyu Yang
To try the features mentioned in this blog, sign up for a 14-day free trial of Databricks today.
We are excited to introduce the integration of Apache Spark web UIs in Databricks notebooks, which allows the user to understand and debug their Spark application more efficiently.
As a component of open source Spark, the web UI is designed to help with monitoring and understanding your Spark application, it contains useful information about memory usage, running executors, scheduler stages, and tasks. This information is extremely helpful for debugging.
The Databricks notebook is a visual collaborative workspace that allows users to explore data and develop applications interactively using Apache Spark. It makes working with data a lot easier, as shown in example workflows such as analysis access logs and doing machine learning.
Debugging a distributed application is still challenging in the notebook environment. Even though the web UI has the necessary information, there is a gap between web UIs and the development environment: it’s usually difficult to locate information in the web UI that is relevant to the code you are investigating; and there is no easy way to find historical runtime information.
How the Integrated web UI helps with coding
To solve this issue, we created a way to directly access the runtime information within the development environment.
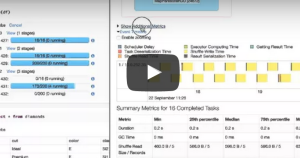
Databricks notebooks now display real-time updates from the Spark nodes in the form of “progress bars”. If a command launches a Spark job under the hood, the progress bars will be automatically updated as the job executes, which makes monitoring the status of the command way easier!
https://www.youtube.com/watch?v=qTMSb1pRsN0
The Progress Bar: Displaying Spark Job execution progress in real-time in Databricks Notebook
The progress bars also directly link to more detailed information about each Spark Job, allowing users to drill down into the web UI of each job for further investigation. The additional visibility means you can view all the system status and runtime information you needed for debugging, side by side with where you write the code.
https://www.youtube.com/watch?v=mnD3SkJOrKw
To get a more detailed look at this feature in action, watch the video below:
Summary
By integrating Spark's web UI with Databricks notebooks, we have created a shortcut to easily access debugging information within your development environment. Hopefully these enhancements will help you debug Spark application more effectively.
These enhancements are now available to all Databricks users, sign up for a 14-day free trial to try them out!
Get the latest posts in your inbox
Subscribe to our blog and get the latest posts delivered to your inbox.
