Delivering a Personalized Shopping Experience with Apache Spark on Databricks
This is a guest blog from our friends at Dollar Shave Club.
 Dollar Shave Club (DSC) is a men's lifestyle brand and e-commerce company on a mission to change the way men address their shaving and grooming needs. Data is perhaps the most critical asset in achieving a cutting-edge user experience. Databricks has been an important partner in our efforts to build a personalized customer experience through data. This post describes how the Databricks platform supported all stages of development and deployment of a powerful, custom machine learning pipeline that we use to deliver targeted content to our members.
DSC’s primary offering is a monthly subscription for razor cartridges, which are shipped directly to members. Our members join and manage their account on our single-page web app or native mobile apps. During their visit, they can shop our catalogue of grooming and bathroom products—we now have dozens of products organized under distinctive brands. Courtesy of the club, members and guests can enjoy Original Content, articles and videos created for people who enjoy our characteristic style. They can satisfy their curiosity on health and grooming topics with articles that don’t remind them of their junior high health class. They can get quick tips on style, work and relationships, or they can read DSC’s fun take on big questions, like “How long can civilization last on Earth?” DSC also seeks to engage people on social media channels, and our members can be enthusiastic about joining in. By identifying content and offers of the most interest to each individual member, we can provide a more personalized and better membership experience.
Data at Dollar Shave Club
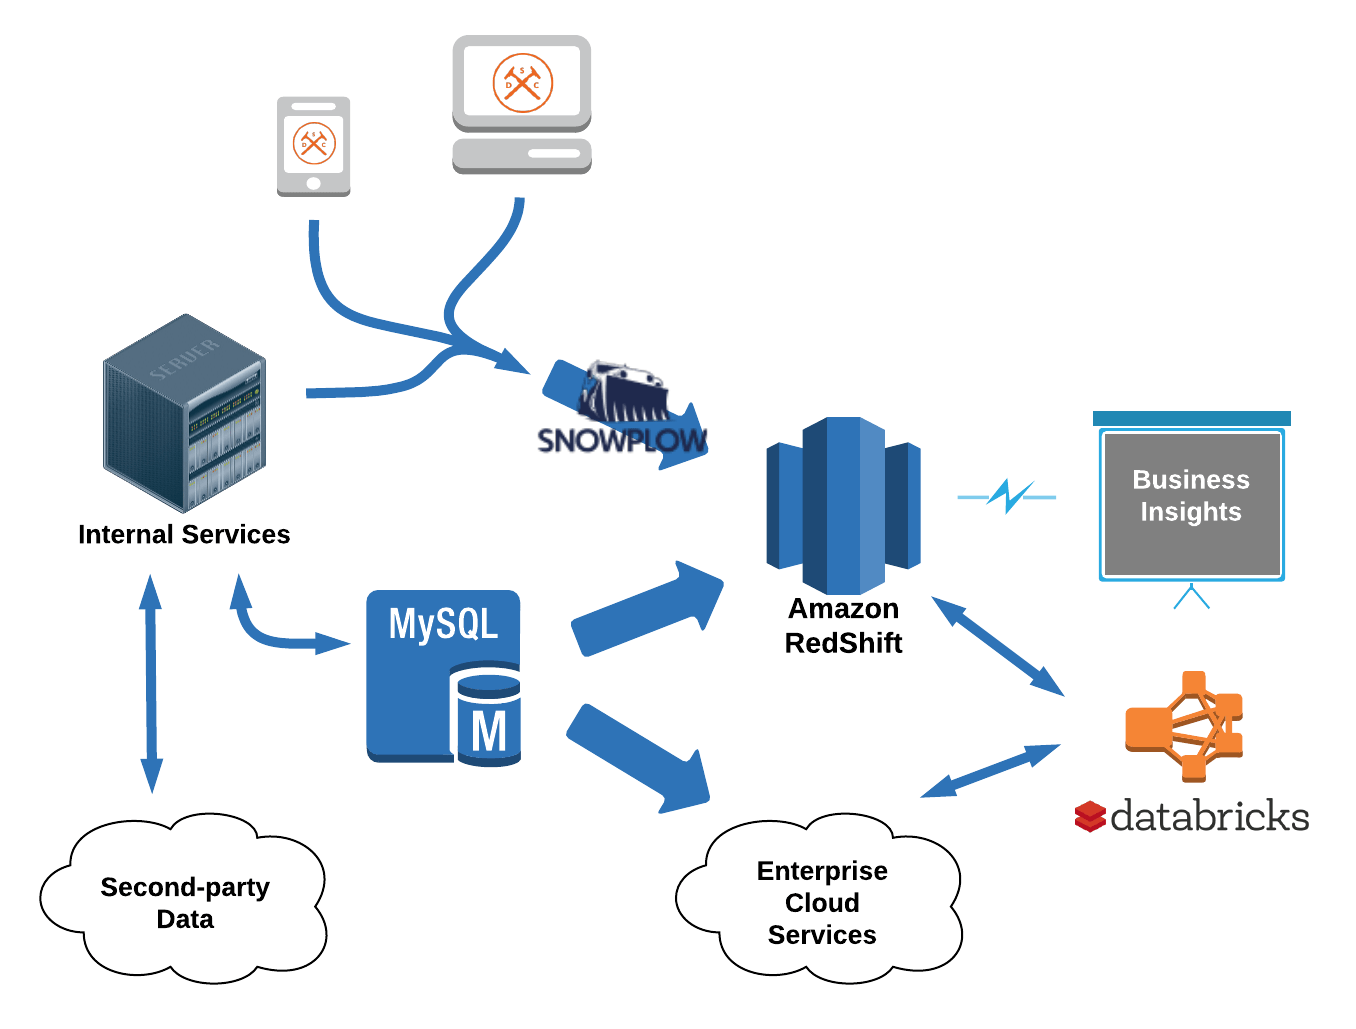
DSC’s interactions with members and guests generate a mountain of data. Knowing that the data would be an asset in improving member experience, our engineering team invested early in a modern data infrastructure. Our web applications, internal services and data infrastructure are 100% hosted on AWS. A Redshift cluster serves as the central data warehouse, receiving data from various systems. Records are continuously replicated from production databases into the warehouse. Data also moves between applications and into Redshift mediated by Apache Kafka, an open-source streaming platform. We use Snowplow, a highly-customizable open-source event pipeline, to collect event data from our web and mobile clients as well as server-side applications. Clients emit detailed records of page views, link clicks, browsing activity and any number of custom events and contexts. Once data reaches Redshift, it is accessed through various analytics platforms for monitoring, visualization and insights.
With this level of visibility, there are abundant opportunities to learn from our data and act on it. But identifying those opportunities and executing at scale requires the right tools. Apache Spark—a state-of-the-art cluster computing framework with engines for ETL, stream processing and machine learning—is an obvious choice. Moreover, Databricks' latest developments for data engineering make it exceedingly easy to get started with Spark, providing a platform that is apt as both an IDE and deployment pipeline. On our first day using Databricks, we were equipped to grapple with a new class of data challenges.
Use Case: Recommendation Engine
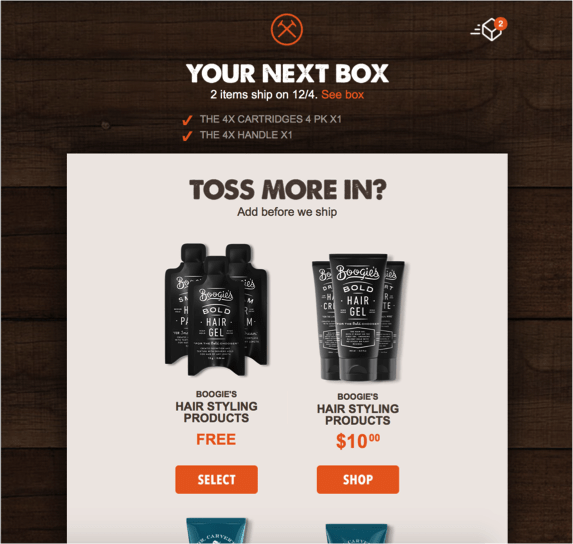
One of the first projects we developed on Databricks aimed to use predictive modeling to optimize the product recommendations that we make to our members over a particular email channel. Members receive a sequence of emails in the week before their subscription box is shipped. These emails inform them about the upcoming shipment and also suggest additional products that they can include in their box. Members can elect to add a recommended product from the email with just a few clicks. Our goal was to produce, for a given member, a ranking of products that prescribes which products to promote in their monthly email and with what priority.
We planned to perform an exhaustive exploration in search of behavior that tends to indicate a member’s level of interest in each of our products. We would extract a variety of metrics in about a dozen segments of member data, pivot that data by hundreds of categories, actions and tags, and index event-related metrics by discretized time. In all, we included nearly 10,000 features, for a large cohort of members, in the scope of our exploration. To contend with a large, high-dimensional and sparse dataset, we decided to automate the required ETL and Data Mining techniques using Spark Core, Spark SQL and MLlib. The final product would be a collection of linear models, trained and tuned on production data, that could be combined to produce product rankings.
We set out to develop a fully automated pipeline on Spark with the following stages:
- Extract data from warehouse (Redshift)
- Aggregate and pivot data per member
- Select features to include in final models
Step 1: Extract Data
We start by looking at various segments of data in our relational databases; groupings of records that need to be stitched together to describe a domain of events and relationships. We need to understand each data segment---how it can be interpreted and how it might need to be cleaned up---so that we can extract accurate, portable, self-describing representations of the data. This is crucial work that collects together domain expertise and institutional knowledge about the data and its life-cycle, so it is important to document and communicate what is learned in the process. Databricks provides a "notebook" interface to the Spark shell that makes it easy to work with data interactively, while having complete use of Spark's programming model. Spark notebooks proved to be ideal for trying out ideas and quickly sharing the results or keeping a chronicle of your work for reference later.
For each data segment, we encapsulate the specifics of cleaning and denormalizing records in an extractor module. In many cases, we can simply export tables from Redshift, dynamically generate SQL queries, and then let Spark SQL do all the heavy lifting. If necessary, we can cleanly introduce functional programming using Spark's DataFrames API. And the application of domain-specific metadata has a natural home in an extractor. Importantly, the first steps for processing a particular data segment are neatly isolated from that for other segments and from other stages of the pipeline. Extractors can be developed and tested independently. And they can be reused for other explorations or for production pipelines.
Example code for a data extraction pipeline. The pipeline uses the interface implemented by several extractor classes, passing arguments to customize behavior. The pipeline is agnostic to the details of each extraction.
Example code for an extractor interface. In many cases, an extractor simply generates a SQL query and passes it to SparkSQL.
Step 2: Aggregate and Pivot
The data extracted from the warehouse is mostly detailed information about individual events and relationships; But what we really need is an aggregated description of activity over time, so that we can effectively search for behavior that indicates interest in one product or another. Comparing specific event types second by second is not fruitful—at that level of granularity, the data is much too sparse to be good fodder for machine learning. The first thing to do is to aggregate event-related data over discrete periods of time. Reducing events into counts, totals, averages, frequencies, etc., makes comparisons among members more meaningful and it makes data mining more tractable. Of course, the same set of events can be aggregated over several different dimensions, in addition to time. Any or all of these numbers could tell an interesting story.
Aggregating over each of several attributes in a dataset is often called pivoting (or rolling up) the data. When we group data by member and pivot by time and other interesting attributes, the data is transformed from data about individual events and relationships into a (very long) list of features that describe our members. For each data segment, we encapsulate the specific method for pivoting the data in a meaningful way in its own module. We call these modules transformers. Because the pivoted dataset can be extremely wide, it is often more performant to work with RDDs rather than DataFrames. We generally represent the set of pivoted features using a sparse vector format, and we use key-value RDD transformations to reduce the data. Representing member behavior as a sparse vector shrinks the size of the dataset in memory and also makes it easy to generate training sets for use with MLlib in the next stage of the pipeline.
Step 3: Data Mining
At this point in the pipeline, we have an extremely large set of features for each member and we want to determine, for each of our products, which subset of those features best indicate when a member is interested in purchasing that product. This is a data mining problem. If there were fewer features to consider—say, dozens instead of several thousand—then there would be several reasonable ways to proceed. However, the large number of features being considered presents a particularly hard problem. Thanks to the Databricks platform, we were easily able to apply a tremendous amount of computing time to the problem. We used a method that involved training and evaluating models on relatively small, randomly sampled sets of features. Over several hundred iterations, we gradually accumulate a subset of features that each make a significant contribution to a high-performing model. Training a model and calculating the evaluation statistic for each feature in that model is computationally expensive. But we had no trouble provisioning large Spark clusters to do the work for each of our products and then terminating them when the job was done.
It is essential that we be able to monitor the progress of the data mining process. If there is a bug or data quality issue that is preventing the process from converging on the best performing model, then we need to detect it as early as possible to avoid wasting many hours of processing time. For that purpose, we developed a simple dashboard on Databricks that visualizes the evaluation statistics collected on each iteration.
Final Models
The evaluation module in MLlib makes it exceedingly simple to tune the parameters of its models. Once the hard work of the ETL and data mining process is complete, producing the final models is nearly effortless. After determining the final model coefficients and parameters, we were prepared to start generating product rankings in production. We used Databricks’ scheduling feature to run a daily job to produce product rankings for each of the members who will be receiving an email notification that day. To generate feature vectors for each member, we simply apply to the most recent data the same extractor and transformer modules that generated the original training data. This not only saved development time upfront, it avoids the problems of dual maintenance of exploration and production pipelines. It also ensures that the models are being applied under the most favorable conditions—to features that have precisely the same meaning and context as in the training data.
Future Plans with Databricks and Apache Spark
The product recommendation project turned out to be a great success that has encouraged us to take on similarly ambitious data projects at DSC. Databricks continues to play a vital role in supporting our development workflow, particularly for data products. Large-scale data mining has become an essential tool that we use to gather information to address strategically important questions; and the resulting predictive models can then be deployed to power smart features in production. In addition to machine learning, we have projects that employ stream-processing applications built on Spark Streaming; for example, we consume various event streams to unobtrusively collect and report metrics, or to replicate data across systems in near real-time. And, of course, a growing number of our ETL processes are being developed on Spark.
Never miss a Databricks post
What's next?

Product
November 21, 2024/3 min read
How to present and share your Notebook insights in AI/BI Dashboards

Product
December 10, 2024/7 min read