Query Watchdog: Handling Disruptive Queries in Spark SQL
Read Rise of the Data Lakehouse to explore why lakehouses are the data architecture of the future with the father of the data warehouse, Bill Inmon.
At Databricks, our users range from SQL Analysts who explore data through JDBC connections and SQL Notebooks to Data Engineers orchestrating large scale ETL jobs. While this is great for data democratization, one challenge associated with exploratory data analysis is handling rogue queries that appear as if they will finish, but never actually will. These queries can be extremely slow, saturate cluster resources, and deprive others to share the same cluster.
A Motivating Example: Skewed Joins
To motivate this circumstance, let’s walk through a particular workflow. A SQL analyst in my organization is just getting ramped up on Databricks and the data we have stored there. She’s performing some ad hoc queries to get familiar with the data layout and contents but isn’t quite aware of some of the implications of joining certain tables together. For instance, these tables may have extremely skewed data.
Since this customer is on Databricks, they use a Shared Autoscaling cluster that makes it easy for multiple users to use a single cluster at the same time. For this example, let’s imagine that we have two tables that each have a million rows.
These table sizes are easy for Apache Spark to manage. However, you will notice that each includes a join_key column with an empty string for every row. This may happen if your data is not perfectly clean or if there is significant data skew where some keys are vastly more prevalent than others in a table.
Our analyst, getting started and trying to understand the data, is joining these two tables on their keys. She doesn’t quite realize that this will produce one trillion rows and all of those rows will be produced on a single executor (the executor that gets the ” ” value).
This query will appear to be running but without knowing about the data, the user will see that there’s “only” a single task left over the course of executing the job. Unfortunately, this query will never finish as well leaving her frustrated and confused about why it did not work.
Enter the Query Watchdog
The previous query would cause problems on many different systems, regardless of whether you’re using Databricks or another data warehousing tool. Luckily, as an user of Databricks, this customer has a feature available that can help solve this problem called the Query Watchdog.
Note: Query Watchdog is available on clusters created with version 2.1-db3 and greater.
A Query Watchdog is a simple process that checks whether or not a given query is creating too many output rows for the number of input rows at a task level. We can set a property to control this and in this example we will use a ratio of 1000 (which is the default).
The two properties we set above will (1) turn on the Query Watchdog and (2) declare that any given task should never produce more than 1000x the number of input rows. The output ratio is completely customizable. We recommend starting lower and seeing what threshold works well for you and your team. The range of 1,000 to 10,000 is likely a good starting point.
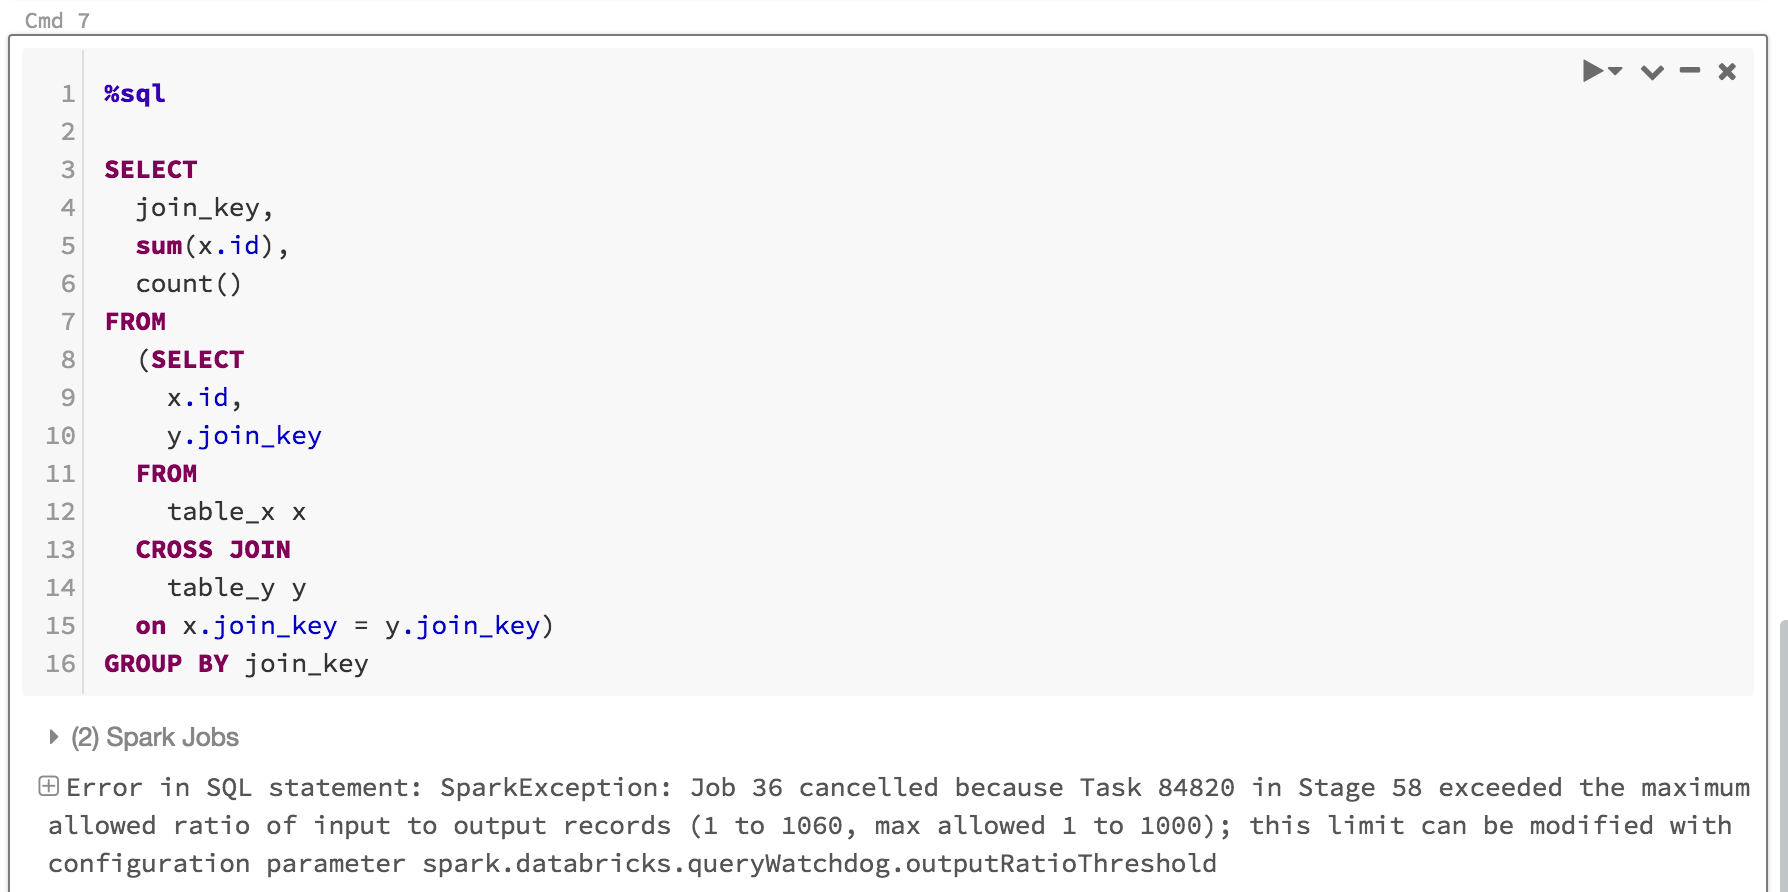
Now when the user goes to run the following query, it will fail after several minutes. Not only do Query Watchdog settings prevent users hogging cluster resources for jobs that will never complete, it will also save users time by fast-failing a query that would have never completed. For example, the following query will fail after several minutes because it exceeded the ratio - here’s what I’ll see as a user.
As users or administrators we can change these output ratio at runtime using the aforementioned configurations to control the queries that our clusters will tolerate. This relieves me, as an administrator, from having to constantly monitor usage on shared clusters by my different users and providing some “bumpers” for rogue queries.
Tuning and Migration Guide
These previous two properties are often enough for most use cases, but in case we’d like to control things further, we can set another two properties. These parameters specify the minimum time a given task in a query must run before cancelling it. We can set this to a higher value if we’d like to give it a chance to still produce a large amount of rows (per task). The second parameter allows me to set a minimum number of output rows for a task in that query. For instance, we can set this to ten million if we want to stop a query only after a task in that query has produced ten million rows. Anything less and the query would still succeed (even if the ratio was exceeded).
When is the Query Watchdog a good choice?
This is a great choice for a cluster being used for interactive queries where SQL analysts and data scientists are sharing a given cluster since it avoids wasting users’ time and gives users the chance to correct or rewrite queries. If you set this value in a notebook, it is important to know that it will not persist across restarts. We recommend setting as a cluster configuration, at cluster launch time, if you would like to set this property for all users of a given cluster.
When is it a bad choice?
This configuration is less helpful for production ETL workloads because users cannot fix their queries on the fly in a production job. In general, we do not advise eagerly cancelling queries used in an ETL scenario because there typically isn’t a human in the loop to correct the error. We recommend avoiding the use of this tool outside ad hoc analytics clusters.
Read more about the Query Watchdog feature in our documentation
At Databricks, we’re always trying make user experience easier. Try it for yourself, and signup today.
Get the latest posts in your inbox
Subscribe to our blog and get the latest posts delivered to your inbox.