Simplify Market Basket Analysis using FP-growth on Databricks
by Bhavin Kukadia and Denny Lee
When providing recommendations to shoppers on what to purchase, you are often looking for items that are frequently purchased together (e.g. peanut butter and jelly). A key technique to uncover associations between different items is known as market basket analysis. In your recommendation engine toolbox, the association rules generated by market basket analysis (e.g. if one purchases peanut butter, then they are likely to purchase jelly) is an important and useful technique. With the rapid growth e-commerce data, it is necessary to execute models like market basket analysis on increasing larger sizes of data. That is, it will be important to have the algorithms and infrastructure necessary to generate your association rules on a distributed platform. In this blog post, we will discuss how you can quickly run your market basket analysis using Apache Spark MLlib FP-growth algorithm on Databricks.
To showcase this, we will use the publicly available Instacart Online Grocery Shopping Dataset 2017. In the process, we will explore the dataset as well as perform our market basket analysis to recommend shoppers to buy it again or recommend to buy new items.
The flow of this post, as well as the associated notebook, is as follows: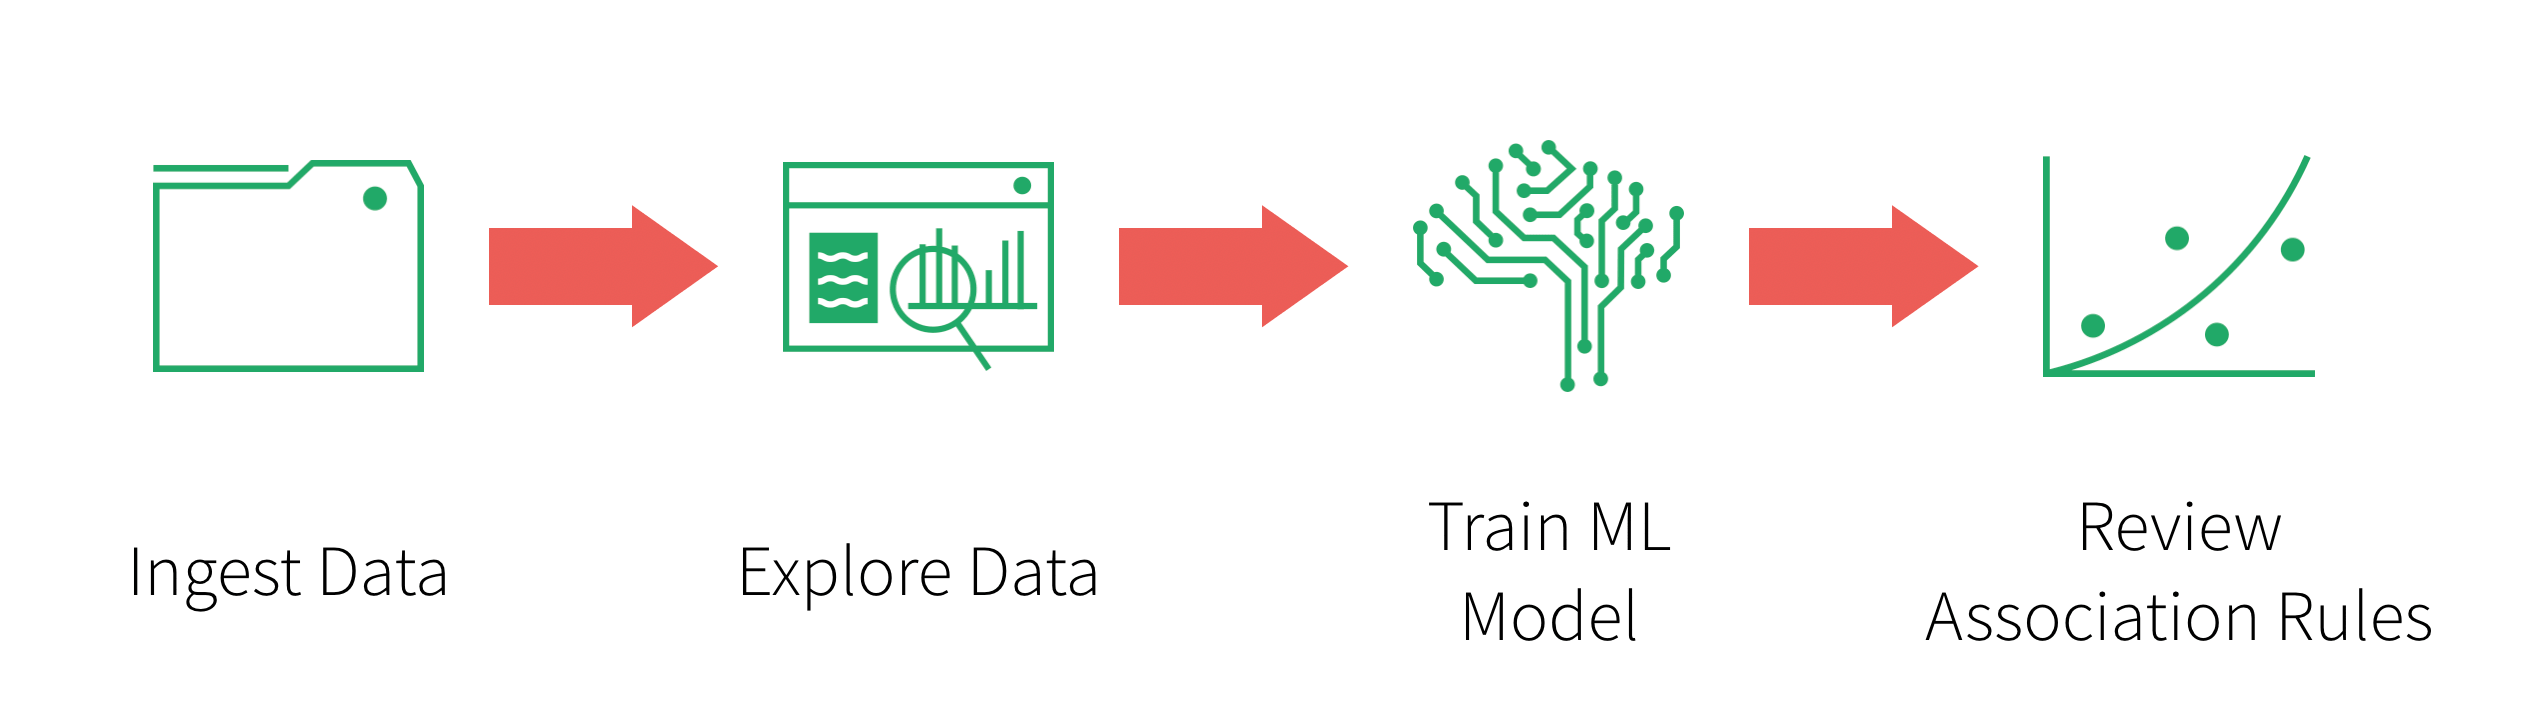
- Ingest your data: Bringing in the data from your source systems; often involving ETL processes (though we will bypass this step in this demo for brevity)
- Explore your data using Spark SQL: Now that you have cleansed data, explore it so you can get some business insight
- Train your ML model using FP-growth: Execute FP-growth to execute your frequent pattern mining algorithm
- Review the association rules generated by the ML model for your recommendations
Ingest Data
The dataset we will be working with is 3 Million Instacart Orders, Open Sourced dataset:
The "Instacart Online Grocery Shopping Dataset 2017”, Accessed from https://www.instacart.com/datasets/grocery-shopping-2017 on 01/17/2018. This anonymized dataset contains a sample of over 3 million grocery orders from more than 200,000 Instacart users. For each user, we provide between 4 and 100 of their orders, with the sequence of products purchased in each order. We also provide the week and hour of day the order was placed, and a relative measure of time between orders.
You will need to download the file, extract the files from the gzipped TAR archive, and upload them into Databricks DBFS using the Import Data utilities. You should see the following files within dbfs once the files are uploaded:
Orders: 3.4M rows, 206K usersProducts: 50K rowsAisles: 134 rowsDepartments: 21 rowsorder_products__SET: 30M+ rows whereSETis defined as:prior: 3.2M previous orderstrain: 131K orders for your training dataset
Refer to the Instacart Online Grocery Shopping Dataset 2017 Data Descriptions for more information including the schema.
Create DataFrames
Now that you have uploaded your data to dbfs, you can quickly and easily create your DataFrames using spark.read.csv:
Exploratory Data Analysis
Now that you have created DataFrames, you can perform exploratory data analysis using Spark SQL. The following queries showcase some of the quick insight you can gain from the Instacart dataset.
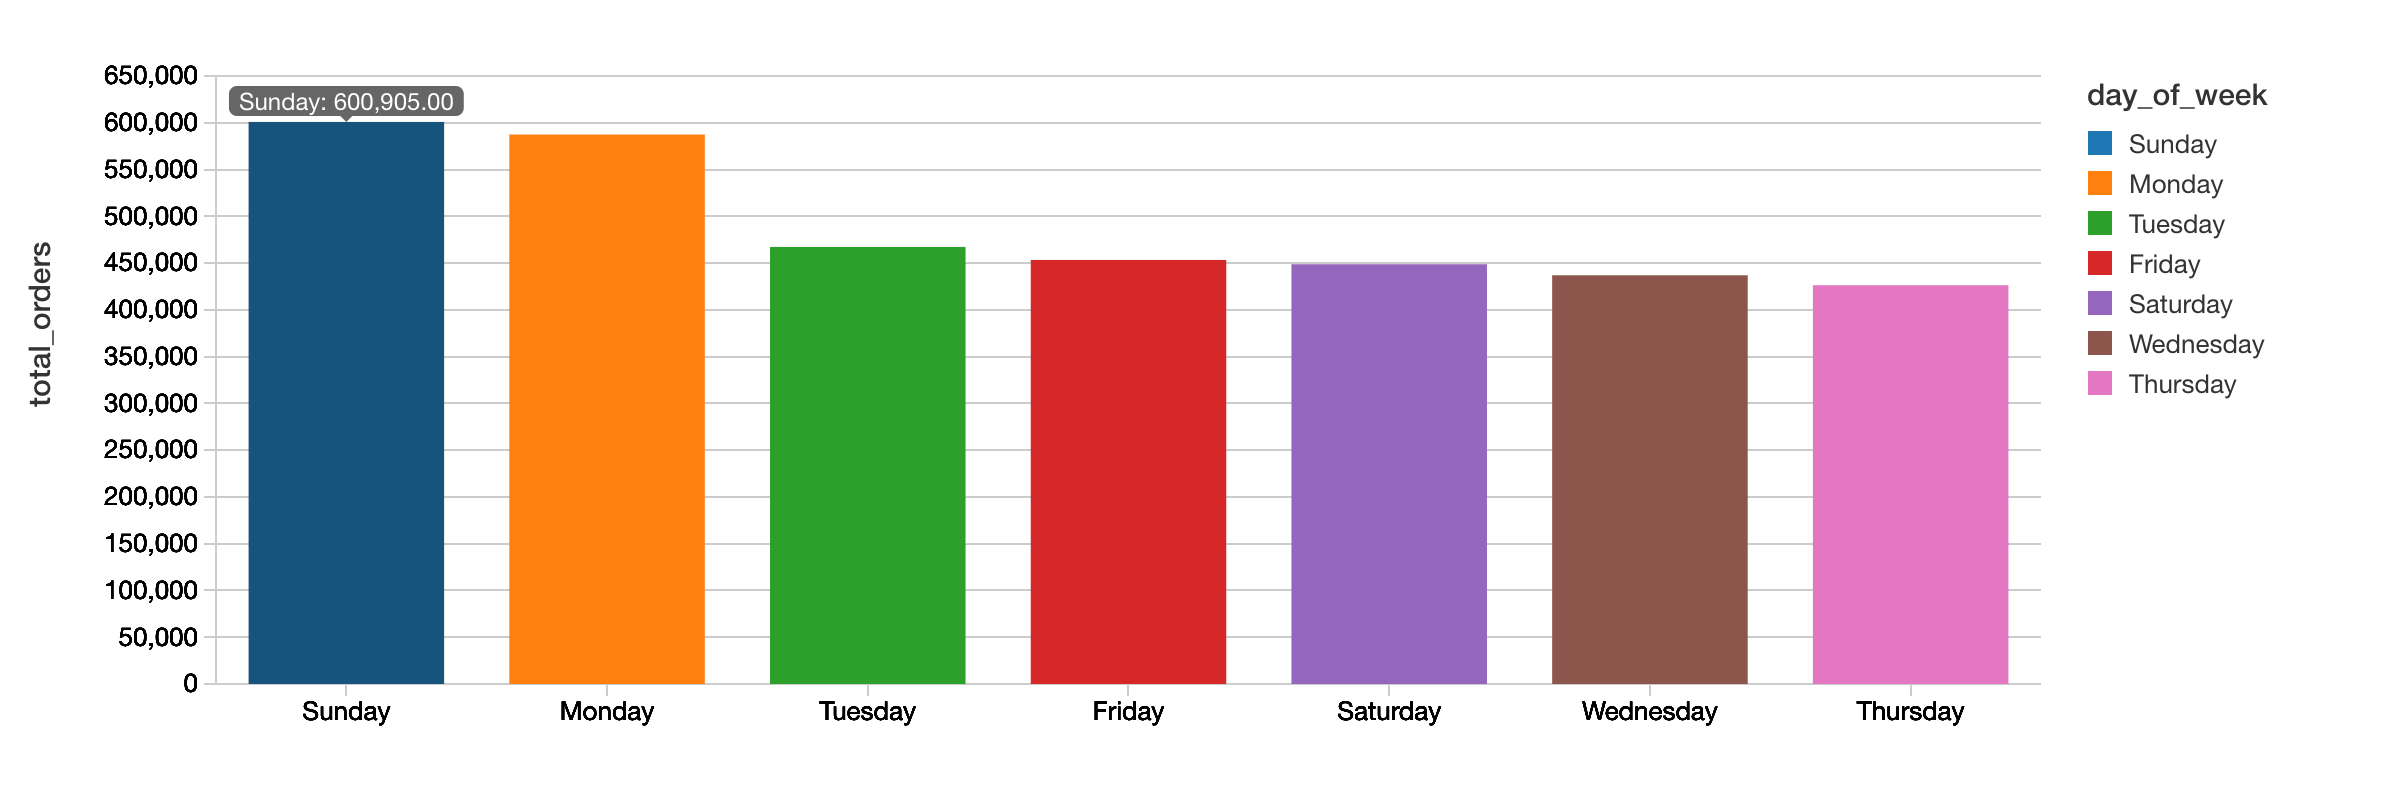
Orders by Day of Week
The following query allows you to quickly visualize that Sunday is the most popular day for the total number of orders while Thursday has the least number of orders.
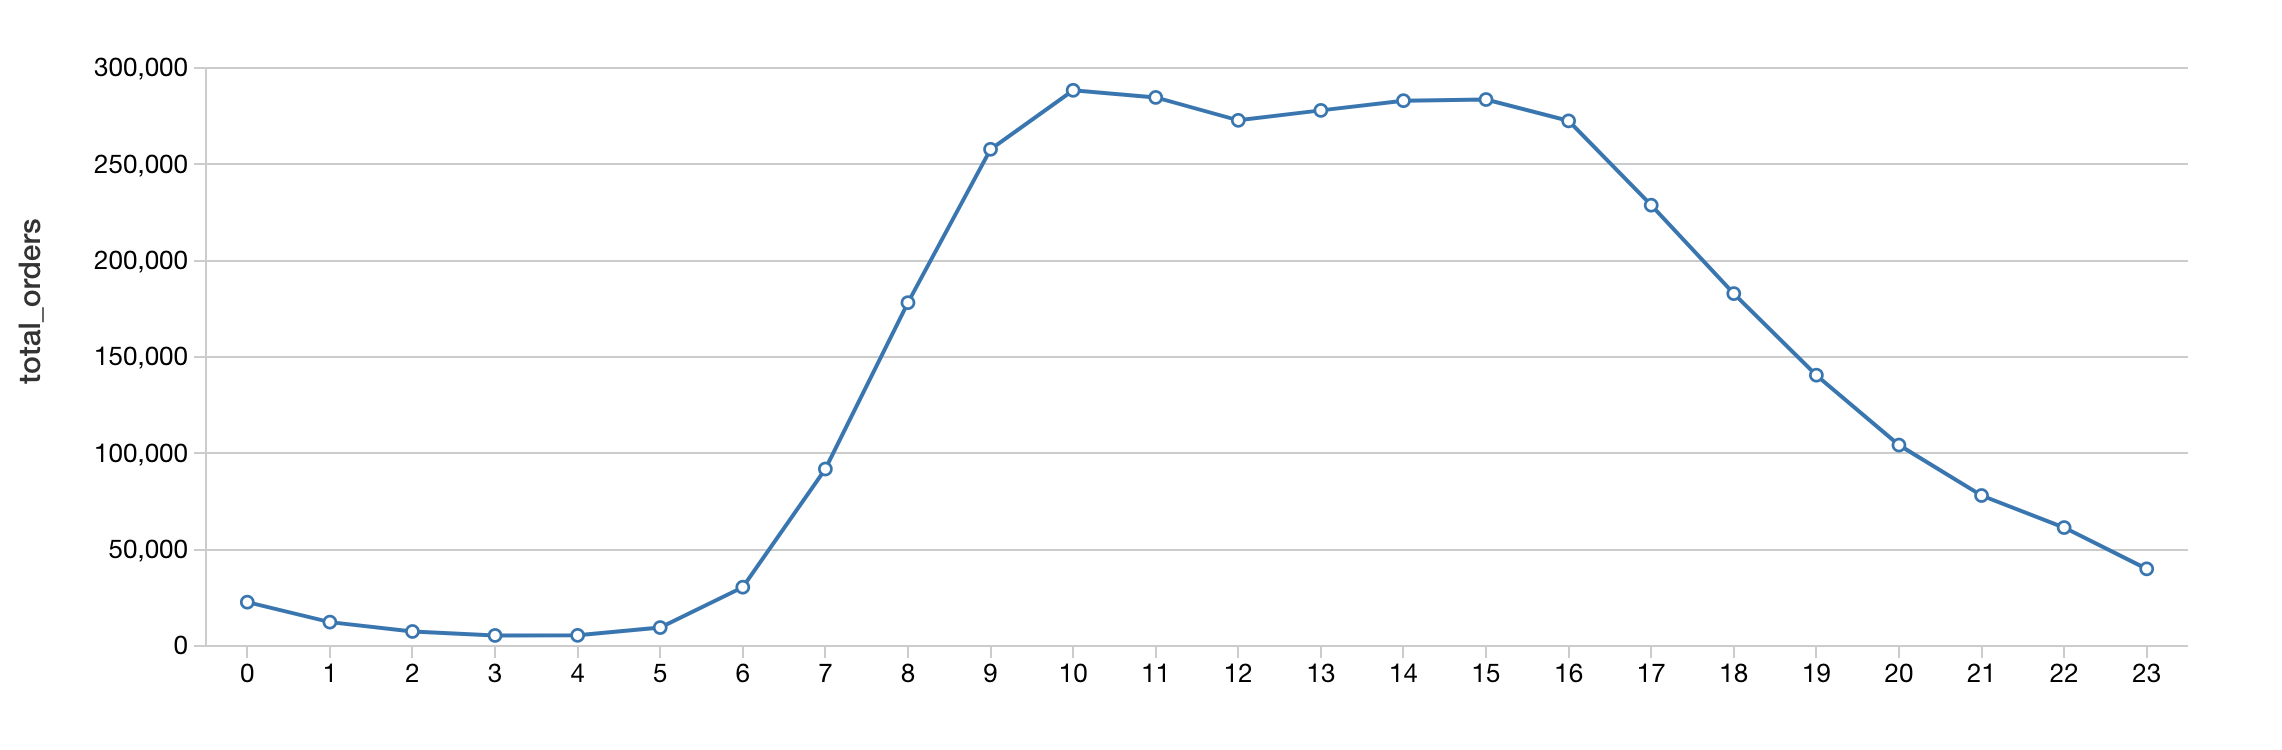
Orders by Hour
When breaking down the hours typically people are ordering their groceries from Instacart during business working hours with highest number orders at 10:00am.
Understand shelf space by department
As we dive deeper into our market basket analysis, we can gain insight on the number of products by department to understand how much shelf space is being used.
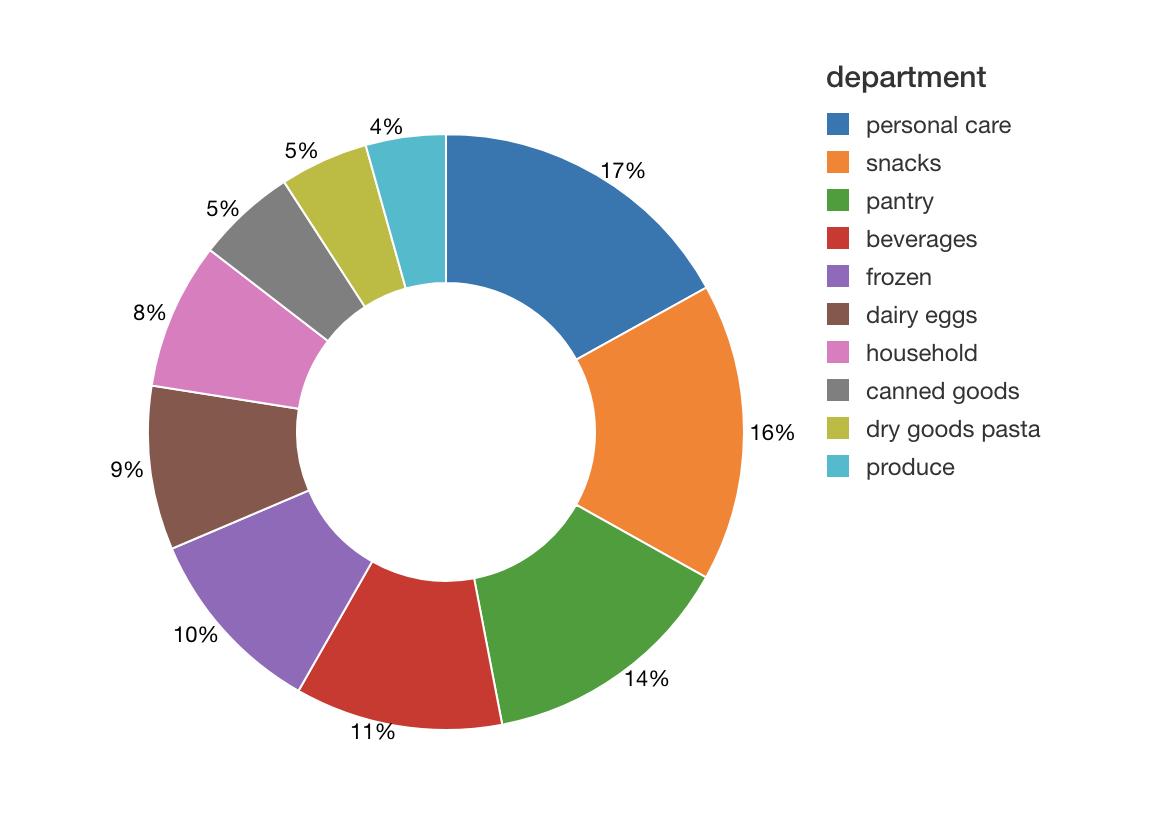
As can see from the preceding image, typically the number of unique items (i.e. products) involve personal care and snacks.
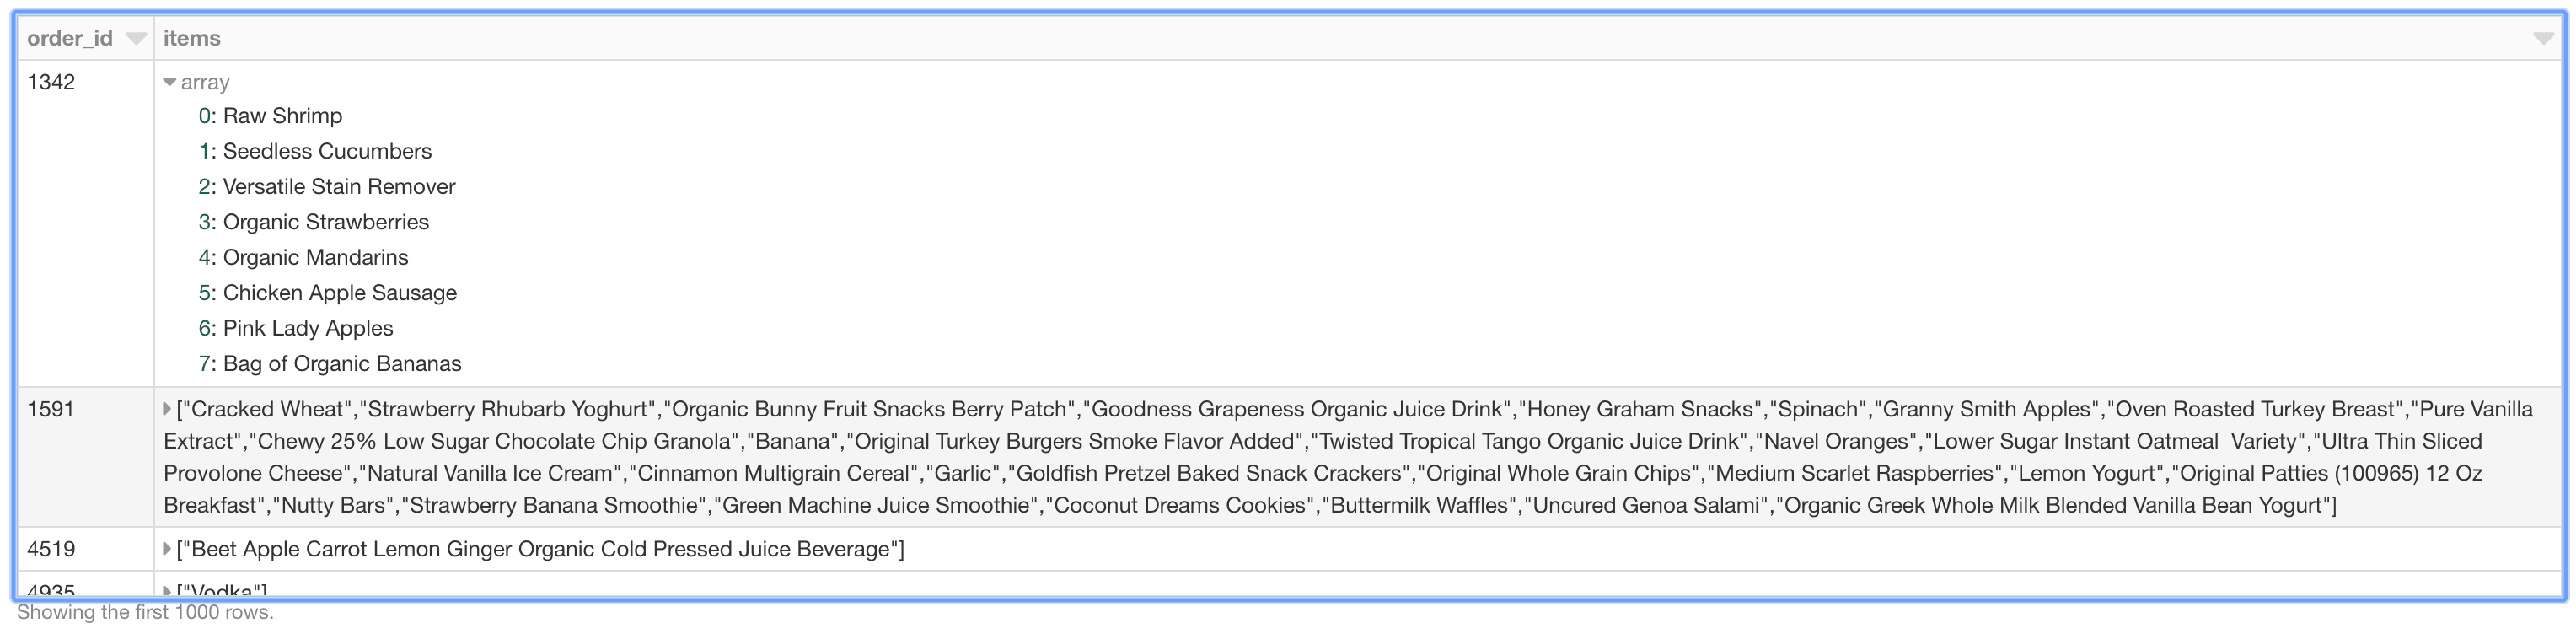
Organize Shopping Basket
To prepare our data for downstream processing, we will organize our data by shopping basket. That is, each row of our DataFrame represents an order_id with each items column containing an array of items.
Just like the preceding graphs, we can visualize the nested items using thedisplay command in our Databricks notebooks.
Train ML Model
To understand the frequency of items are associated with each other (e.g. how many times does peanut butter and jelly get purchased together), we will use association rule mining for market basket analysis. Spark MLlib implements two algorithms related to frequency pattern mining (FPM): FP-growth and PrefixSpan. The distinction is that FP-growth does not use order information in the itemsets, if any, while PrefixSpan is designed for sequential pattern mining where the itemsets are ordered. We will use FP-growth as the order information is not important for this use case.
Note, we will be using the Scala API so we can configure setMinConfidence
With Databricks notebooks, you can use the %scala to execute Scala code within a new cell in the same Python notebook.
With the mostPopularItemInABasket DataFrame created, we can use Spark SQL to query for the most popular items in a basket where there are more than 2 items with the following query.
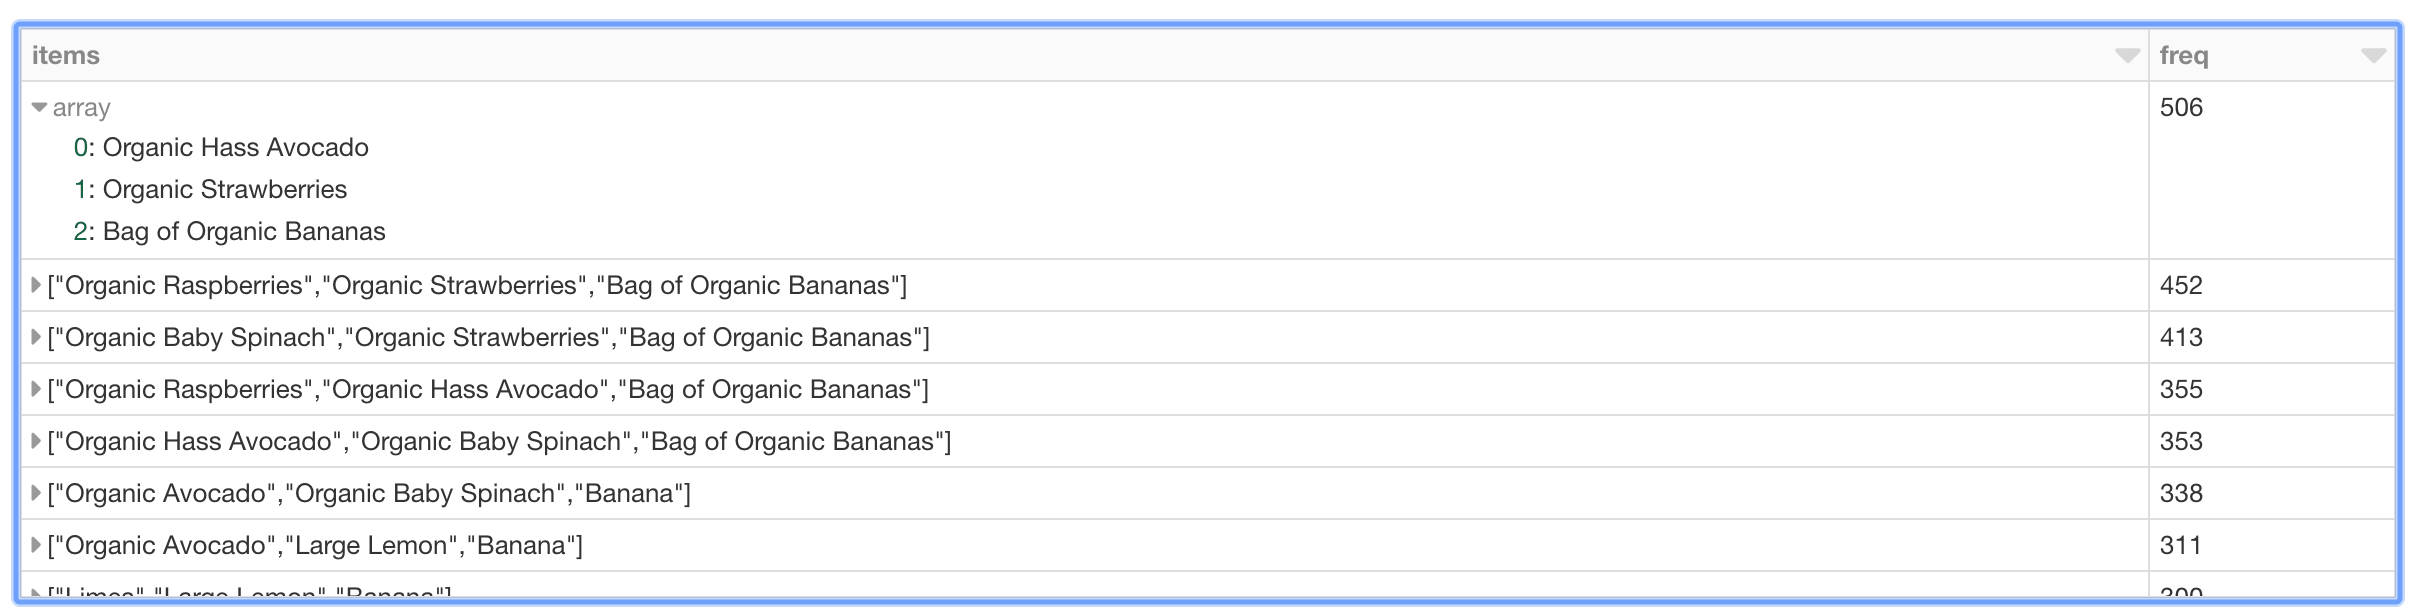
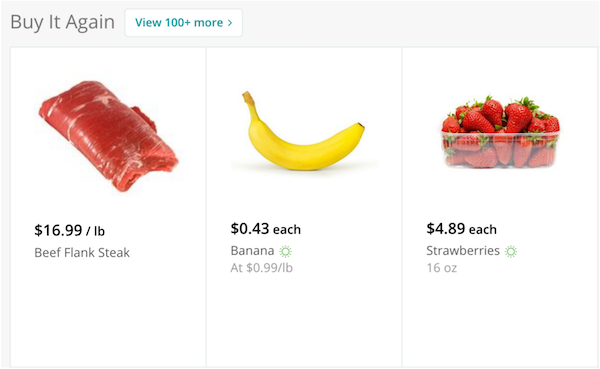
As can be seen in the preceding table, the most frequent purchases of more than two items involve organic avocados, organic strawberries, and organic bananas. Interesting, the top five frequently purchased together items involve various permutations of organic avocados, organic strawberries, organic bananas, organic raspberries, and organic baby spinach. From the perspective of recommendations, the freqItemsets can be the basis for the buy-it-again recommendation in that if a shopper has purchased the items previously, it makes sense to recommend that they purchase it again.
Review Association Rules
In addition to freqItemSets, the FP-growth model also generates associationRules. For example, if a shopper purchases peanut butter, what is the probability (or confidence) that they will also purchase jelly. For more information, a good reference is Susan Li's A Gentle Introduction on Market Basket Analysis — Association Rules.
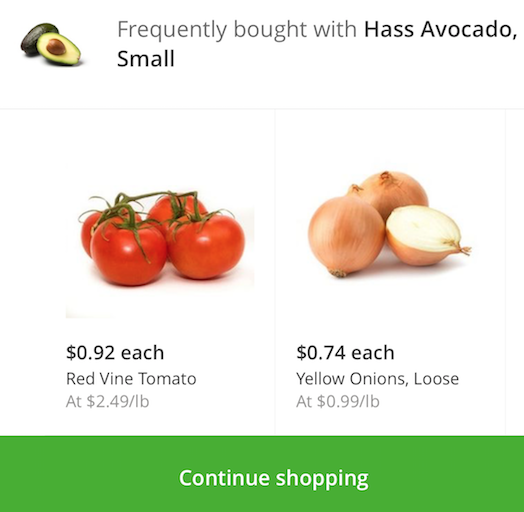
A good way to think about association rules is that model determines that if you purchased something (i.e. the antecedent), then you will purchase this other thing (i.e. the consequent) with the following confidence.
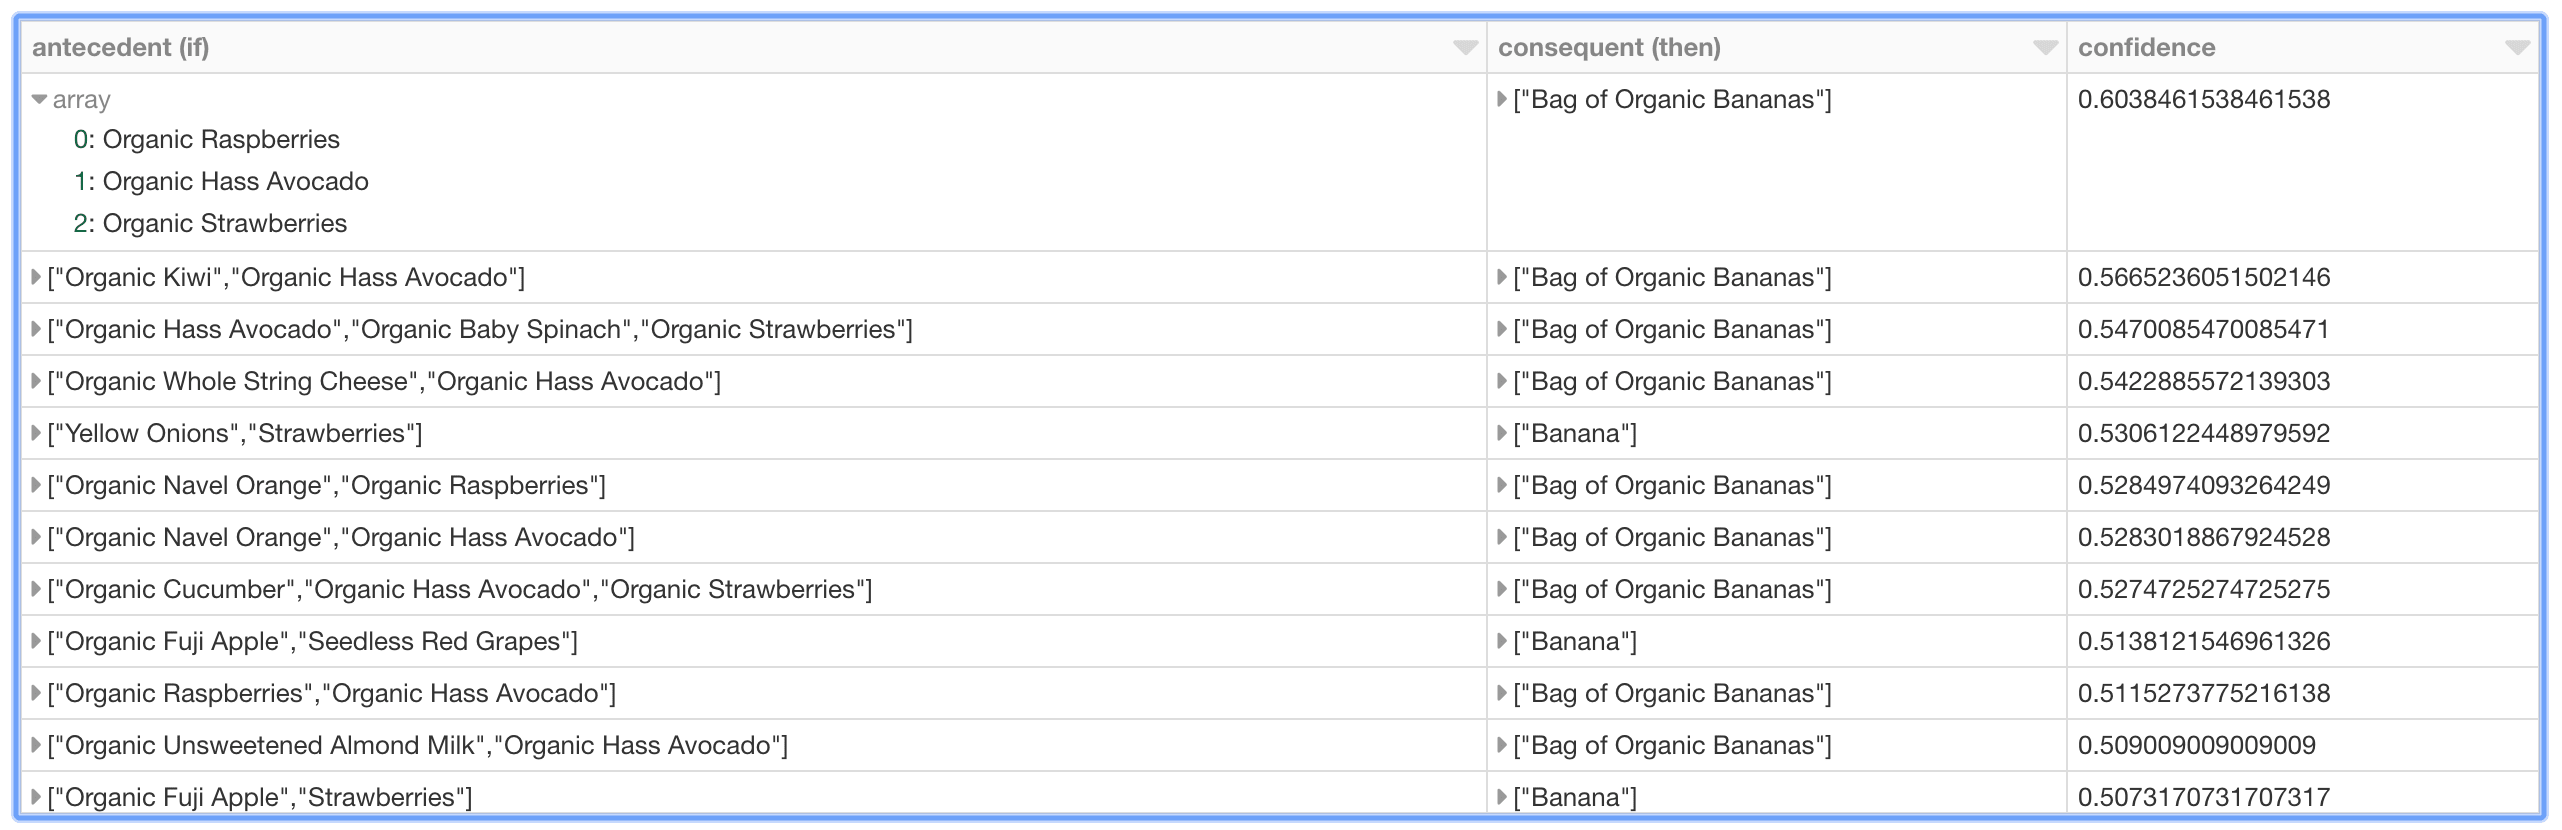
As can be seen in the preceding graph, there is relatively strong confidence that if a shopper has organic raspberries, organic avocados, and organic strawberries in their basket, then it may make sense to recommend organic bananas as well. Interestingly, the top 10 (based on descending confidence) association rules - i.e. purchase recommendations - are associated with organic bananas or bananas.
Discussion
In summary, we demonstrated how to explore our shopping cart data and execute market basket analysis to identify items frequently purchased together as well as generating association rules. By using Databricks, in the same notebook we can visualize our data; execute Python, Scala, and SQL; and run our FP-growth algorithm on an auto-scaling distributed Spark cluster - all managed by Databricks. Putting these components together simplifies the data flow and management of your infrastructure for you and your data practitioners. Try out the Market Basket Analysis using Instacart Online Grocery Dataset with Databricks today.
Get the latest posts in your inbox
Subscribe to our blog and get the latest posts delivered to your inbox.