MLflow, TensorFlow, and an Open Source Show
by Apurva Koti
This summer, I interned on the ML Platform team. I worked on MLflow, an open-source machine learning management framework.
This blog post details the projects I worked on, and my experience at Databricks overall. The automatic logging feature I developed makes it easier for data scientists to track their training sessions, without having to change any of their training code. I made improvements to MLflow's log_batch endpoint, which led to a dramatic decrease in logging time. Finally, I helped revamp MLflow's open-source community policies, which improved our GitHub issue response rate.
Automatic logging from Keras and TensorFlow
Tracking with MLflow
Training a machine learning model can be complex. It involves parameter tuning, iterating multiple times over a dataset, and so on. MLflow's tracking API makes it easier to find a suitable model, providing endpoints for logging metrics, parameters and other data from model training sessions. Data from multiple runs (a single execution of a training program) is centralized in the tracking server, which defaults to local storage if not set to an external database.
Let's take a look at how to add MLflow tracking to some existing ML code. We'll start with the IMDB sentiment analysis example from Keras, and add a callback with log statements, each of which log a single value.
Our data has been captured, and we can view visualizations through the MLflow UI.
Automatic Tracking
The tracking API is simple and straightforward to use for small training jobs. But adding log statements all over our code has a couple of downsides for more complicated jobs:
- It can be tedious.
- The presence of a lot of tracking code can make training code harder to reason about.
- It might make tracking more difficult to use for users less familiar with the technical details of the training.
What if we abstracted all those log statements behind a single function call that would log all the important information for you? We could take care of all those issues at once. Enter auto-logging.
For demonstration, I'll add the autolog function call to the same example as above.
After running the program, you can view the results in the MLflow UI.
https://www.youtube.com/watch?v=0A0mZ7fa2Lc
The autologger has produced a run corresponding to our single training pass. It contains the layer count, optimizer name, learning rate and epsilon value as parameters; loss and accuracy at each step of the training and validation stages; the model summary, as a tag; and finally, the model checkpoint as an artifact.
Under the Hood
The goal: automatically log important information with zero training code change.
In an ideal world, you wouldn't need any log statements if the relevant training functions (i.e. model.fit for Keras, estimator.train for TensorFlow Estimators, etc) internally called mlflow.log_metric when necessary. What if we made that happen?
Because functions are first-class values in Python, all you need to do is to build a wrapper function that does what you want, call the training function, and set the training function to point to the wrapper function! To simplify the process of getting/setting the functions, I used Gorilla.
Here's how mlflow.keras.autolog() really works:
We construct an instance of a callback that handles all the logging, and set model.fit to point to a wrapper function that inserts the instance into the arguments.
Log Batch Performance Optimizations
MLflow provides an endpoint for logging a batch of metrics, parameters and tags at once. This should be faster than logging each argument individually. Unfortunately, the implementation of this endpoint in Databricks was very slow - it made one database transaction per argument!
Switching to SQL batch operations allows us to fix this. These allow us to provide the entire argument set to the database interface, with just two transactions overall. The result is a 20x reduction in overall log time.
Improving Open-Source Community Interactions
MLflow's GitHub community presence is thriving, but still in its early stages. Community members were eager to contribute with pull requests and feature requests, but the lack of clearly defined channels made it difficult to keep up. A high number of issues were therefore unaddressed, and our community interaction was lacking.
In order to improve this, we needed to clearly delineate the purposes of each of these channels. I created a set of issue templates on GitHub:
- Bug reports
- Documentation fixes
- Feature requests
- Installation issues
Each template specified exactly the type of information needed. The result was higher-quality and more detailed issues, and a higher response rate.
We also held an issue bash event - a time to get together and close out outdated and easy-to-answer issues. We also unearthed three issues that we later fixed in MLflow 1.2!
Conclusion
These twelve weeks have been incredibly fast-paced and exciting, but most importantly, endlessly rewarding. I was constantly learning, thanks to the wide range of projects I worked on.
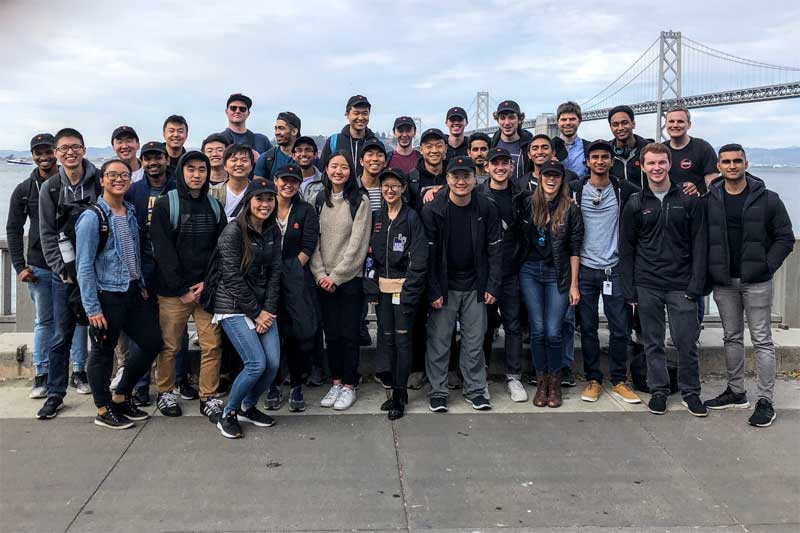
Throughout the summer, my team and I made sure to regularly leave the office for all kinds of great events and bonding.

Run into us on the way to a Giants game…


...grilling scones on Angel Island…

...or exploring the San Francisco restaurant scene every other Monday!
You'll find the most hard-working, intelligent, humble, and friendly people at Databricks, all of whom are happy to see an intern succeed and make an impact. Everyone was open to my opinions and feedback from day one. I found a wealth of resources in my coworkers, from career guidance to knowledge about the technology I was being introduced to. Between the fun intern events, the smooth onboarding, the fascinating work and the awesome culture, I found in Databricks an all-around class act in how to run an internship.
Finally, a special thanks goes to my awesome teammates for a great summer - my mentor Sid Murching, my manager Paul Ogilvie, and the entire ML Platform team.
Get the latest posts in your inbox
Subscribe to our blog and get the latest posts delivered to your inbox.