Building Foot-Traffic Insights Dataset
Where should I build my next coffee shop?
Businesses want to understand both the physical world around them and how people interact with the physical world. Where should I build my next coffee shop? How far away are my 3 closest coffee competitors? How far are people traveling to get to my stores? Which other brands do people visit before and after they visit mine?
These questions are no-doubt interesting for urban planners, advertisers, hedge funds, and brick-and-mortar businesses. But they also hint at an interesting technical problem: machine learning at scale. Building a dataset to answer these questions comprehensively is a massively difficult computation problem because it requires heavy machine learning at a significant scale. And throughout this post, we’ll tell you exactly how we solved it.
What data do I need?
First, some context on SafeGraph. Our goal is to be the one-stop-shop for anyone seeking to understand the physical places around them — restaurants, airports, colleges, salons...the list goes on.
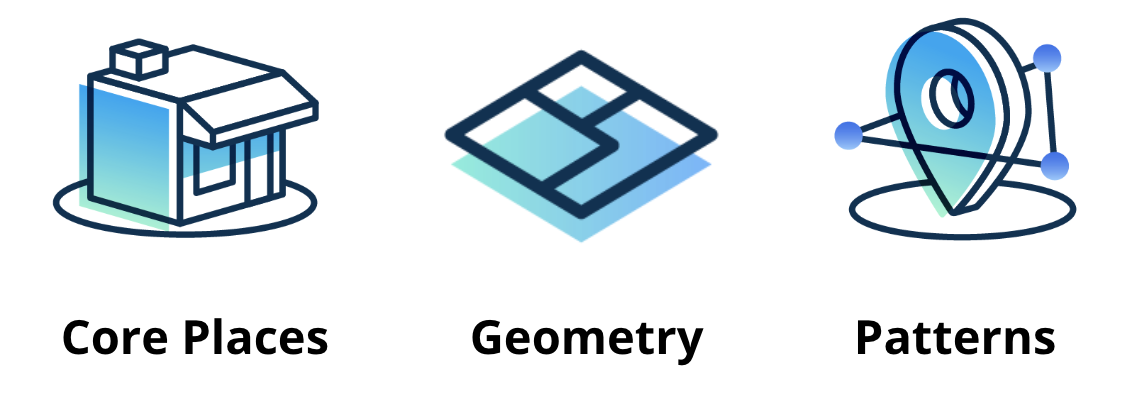
To serve this mission, we create datasets that represent the world around us. One such dataset is our Core Places product, which is a listing of 5MM+ businesses around the country, complete with rich information like category and open hours. This dataset is complemented by Geometry, a supplementary dataset that associates each place with a geofence to indicate the building’s physical footprint. Below are SafeGraph’s 3 main datasets, each of which tells a different story of the physical around. This post is about how we built Patterns, a dataset about the physical places around us and how humans interact with them.
Patterns - how do humans interact with physical places?
Ultimately, we wanted Patterns to be keyed by safegraph_place_id, which is our canonical identifier for each place in our dataset. Each row would be a unique physical place, and we planned to compute a set of columns for each place which collectively described how people interacted with it. Some examples of columns we compute include the number of visitors, the hours throughout the day in which the place is most popular, and a list of other brands that people visited before or after visiting the place in question.
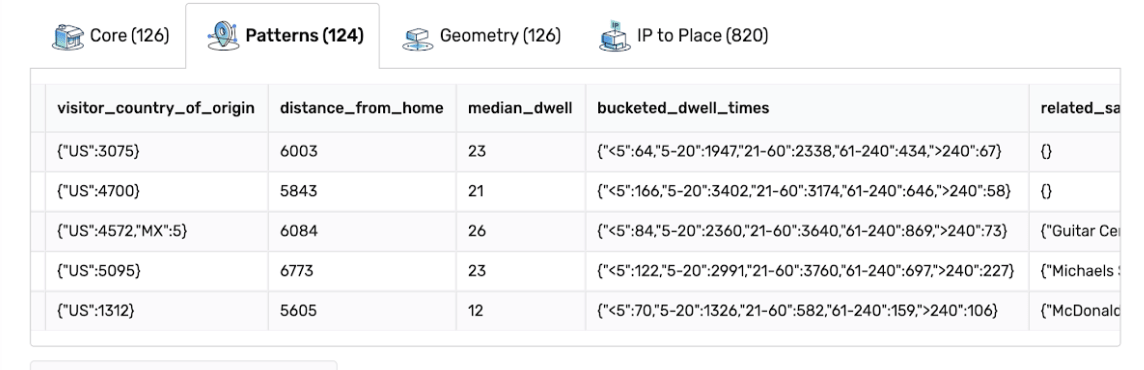
A few columns of our Patterns dataset, from shop.safegraph.com. Use the coupon code data4databricksers for $100 in free points-of-interest, building footprint, and foot-traffic insights data.
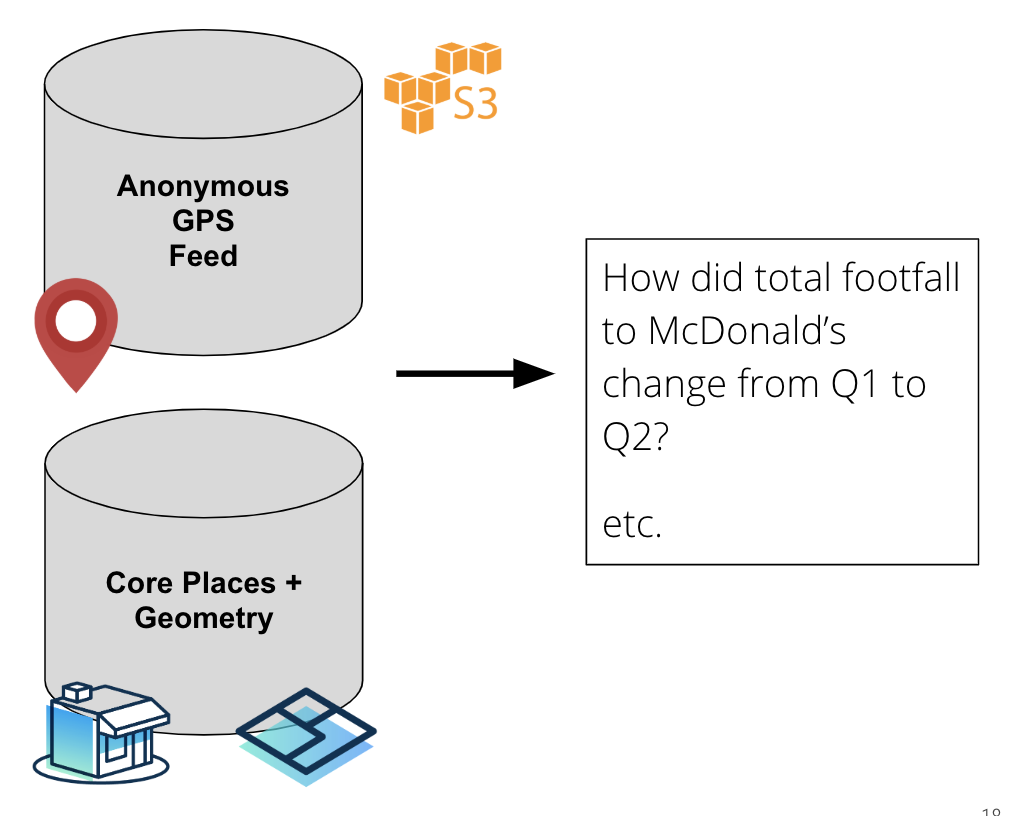
To build this mapping between places and visit statistics, we first needed to build an internal dataset which associated our anonymous, internal GPS feed to the physical places in Places using our dataset of geofences. Once we had a dataset which associated clusters of GPS points to our safegraph_place_id key (we call each association a� visit), we could simply “roll-up” the data by our key to build Patterns. In many ways, the core technical challenge came down to building this dataset of visits.
We started with three core ingredients: (1) Places, a dataset of points of interest around the US, (2) Geometry, the physical building footprints for those places, and (3) a daily, anonymized feed of GPS data sourced from apps.
Because GPS data is inherently very noisy and is often only accurate to about 100m, we needed a machine learning model to elucidate signal from the noise and serve the predictions. On top of that, we needed data pipelines to ingest the GPS feed, cluster it, and build features out of the clusters and Places dataset. Below, we tell the (somewhat harrowing) story of how we did just that (And, if you’re curious about we developed the model itself, feel free to check out our visit attribution whitepaper here).
Building out the patterns architecture
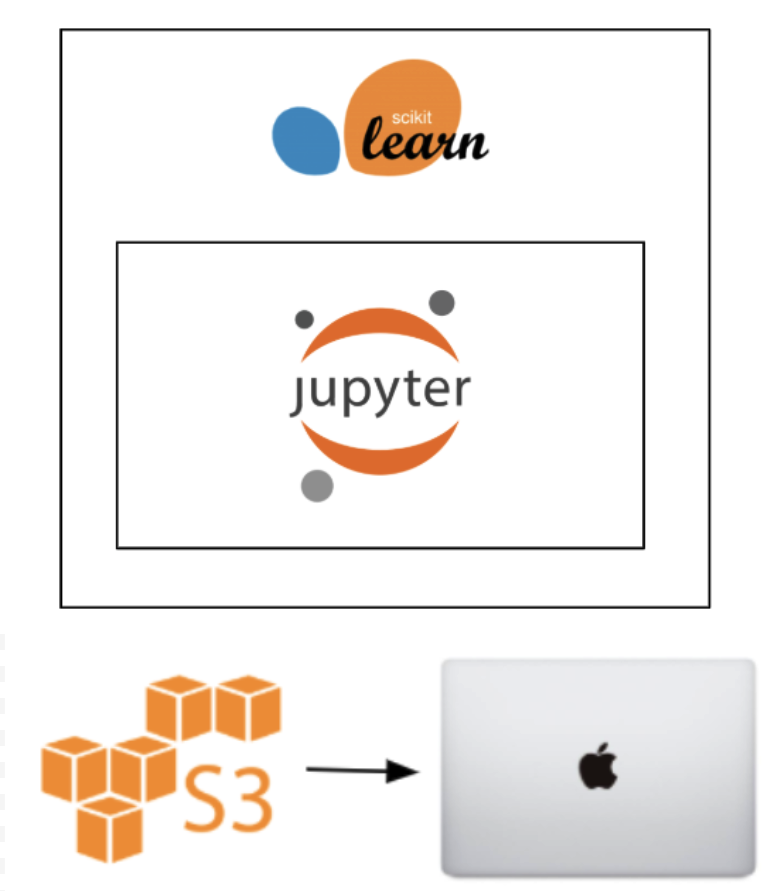
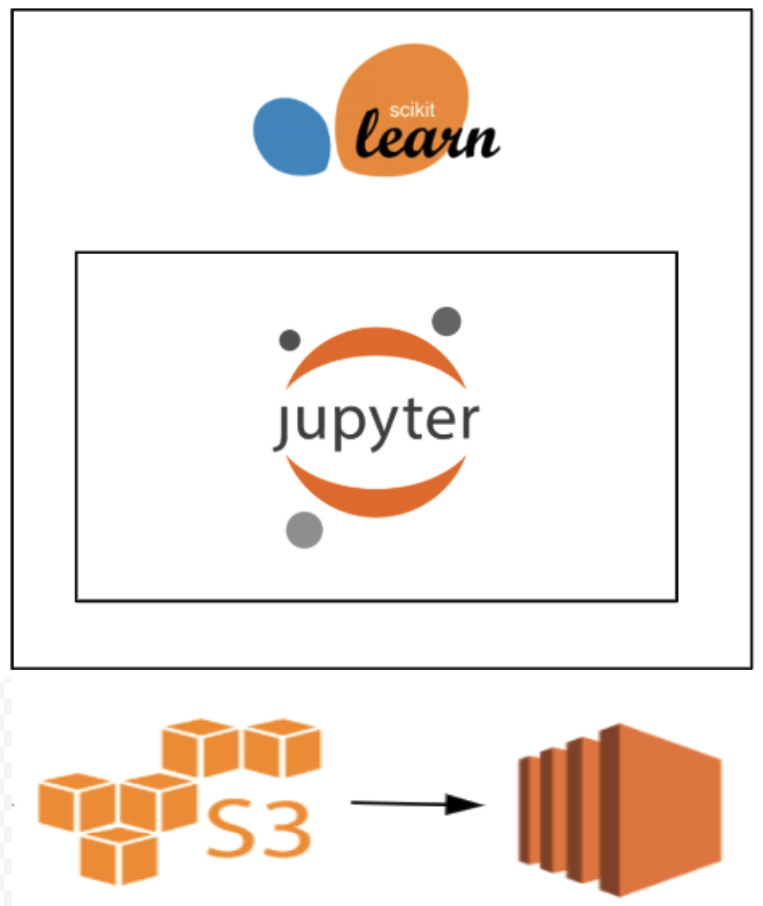
We first decided to tackle this big-data project with small-data tools — namely, scikit-learn models developed locally on Jupyter notebooks — because those were what we were comfortable with. The only role Databricks played was when we used it to read in training data from S3 and sample to a fraction of a percent. We then coalesced the data into a single CSV and downloaded it onto a Macbook.
And, for the most part, we could indeed get a reasonable model up and running, but it was only able to train on 25 MB of data, and the moment we doubled that, the computer froze. It became clear only after we developed the initial model that this architecture wouldn’t take us very far. The grand lesson? If your Macbook Pro is a part of your data pipeline, you’ve gone too far. That is rarely the optimal way to build something production-ready.
We’d like to say we pivoted quickly to technologies that made developing a truly scalable solution trivial, but that didn’t happen just yet. We next provisioned an admittedly expensive EC2 box, retrained a model on 1% of our training data, and run a single day’s worth of production-ready inputs through the box. And the model seemed to be predicting as expected!
But “success” here wasn’t just prediction accuracy — it was also prediction time. And our setup took 12 hours to churn through a single day’s worth of input data. At that rate, the model wouldn’t compute in time to get into the customer’s hands.
After two failed attempts, it came time to buckle down and bite the proverbial bullet with production-ready technologies that we were unfamiliar with but which we were confident would get the job done.
We started by scrapping our single-threaded models and training a fully distributed SparkML forest in a Databricks notebook. The UI mirrored what we had seen in Jupyter, and the time we lost in learning the ins-and-outs of SparkML was more than made up for in the reduced training time. Training a toy model on 1% of our training data had previously taken 45 minutes, but with Spark on Databricks, we were able to tune through (literally) hundreds of models before finding one which was significantly better (and, not to mention, faster) than what we had achieved on the EC2 box.
Once we had our feet wet, building the pre-model and post-model data pipeline became less intimidating. We wrote the data pipelines directly in Databricks notebooks, and, once we had confirmed they were correct, we migrated them to jars and uploaded to S3. We also saved our Spark model into a binary and uploaded to S3 as well, along with a simple Python wrapper over the model to actually serve predictions.
We just had to figure out how to get this thing running reliably. Luckily, SafeGraph had already spun up an Airflow Instance, so all we needed to do was create a new DAG and link the jars and Python egg together. We configured it to run every morning, and, just like that, we had a battle-tested, production-ready machine learning pipeline.
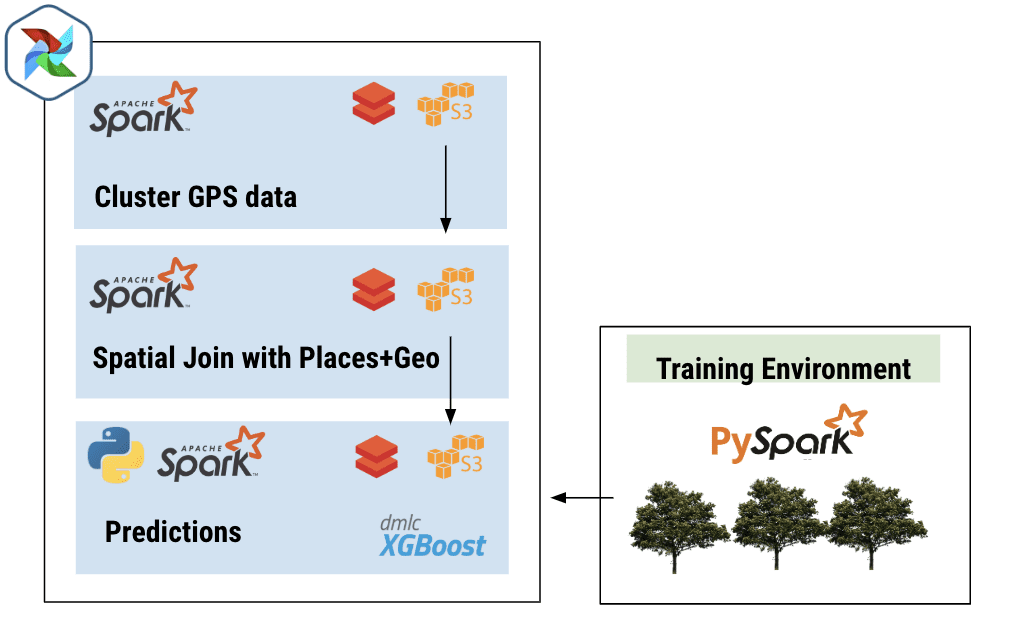
Once we had our pipeline set, generating Patterns became simple. This pipeline executes every morning before we wake up, and it writes its output to a directory in S3. At the end of each month, we run a simple Databricks job to read in every path that was generated throughout the previous 30 days and to perform a “roll-up” into Patterns. Once the roll-up is done, the data is published on shop.safegraph.com, where customers can download slices by location, category, or brand.
Big-data problems are not solved on laptops
If struggling through this pipeline has taught us anything, it’s that we should be using big-data tech — not small-data tech, like a 2017 Space Gray Macbook Pro — to solve big-data problems. Switching to Databricks, leveraging Spark ML, and managing our pipelines with Airflow took us from a 12-hour runtime to just under an hour — which is not only a huge time saving but also gives us jaw-dropping cost savings, too.
We began this project because we were tasked with building a dataset to allow people to understand how groups of people interact with the physical world around us. The Patterns dataset can help people answer lofty questions about society, and, in hindsight, it’s not surprising that building it requires just as lofty an approach.
Oh, and if you’re interested in checking out this data (or if you just don’t want our hard work to go to waste), head on over to shop.safegraph.com and use the coupon code data4databricksers for $100 in free points-of-interest, building footprint, and foot-traffic insights data.
Get the latest posts in your inbox
Subscribe to our blog and get the latest posts delivered to your inbox.