Monitor Your Databricks Workspace with Audit Logs
by Craig Ng and Miklos Christine
Cloud computing has fundamentally changed how companies operate - users are no longer subject to the restrictions of on-premises hardware deployments such as physical limits of resources and onerous environment upgrade processes. With the convenience and flexibility of cloud services comes challenges on how to properly monitor how your users utilize these conveniently available resources. Failure to do so could result in problematic and costly anti-patterns (with both cloud provider core resources and a PaaS like Databricks). Databricks is cloud-native by design and thus tightly coupled with the public cloud providers, such as Microsoft and Amazon Web Services, fully taking advantage of this new paradigm, and the audit logs capability provides administrators a centralized way to understand and govern activity happening on the platform. Administrators could use Databricks audit logs to monitor patterns like the number of clusters or jobs in a given day, the users who performed those actions, and any users who were denied authorization into the workspace.
In the first blog post of the series, Trust but Verify with Databricks, we covered how Databricks admins could use Databricks audit logs and other cloud provider logs as complementary solutions for their cloud monitoring scenarios. The main purpose of Databricks audit logs is to allow enterprise security teams and platform administrators to track access to data and workspace resources using the various interfaces available in the Databricks platform. In this article, we will cover, in detail, how those personas could process and analyze the audit logs to track resource usage and identify potentially costly anti-patterns.
Audit Logs ETL Design
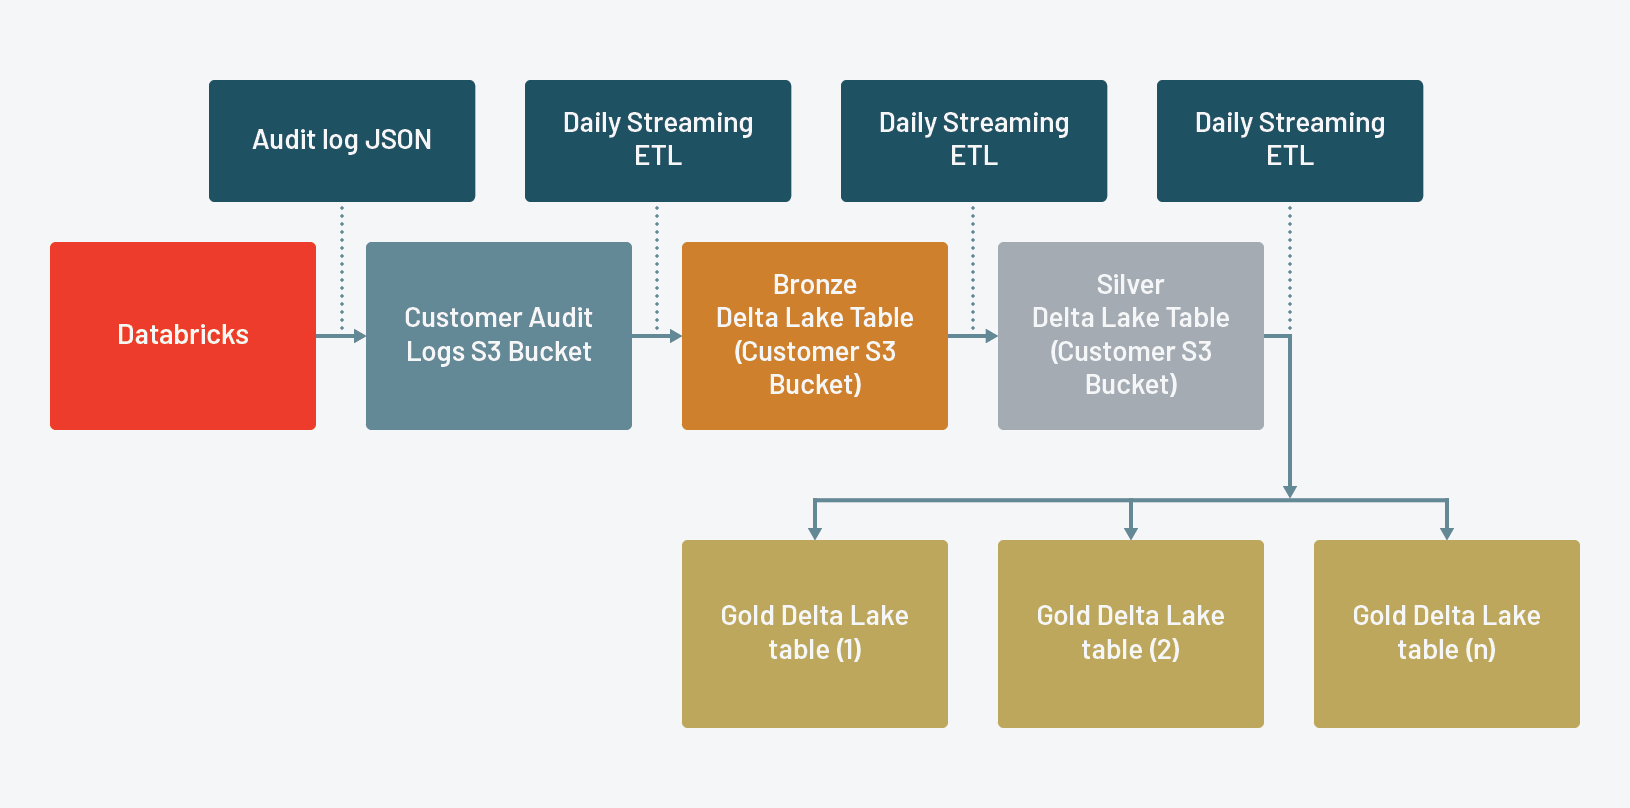
Databricks delivers audit logs for all enabled workspaces as per delivery SLA in JSON format to a customer-owned AWS S3 bucket. These audit logs contain events for specific actions related to primary resources like clusters, jobs, and the workspace. To simplify delivery and further analysis by the customers, Databricks logs each event for every action as a separate record and stores all the relevant parameters into a sparse StructType called requestParams.
In order to make this information more accessible, we recommend an ETL process based on Structured Streaming and Delta Lake.
- Utilizing Structured Streaming allows us to:
- Leave state management to a construct that’s purpose built for state management. Rather than having to reason about how much time has elapsed since our previous run to ensure that we’re only adding the proper records, we can utilize Structured Streaming’s checkpoints and write-ahead log to ensure that we’re only processing the newly added audit log files. We can design our streaming queries as triggerOnce daily jobs which are like pseudo-batch jobs
- Utilizing Delta Lake allows us to do the following:
- Gracefully handle schema evolution, specifically with regards to the requestParams field, which may have new StructField based on new actions tracked in the audit logs
- Easily utilize table to table streams
- Take advantage of specific performance optimizations like OPTIMIZE to maximize read performance
For reference, this is the medallion reference architecture that Databricks recommends:
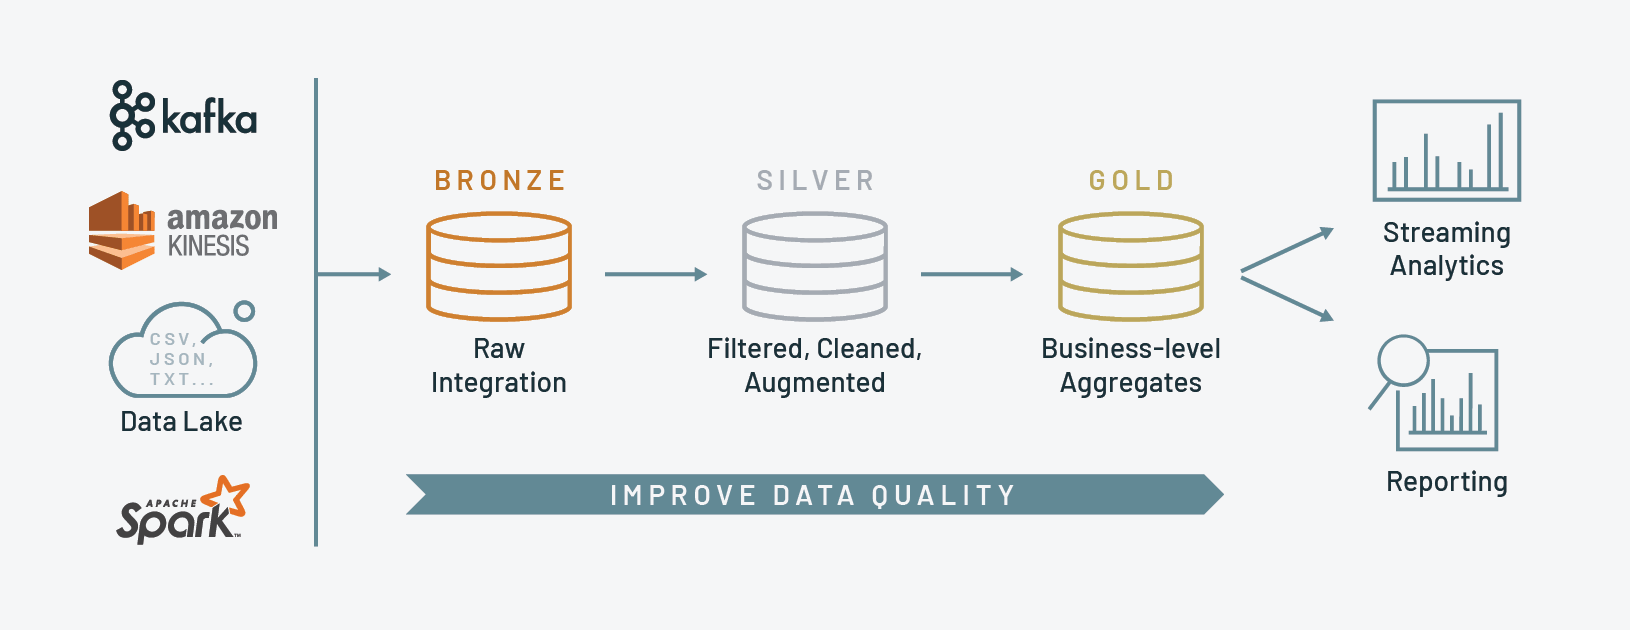
Bronze: the initial landing zone for the pipeline. We recommend copying data that’s as close to its raw form as possible to easily replay the whole pipeline from the beginning, if needed
Silver: the raw data get cleansed (think data quality checks), transformed and potentially enriched with external data sets
Gold: production-grade data that your entire company can rely on for business intelligence, descriptive statistics, and data science / machine learning
Following our own medallion architecture, we break it out as follows for our audit logs ETL design:
Raw Data to Bronze Table
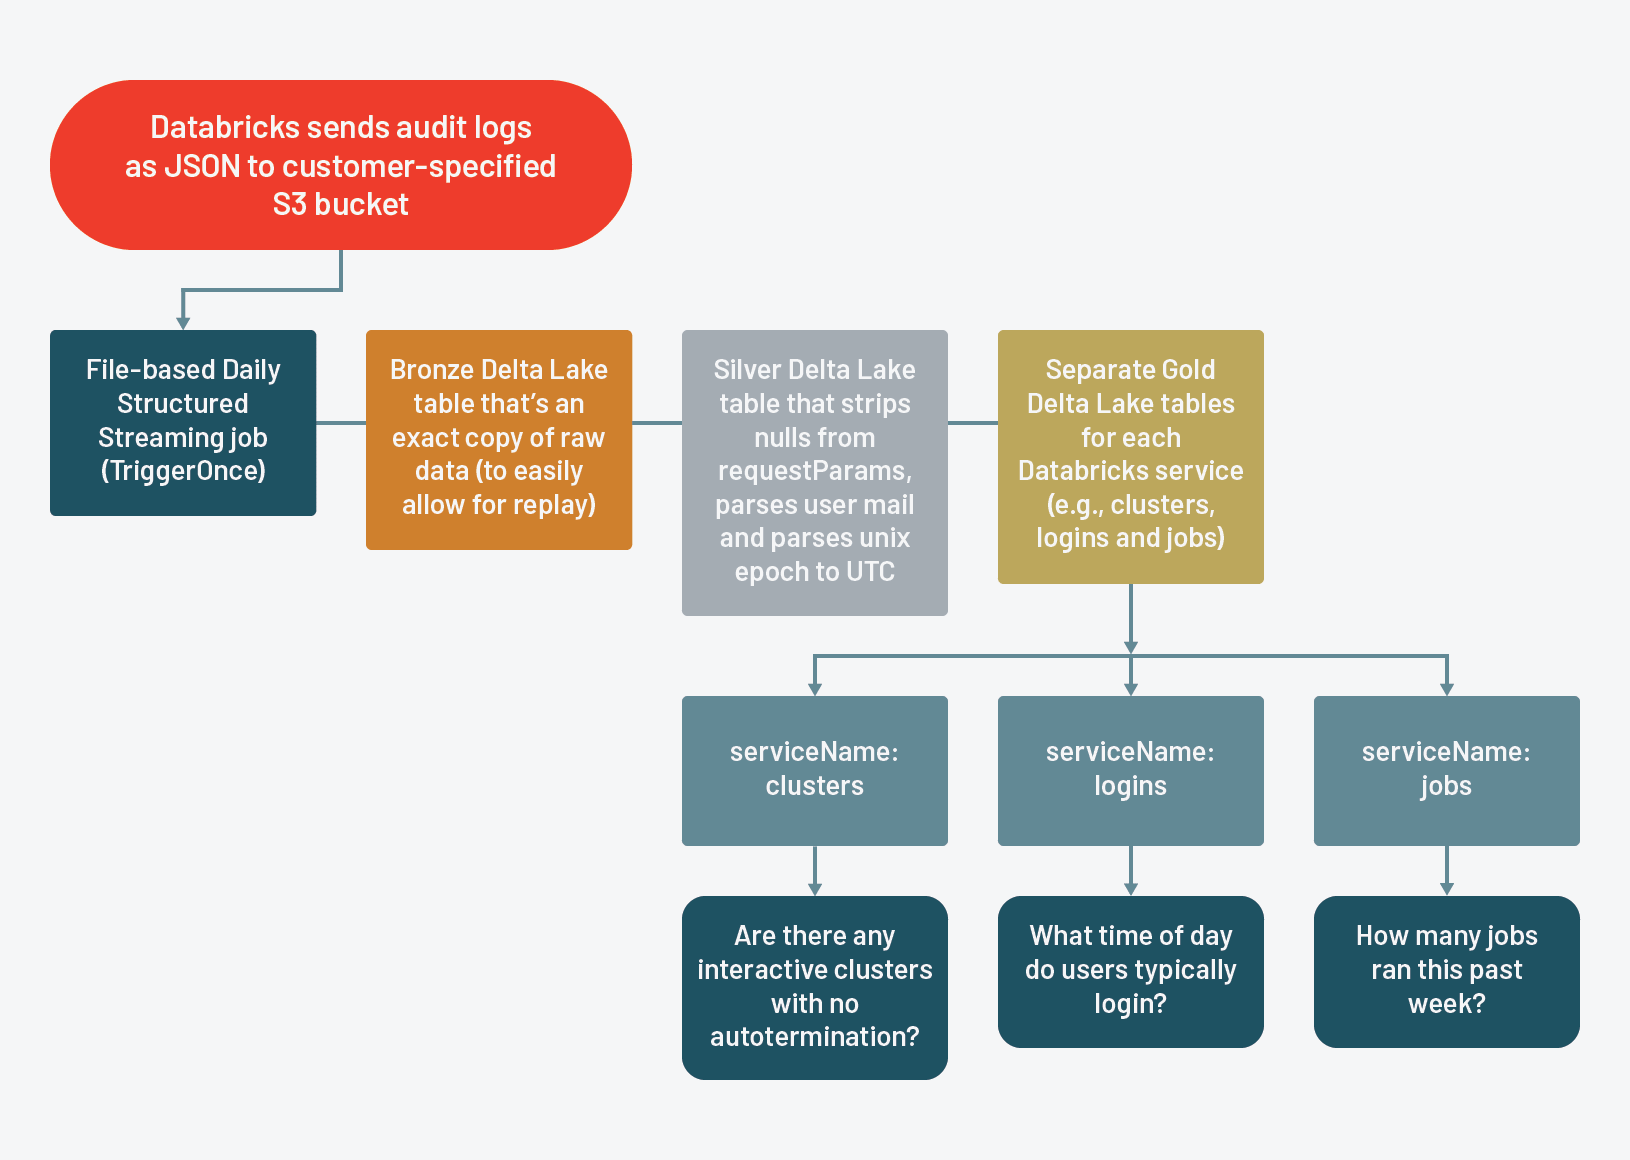
Stream from the raw JSON files that Databricks delivers using a file-based Structured Stream to a bronze Delta Lake table. This creates a durable copy of the raw data that allows us to replay our ETL, should we find any issues in downstream tables.

Databricks delivers audit logs to a customer-specified AWS S3 bucket in the form of JSON. Rather than writing logic to determine the state of our Delta Lake tables, we're going to utilize Structured Streaming's write-ahead logs and checkpoints to maintain the state of our tables. In this case, we've designed our ETL to run once per day, so we're using a file source with triggerOnce to simulate a batch workload with a streaming framework. Since Structured Streaming requires that we explicitly define the schema, we'll read the raw JSON files once to build it.
We’ll then instantiate our StreamReader using the schema we inferred and the path to the raw audit logs.
We then instantiate our StreamWriter and write out the raw audit logs into a bronze Delta Lake table that's partitioned by date.
Now that we've created the table on an AWS S3 bucket, we'll need to register the table to the Databricks Hive metastore to make access to the data easier for end users. We'll create the logical database audit_logs, before creating the Bronze table.
If you update your Delta Lake tables in batch or pseudo-batch fashion, it's best practice to run OPTIMIZE immediately following an update.
Bronze to Silver Table
Stream from a bronze Delta Lake table to a silver Delta Lake table such that it takes the sparse requestParams StructType and strips out all empty keys for every record, along with performing some other basic transformations like parsing email address from a nested field and parsing UNIX epoch to UTC timestamp.

Since we ship audit logs for all Databricks resource types in a common JSON format, we've defined a canonical struct called requestParams which contains a union of the keys for all resource types. Eventually, we're going to create individual tables for each service, so we want to strip down the requestParams field for each table so that it contains only the relevant keys for the resource type. To accomplish this, we define a user-defined function (UDF) to strip away all such keys in requestParams that have null values.
We instantiate a StreamReader from our bronze Delta Lake table:
We then apply the following transformations to the streaming data from the bronze Delta Lake table:
- strip the
nullkeys fromrequestParamsand store the output as a string - parse
emailfromuserIdentity - parse an actual timestamp / timestamp datatype from the
timestampfield and store it indate_time - drop the raw
requestParamsanduserIdentity
We then stream those transformed records into the SIlver Delta Lake table:
Again, since we’ve created a table based on an AWS S3 bucket, we’ll want to register it with the vive Metastore for easier access.
Although Structured Streaming guarantees exactly once processing, we can still add an assertion to check the counts of the Bronze Delta Lake table to the SIlver Delta Lake table.
As for the bronze table earlier, we’ll run OPTIMIZE after this update for the silver table as well.
Silver to Gold Tables
Stream to individual gold Delta Lake tables for each Databricks service tracked in the audit logs
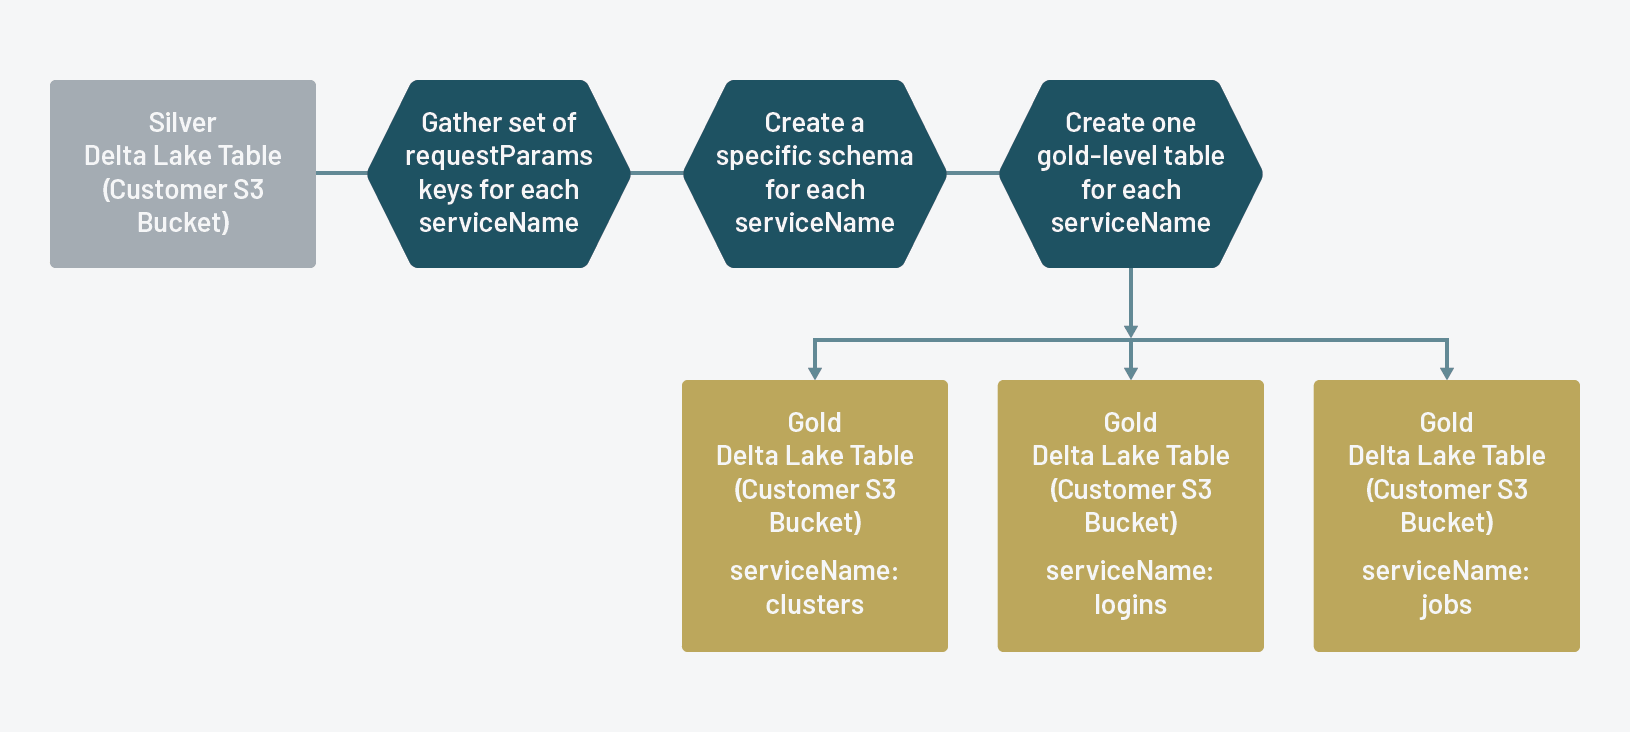
The gold audit log tables are what the Databricks administrators will utilize for their analyses. With the requestParams field pared down at the service level, it’s now much easier to get a handle on the analysis and what’s pertinent. With Delta Lake’s ability to handle schema evolution gracefully, as Databricks tracks additional actions for each resource type, the gold tables will seamlessly change, eliminating the need to hardcode schemas or babysit for errors.
In the final step of our ETL process, we first define a UDF to parse the keys from the stripped down version of the original requestParams field.
For the next large chunk of our ETL, we’ll define a function which accomplishes the following:
- gathers the keys for each record for a given
serviceName(resource type) - creates a set of those keys (to remove duplicates)
- creates a schema from those keys to apply to a given
serviceName(if the serviceName does not have any keys inrequestParams, we give it one key schema calledplaceholder) - write out to individual gold Delta Lake tables for each
serviceNamein the silver Delta Lake table
We extract a list of all unique values in serviceName to use for iteration and run above function for each value of serviceName:
As before, register each Gold Delta Lake table to the Hive Metastore:
Then run OPTIMIZE on each table:
Again as before, asserting that the counts are equal is not necessary, but we do it nonetheless:
We now have a gold Delta Lake table for each serviceName (resource type) that Databricks tracks in the audit logs, which we can now use for monitoring and analysis.
Audit Log Analysis
In the above section, we process the raw audit logs using ETL and include some tips on how to make data access easier and more performant for your end users. The first notebook included in this article pertains to that ETL process.
The second notebook we’ve included goes into more detailed analysis on the audit log events themselves. For the purpose of this blog post, we’ll focus on just one of the resource types - clusters, but we’ve included analysis on logins as another example of what administrators could do with the information stored in the audit logs.
It may be obvious to some as to why a Databricks administrator may want to monitor clusters, but it bears repeating: cluster uptime is the biggest driver of cost and we want to ensure that our customers get maximum value while they’re utilizing Databricks clusters.
A major portion of the cluster uptime equation is the number of clusters created on the platform and we can use audit logs to determine the number of Databricks clusters created on a given day.
By querying the clusters’ gold Delta Lake table, we can filter where actionName is create and perform a count by date.
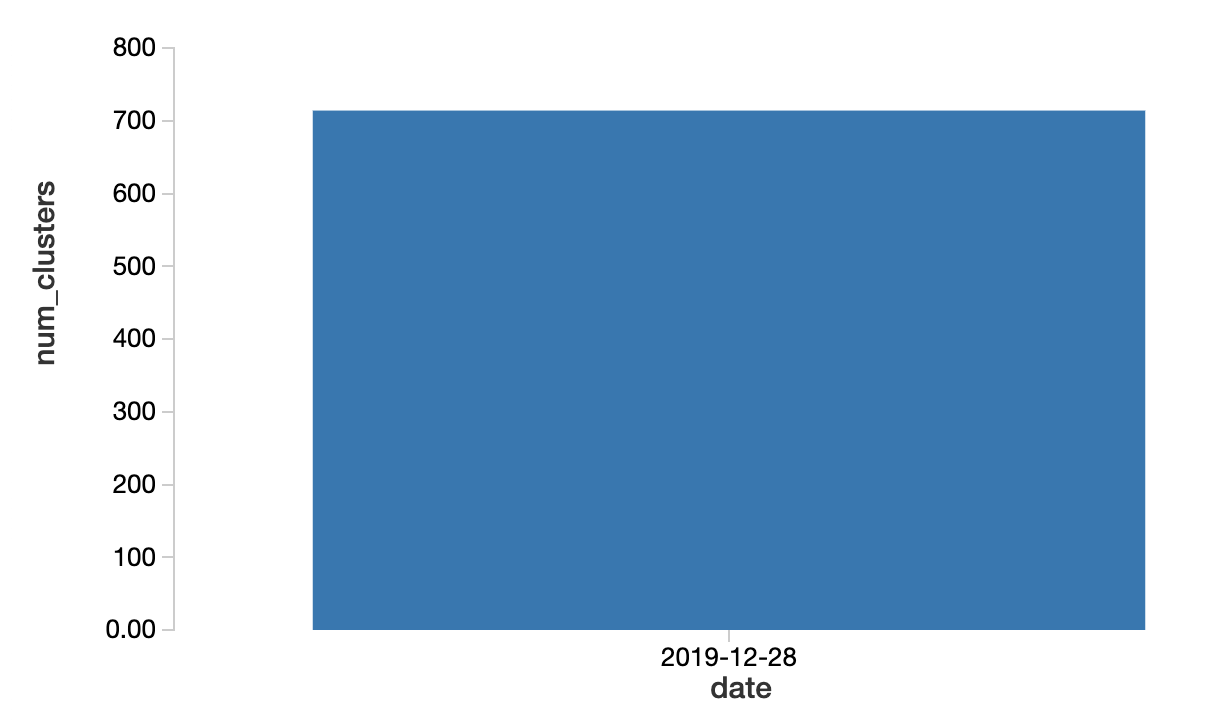
There’s not much context in the above chart because we don’t have data from other days. But for the sake of simplicity, let’s assume that the number of clusters more than tripled compared to normal usage patterns and the number of users did not change meaningfully during that time period. If this were truly the case, then one of the reasonable explanations would be that the clusters were created programmatically using jobs. Additionally, 12/28/19 was a Saturday, so we don't expect there to be many interactive clusters created anyways.
Inspecting the cluster_creator field, which should tell us who created it.

Based on the results above, we notice that JOB_LAUNCHER created 709 clusters, out of 714 total clusters created on 12/28/19, which confirms our intuition.
Our next step is to figure out which particular jobs created these clusters, which we could extract from the cluster names. Databricks job clusters follow this naming convention job-, so we can parse the jobId from the cluster name.

Here we see that jobId “31303” is the culprit for the vast majority of clusters created on 12/28/19. Another piece of information that the audit logs store in requestParams is the user_id of the user who created the job. Since the creator of a job is immutable, we can just take the first record.

Now that we have the user_id of the user who created the job, we can utilize the SCIM API to get the user’s identity and ask them directly about what may have happened here.
In addition to monitoring the total number of clusters overall, we encourage Databricks administrators to pay special attention to all purpose compute clusters that do not have autotermination enabled. The reason is because such clusters will keep running until manually terminated, regardless of whether they’re idle or not. You can identify these clusters using the following query:
If you're utilizing our example data, you'll notice that there are 5 clusters whose cluster_creator is null which means that they were created by users and not by jobs.

By selecting the creator's email address and the cluster's name, we can identify which clusters we need to terminate and which users we need to discuss the best practices for Databricks resource management.
How to start processing Databricks Audit Logs
With a flexible ETL process that follows the best practice medallion architecture with Structured Streaming and Delta Lake, we’ve simplified Databricks audit logs analysis by creating individual tables for each Databricks resource type. Our cluster analysis example is just one of the many ways that analyzing audit logs helps to identify a problematic anti-pattern that could lead to unnecessary costs. Please use the following notebooks for the exact steps we’ve included in this post to try it out at your end:
For more information, you can also watch the recent tech talk: Best Practices on How to Process and Analyze Audit Logs with Delta Lake and Structured Streaming.
For a slightly different architecture that processes the audit logs as soon as they’re available, consider evaluating the new Auto Loader capability that we discuss in detail in this blog post.
We want our customers to maximize the value they get from our platform, so please reach out to your Databricks account team if you have any questions.
Get the latest posts in your inbox
Subscribe to our blog and get the latest posts delivered to your inbox.
