A look at the new Structured Streaming UI in Apache Spark 3.0
by Genmao Yu, Yuanjian Li and Shixiong Zhu
This is a guest community post from Genmao Yu, a software engineer at Alibaba.
Structured Streaming was initially introduced in Apache Spark 2.0. It has proven to be the best platform for building distributed stream processing applications. The unification of SQL/Dataset/DataFrame APIs and Spark’s built-in functions makes it easy for developers to achieve their complex requirements, such as streaming aggregations, stream-stream join, and windowing support. Since the launch of Structured Streaming, developers frequently have asked for a better way to manage their streaming, just like the way we did in Spark Streaming (i.e DStream). In Apache Spark 3.0, we’ve released a new visualization UI for Structured Streaming.
The new Structured Streaming UI provides a simple way to monitor all streaming jobs with useful information and statistics, making it easier to troubleshoot during development debugging as well as improving production observability with real-time metrics. The UI presents two sets of statistics: 1) aggregate information of a streaming query job and 2) detailed statistical information about the streaming query, including Input Rate, Process Rate, Input Rows, Batch Duration, Operation Duration, etc.
Aggregate information of a streaming query job
When a developer submits a streaming SQL query, it will be listed in the Structured Streaming tab, which includes both active streaming queries and completed streaming queries. Some basic information for streaming queries will be listed in the result table, including query name, status, ID, run ID, submitted time, query duration, last batch ID as well as the aggregate information, like average input rate and average process rate. There are three types of streaming query status, i.e., RUNNING, FINISHED and FAILED. All FINISHED and FAILED queries are listed in the completed streaming query table. The Error column shows the exception details of a failed query.
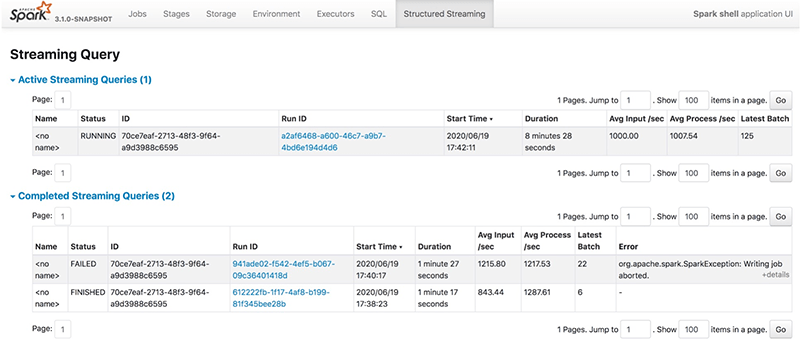
We can check the detailed statistics of a streaming query by clicking the run ID link.
Detailed statistics information
The Statistics page displays the metrics including input/process rate, latency and detailed operation duration, which are useful for insight into the status of your streaming queries, enabling you to easily debug anomalies in query processing.
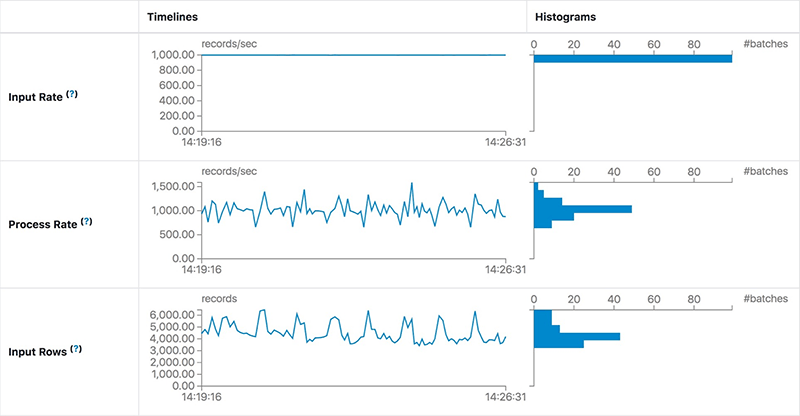
It contains the following metrics:
- Input Rate: The aggregate (across all sources) rate of data arriving.
- Process Rate: The aggregate (across all sources) rate at which Spark is processing data.
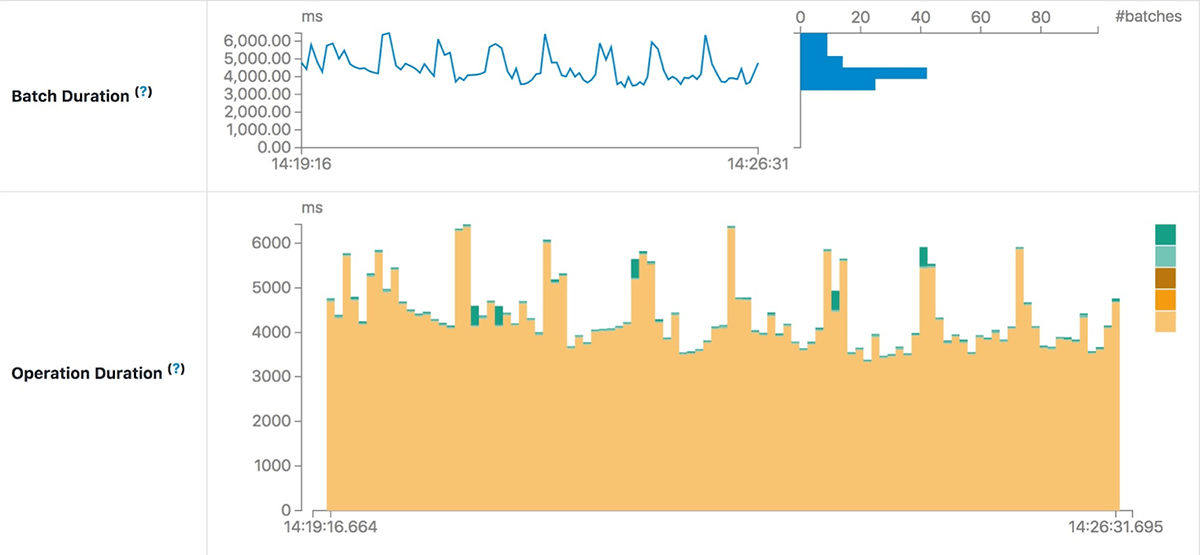
- Batch Duration: The duration of each batch.
- Operation Duration: The amount of time taken to perform various operations in milliseconds.
The tracked operations are listed as follows:
- addBatch: Time taken to read the micro-batch's input data from the sources, process it, and write the batch's output to the sink. This should take the bulk of the micro-batch's time.
- getBatch: Time taken to prepare the logical query to read the input of the current micro-batch from the sources.
- getOffset: Time taken to query the sources whether they have new input data.
- walCommit: Write the offsets to the metadata log.
- queryPlanning: Generate the execution plan.
It’s necessary to note that not all listed operations will be displayed in the UI. There are different operations on different types of data sources, so part of the listed operations may be executed in one streaming query.
Troubleshooting streaming performance using the UI
In this section, let’s go through a couple of cases in which the new Structured Streaming UI indicates something unusual is happening. At a high level, the demo query looks like this and, in each case, we will suppose some preconditions:
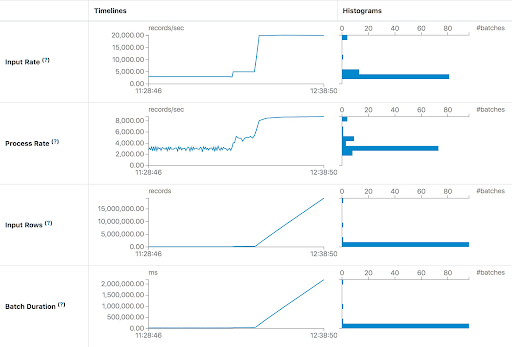
Increasing latency due to insufficient processing capacity
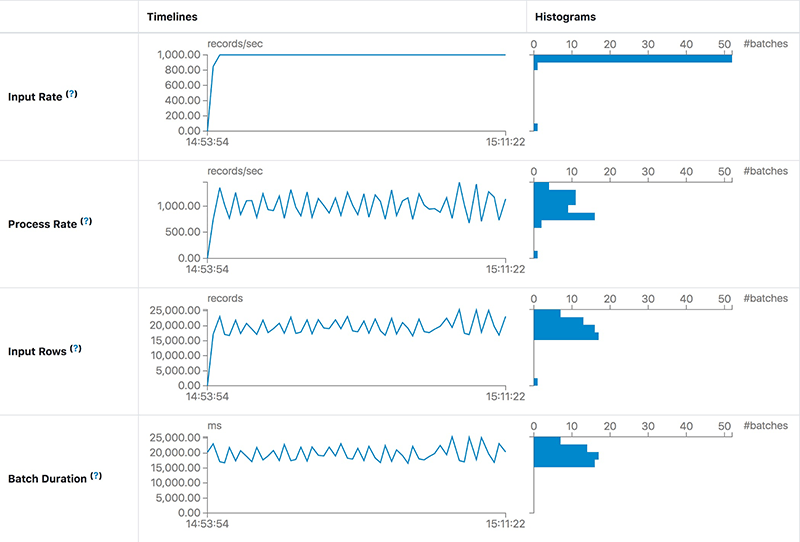
In the first case, we run the query to process Apache Kafka data as soon as possible. In each batch, the streaming job will process all available data in Kafka. If the processing capacity is not enough to process batch data, then the latency will raise rapidly. The most intuitive judgment is the Input Rows and Batch Duration will rise in linear. The Process Rate prompts that the streaming job can only process about 8,000 records/second at most. But the current Input Rate is about 20,000 records/second. We can give the streaming job more execution resources or add enough partitions to handle all the consumers needed to keep up with the producers.
Stable but high latency
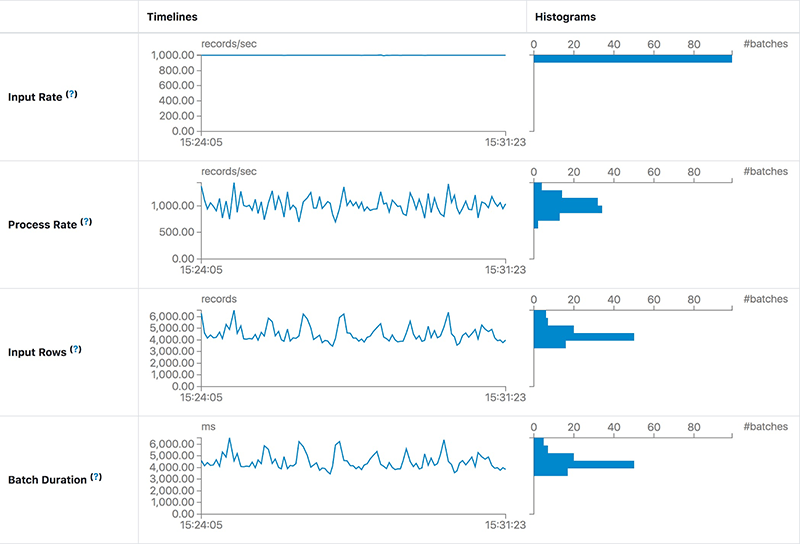
For the case in this section, what’s the difference from the previous one? The latency is not increasing continually but keeps stable, like the following screenshot:
We find that the Process Rate can keep stable at the same Input Rate. This means the processing capacity of a job is enough to process the input data. However, the process duration of each batch, i.e. latency, is still as high as 20 seconds. The main reason for high latency is too much data in each batch. Normally we can reduce the latency by increasing the parallelism of this job. After adding both 10 more Kafka partitions and 10 cores for Spark tasks, we find the latency is about 5 seconds — much better than 20 seconds.
Use Operation Duration chart for troubleshooting
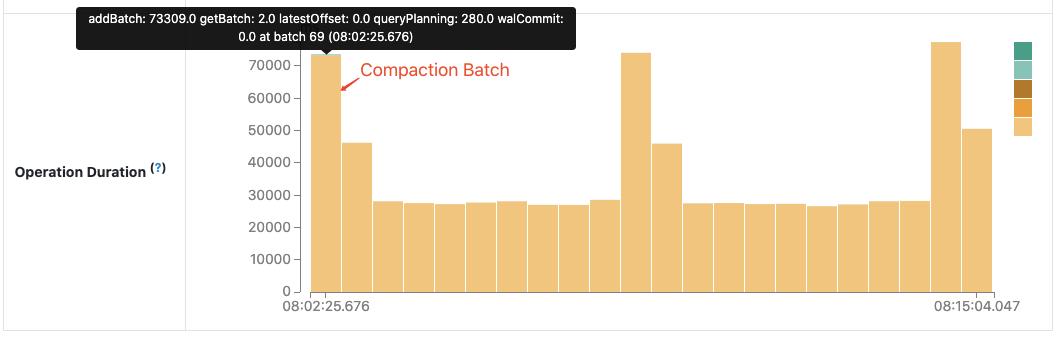
The operation duration chart shows the amount of time taken to perform various operations in milliseconds. It is useful for knowing the time distribution for each batch and making it easier for troubleshooting. Let’s use the performance improvement “SPARK-30915: Avoid reading the metadata log file when finding the latest batch ID” in Apache Spark community as an example.
Before this work, the next batch after compaction takes more time than other batches when the compacted metadata log becomes huge.
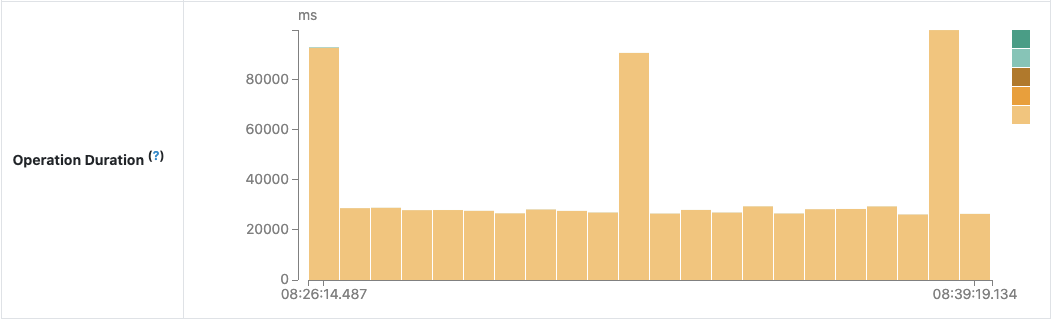
After code investigation, an unnecessary reading of the compacted log file was found and fixed. The following chart of operation duration confirms the effect we expect:
Future development
As shown above, the new Structured Streaming UI will help developers to better monitor their streaming jobs with much more useful streaming query information. As an early-release version, the new UI is still under development and will be improved in future releases. There are a couple of features that can be done in the future, including but not limited to the following:
- More streaming query execution details: late data, watermark, state data metrics, etc.
- Support Structured Streaming UI in the Spark history server.
- More conspicuous tips for unusual circumstances: latency happening, etc.
Try the new UI
Try out this new Spark Streaming UI in Apache Spark 3.0 in the new Databricks Runtime 7.1. If you are using Databricks notebooks, it also gives you a simple way to see the status of any streaming query in your notebook and manage your queries. You can sign up for a free account on Databricks and get started in minutes for free, no credit card needed.

Free 2nd Edition includes updates on Spark 3.0, including the new Python type hints for Pandas UDFs, new date/time implementation, etc.
Get the latest posts in your inbox
Subscribe to our blog and get the latest posts delivered to your inbox.