How to Evaluate Data Pipelines for Cost to Performance
by Hector Leano
Learn best practices for designing and evaluating cost-to-performance benchmarks from Germany’s #1 weather portal.
While we certainly conduct several benchmarks, we know the best benchmark is your queries running on your data. But what are you benchmarking against in your evaluation? The answer seems obvious - cost and integration with your cloud architecture roadmap.
We are finding, however, that many enterprises are only measuring the costs of individual services within a workflow, rather than the entire cost of the workflow. When comparing different architectures, running a complete workflow will demonstrate the total resources consumed (data engine + compute + ancillary support functions).
Without knowing the duration, job failure rate of each architecture, and manual effort required to support a job, comparing list prices of the individual components in two architectures will be misleading at best.
wetter.com case study

wetter.com is the DACH region’s #1 B2C weather portal with up to 20 million monthly unique users along with full cross-media production. To leverage and monetize its data, wetter.com created a new business unit called METEONOMIQS. With METEONOMIQS, the company could now generate new revenue-streams out of their data by developing and selling data-products to business customers. METEONOMIQS provides weather and geo-based data science services to decode the interrelation between weather, consumer behaviour and many other factors used by clients in retail, FMCG, e-commerce, tourism, food and advertising.
METEONOMIQS’ challenge

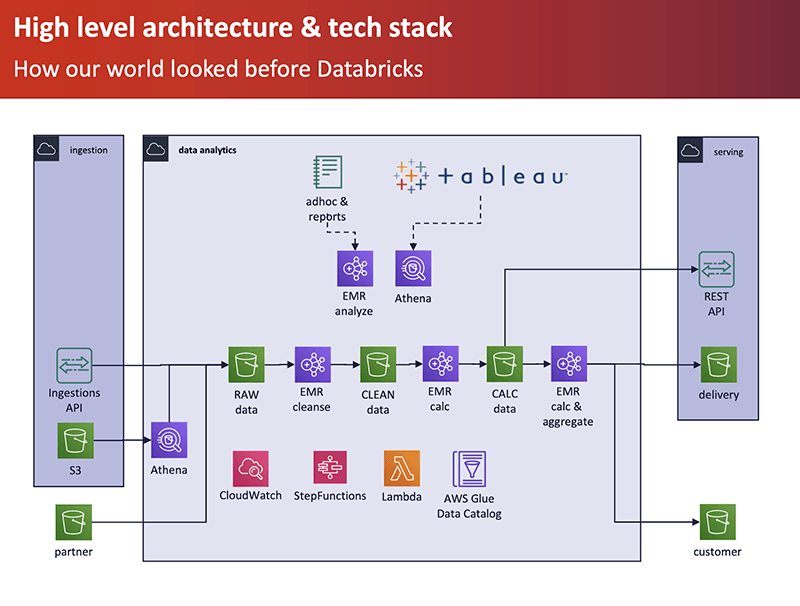
METEONOMIQS had chosen Amazon EMR for processing their data from raw ingestion through to cleansed and aggregated to serve downstream API users. Originally EMR had been the obvious choice as a best-in-class cloud-based Spark engine that fit into their AWS stack.
However, this architecture soon hit its limits. The data pipeline required substantial manual effort to update rows and clean tables, required high DevOps effort to maintain, and limited the potential to use ML due to prolonged development cycles. The poor notebook experience and risk of errors when handing over ML models from DS to DE made it harder to support multiple models at a time.
The greatest risk to the business however was the inability to implement an automated GDPR-compliant workflow by, for example, easily deleting individual customers. Instead METEONOMIQS had to manually clean the data, leading to days of downtime. With GDPR penalties reaching up to 4% of the parent company’s global revenue, this presented a large risk for parent company ProSiebenSat.1.
Building the test
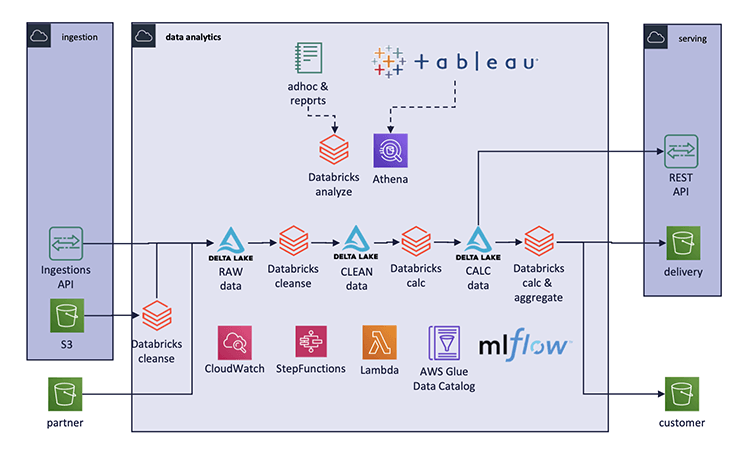
METEONOMIQS turned to Databricks to see if there was a better way to architect their data ingest, processing, and management on Amazon S3. Working with Databricks, they set up a test to see how running this pipeline on Databricks compared in terms of:
| Vector analyzed | Capabilities required |
|---|---|
| Setup |
|
| Pipeline migration |
|
| GDPR compliance |
|
| Clean up / Update |
|
| Ease of use |
|
| ML model management |
|
| Total cost |
|
Benchmark results
Data corrections/enhancements without downtime
| Vector analyzed | EMR-based architecture | Databricks-based architecture |
|---|---|---|
| Setup | ✔ | ✔ |
| Pipeline migration | — | ✔ |
| GDPR compliance |
✘ GDPR deletes in hours/days with downtime |
✔ GDPR deletes in minutes without downtime |
| Clean up / Update |
✘ Requires days of downtime |
✔ |
| Ease of use | ✘ | ✔ |
| ML model management | ✘ |
✔ Improved collaboration between Data Scientists and Data Engineers / Dev Team |
| Total cost | 80% of EMR costs were from dedicated dev and analytics clusters leading to unpredictable compute costs.
DataOps required substantial developer resources to maintain. |
Through cluster sharing, METEONOMIQS could use cloud resources much more efficiently
But more importantly, they can now do new use cases like automated GDPR compliance and scale their ML in ways not possible before. |
For METEONOMIQS the main gains to the Databricks architecture were:
- Adding use cases (e.g., automated data corrections and enhancements) that hadn’t been deployed on EMR due to the high level of development costs
- Massively decreasing the amount of manual maintenance required for the pipeline
- Simplifying and automating GDPR compliance of the pipeline so that it could now be done in minutes without downtime compared to hours/days with downtime previously
Additionally, the team had high AWS resource consumption in the EMR architecture since shared environments were not possible on EMR. As a result team members had to use dedicated clusters. Databricks’ shared environment for all developers plus the ability to work on shared projects (i.e., notebooks), resulted in a more efficient use of human and infrastructure resources.
Handover of ML models from data scientists to the data engineering team was complicated and led the ML code to diverge. With MLflow the team now has a comfortable way to hand over models and track changes over time.
Further, as Databricks notebooks are much easier to use, METEONOMIQS could enable access to the data lake to a broader audience like, for example, the mobile app team.
As one of their next steps, METEONOMIQS will look to optimize their code for further infrastructure savings and performance gains as well as look at other pipelines to transition to Databricks architecture.
Takeaways
The keys to the team’s successful benchmark relied on
- Knowing what they were measuring for: Often clients will only compare list prices of individual services (e.g., compare the cost of one Spark engine versus another) when evaluating different architectures. What we try to advise clients is not to look at individual services but rather the total job cost (data engine + compute + team productivity) against the business value delivered. In this case, wetter.com’s data engineering team aligned their test with the overall business goal - ensuring their data pipelines could support business and regulatory requirements while decreasing infrastructure and developer overhead.
- Choosing critical workloads: Instead of trying to migrate all pipelines at once, the team narrowed the scope to their most pressing business case. Through this project they were able to validate that Databricks could handle data engineering, machine learning, and even basic business analytics at scale, on budget, and in a timely manner.
- Delivering value quickly: Critical for this team was to move from discussions to PoCs to production as quickly as possible to start driving cost savings. Discussions stretching months or longer was not an option nor a good use of their team’s time. Working with Databricks, they were able to stand up the first benchmark PoCs in less than three weeks.
Ready to run your own evaluation?
If you are looking to run your own tests to compare costs and performance of different cloud data pipelines, drop us a line at sales@databricks.com. We can provide a custom assessment based on your complete job flow and help qualify you for any available promotions. Included in the assessment are:
- Tech validation: understand data sources, downstream data use, and resources currently required to run pipeline job
- Business value analysis: identify the company’s strategic priorities, to understand how the technical use case (e.g., ETL) drives business use cases (e.g., personalization, supply chain efficiency, quality of experience). This ensures our SAs are designing a solution that fits not just today’s needs but the ongoing evolution of your business.
Below is an outline of our general approach based on best practices for designing and evaluating your benchmark test for data pipelines.
Designing the test
Given data pipelines within the same enterprise can vary widely depending on the data’s sources and end uses - and large enterprises can have thousands of data pipelines spanning supply chain, marketing, product, and operations - how do you test an architecture to ensure it can work across a range of scenarios, end-user personas, and use cases? More importantly, how can you do it within a limited time? What you want is to be able to go from test, to validation, to scaling across as many pipelines as possible as quickly as possible to reduce costs as well as the support burden on your data engineers.
One approach we have seen is to select pipelines that are architecturally representative of most of an enterprise’s pipelines. While this is a good consideration, we find selecting pipelines based primarily on architectural considerations does not necessarily lead to the biggest overall impact. For example, your most common data pipeline architecture might be for smaller pipelines that aren’t necessarily the ones driving your infrastructure costs or requiring the most troubleshooting support from your data engineers.
Instead, we recommend clients limit the scope of their benchmark tests to 3-5 data pipelines based on just two considerations:
- Test first on business critical data workloads: Often the first reflex is to start with less important workloads and then move up the stack as the architecture proves itself. However, we recommend running the test on strategic, business critical pipelines first because it is better to know earlier rather than later if an architecture can deliver on the necessary business SLAs. Once you prove you can deliver on the important jobs, then it becomes easier to move less critical pipelines over to a new architecture. But the reverse (moving from less critical to more critical) will require validating twice - first on the initial test and then once again for important workloads.
- Select pipelines based on the major stressors affecting performance: What��’s causing long lead times, job delays, or job failures? When selecting test pipelines, make sure you know what the stressors are to your current architecture, and select representative pipelines generating long delays, high fail rates, and/or require constant support from your data engineering teams. For example, if you’re a manufacturer trying to get a real-time view of your supply chain, from parts vendors to assembly to shipping, but your IoT pipelines take hours to process large volumes of small files in batches, that is an ideal test candidate.
Evaluating the results
Once you have selected the data pipelines to test, the key metrics to evaluate are:
- Total cost to run a job: What are the total resources required to run a job? This means looking not just at the data engine costs for ingest and processing, but also total compute and support function costs (like data validation) to complete the data query. In addition, what is your pipeline’s failure rate? Frequent job failures mean reprocessing the data several times, significantly increasing infrastructure costs.
- Amount of time to run a job: How long does it take to run a job once you add cluster spin up and data processing along with the amount of time it takes to identify and remediate any job failures? The longer this period, the higher the infrastructure costs but also, the longer it will take for your data to drive real business value/insights. Enterprises rely on data to make important business decisions and rigid pipelines with long lead times prevent businesses from iterating quickly.
- Productivity: How often are your jobs failing and how long does it take your data engineers to go through the logs to find the root cause, troubleshoot, and resolve? This loss of productivity is a real cost in terms of increased headcount plus the opportunity cost of having your data engineers focused on basic data reliability issues instead of solving higher level business problems. Even if your jobs run correctly, are your downstream users working with the most up to date information? Are they forced to deduplicate and clean data before use in reports, analytics, and data science? Particularly with streaming data where you can have out-of-order files, how can you ensure you have consistent data across users?
- Extensibility: Will adding new use cases or data sources require full re-engineering of your data pipelines, or do you have a schema that can evolve with your data needs?
Additionally, as enterprises look to create a more future proof architecture, they should look to:
- Implementation complexity: How big of a migration will this be? How complex is the re-engineering required? How much and for how long will it take data engineering resources to stand up a new data pipeline? How quickly can your architecture conform to security requirements? When UK-based food box company Guosto rebuilt their ETL pipelines to Delta Lake on Databricks, they noted, “the whole implementation, from the first contact with Databricks to have the job running in production took about two months — which was surprisingly fast given the size of Gousto tech and the governance processes in place.”
- Portability: As more enterprises look to multi-cloud, how portable is their architecture across clouds? Is data being saved in proprietary formats resulting in vendor lock in (i.e., will it require substantial costs to switch in the future)?
Get the latest posts in your inbox
Subscribe to our blog and get the latest posts delivered to your inbox.