Databricks SQL: Delivering a Production SQL Development Experience on the Data Lake

Databricks SQL is now generally available on AWS and Azure.
Databricks SQL (DB SQL) is a simple and powerful SQL analytics platform for creating and sharing insights at a fraction of the cost of cloud data warehouses. Data analysts can either connect business intelligence (BI) tools of their choice to SQL endpoints, leverage the built-in analytics capabilities (SQL query editor, visualizations and dashboards), or some combination of both. Today, many customers connect BI tools like Tableau or Microsoft PowerBI to DB SQL for analytics and reporting directly on the data lake. In addition to compute for 3rd-party BI tools, DB SQL also equips you with everything you need for quick exploration and lightweight reporting without any additional tools.
This blog is part of a series on Databricks SQL that covers critical capabilities across performance, ease of use, and governance. In today’s blog, we highlight recent user experience enhancements for:
- Faster onboarding with sample data & dashboards
- Discovering data and managing access
- Increasing productivity in the SQL query editor
- Creating & collaborating on dashboards
- Subscribing to dashboards
- Triggering alerts based on query results
Faster onboarding with sample data & dashboards
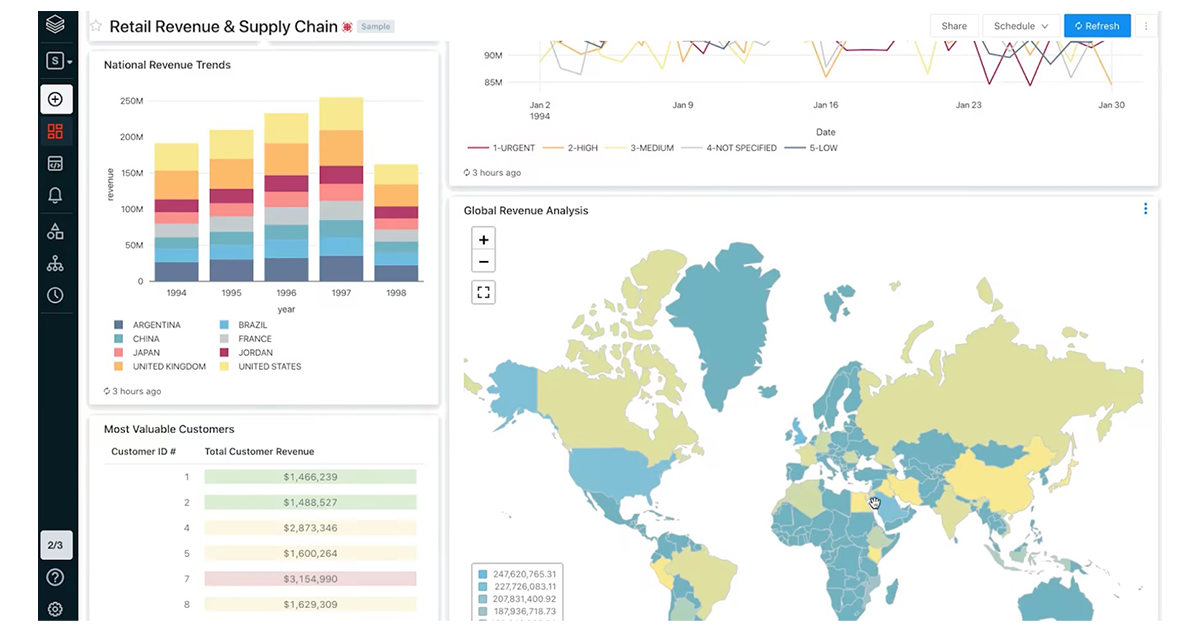
Databricks SQL empowers everyone from analysts and data scientists to engineers and product managers with the tools to quickly derive essential insights -- all without procuring any extra licenses. While many individuals in your organization may be familiar with SQL, they may not be as experienced with the ins and outs of visualizations and dashboards in DB SQL. To streamline onboarding of new users, Databricks SQL now ships with sample data, queries, visualizations and dashboards out of the box.
When you visit the Dashboard Gallery, you can review Databricks-supplied dashboards and import them into your own workspace. These samples demonstrate common visualization types and configurations, such as conditionally changing font colors based on different thresholds.
Discovering data and managing access
Today, it’s not uncommon for an organization's data landscape to contain tens, hundreds and even thousands of data sets. Navigating that surface area to figure out what data is available and who has access to what databases and tables can quickly become overwhelming. Data Explorer is the one stop shop to discover available databases, tables and views as well as manage data permissions.
In Databricks SQL, Data Explorer provides a clean, straightforward interface to browse available data and manage permissions. It’s the first step in the journey of making trusted, high-quality data securely available within your organization.
Increasing productivity in the SQL query editor
Truly understanding your business goes so very much beyond a SELECT *. In order to comprehensively understand the answer to a business question, you need to consider the problem from multiple angles and refine as you go. Databricks SQL provides you with the SQL development experience you need to productively iterate on multiple queries simultaneously:
- Multi-taskers rejoice - it's now easier than ever to switch back and forth between queries in the same screen by leveraging query tabs!
- Automatically save drafts. Now you can close your browser without losing your query.
- Leverage autocomplete for relevant suggestions.
- Pin your favorite tables for quick reference.
- Add and customize multiple visualizations for each query result. A picture is worth a thousand words and DB SQL provides an array of visualizations to help uncover key insights.
- View previous runs under Query History. Because sometimes you just need to jump back to a query you wrote a few days ago.
Subscribe to dashboards
Dashboards are a great way to persist insights. So we’ve made it easier than ever to open up access to those insights to anyone in your organization, whether or not they login to Databricks everyday.
Dashboard subscriptions now allow you to deliver a convenient email and a PDF on a schedule of your choice. You can subscribe users within the Databricks workspace directly or leverage alert destinations to reach distribution lists and non-Databricks users at your organization.
Triggering alerts based on query results
The most valuable data is actionable data. As you identify the most salient business metrics, it’s important to know when a number spikes or dips outside of expected values. Once you have identified key inflection points for different data points, you can configure alerts to be notified when those thresholds are met. By default, you can notify any user in your workspace, but you can also alert an email distribution list, message a Slack channel, or create a PagerDuty incident.
Next Steps
Databricks SQL is already changing the way analytics is done at modern businesses like Atlassian and Plume, and we can't wait to hear your feedback as well! We also encourage you to submit an idea for ways we can enhance Databricks SQL to better fit your needs.
If you’re an existing Databricks user, you can start using Databricks SQL today by following our Get Started guide for Azure Databricks or AWS. If you’re not yet a Databricks user, visit databricks.com/try-databricks to start a free trial.
Finally to learn more, join us on October 6th for a free instructor-led workshop on Databricks SQL. We look forward to seeing you there!
Never miss a Databricks post
What's next?

Data Warehousing
July 24, 2024/7 min read
Primary Key and Foreign Key constraints are GA and now enable faster queries

Product
September 12, 2024/7 min read