Introducing Data Profiles in the Databricks Notebook
Simplifying exploratory data analysis
by Edward Gan, Moonsoo Lee and Austin Ford
Before a data scientist can write a report on analytics or train a machine learning (ML) model, they need to understand the shape and content of their data. This exploratory data analysis is iterative, with each stage of the cycle often involving the same basic techniques: visualizing data distributions and computing summary statistics like row count, null count, mean, item frequencies, etc. Unfortunately, manually generating these visualizations and statistics is cumbersome and error prone, especially for large datasets. To address this challenge and simplify exploratory data analysis, we’re introducing data profiling capabilities in the Databricks Notebook.
Profiling data in the Notebook
Data teams working on a cluster running DBR 9.1 or newer have two ways to generate data profiles in the Notebook: via the cell output UI and via the dbutils library. When viewing the contents of a data frame using the Databricks display function (AWS|Azure|Google) or the results of a SQL query, users will see a “Data Profile” tab to the right of the “Table” tab in the cell output. Clicking on this tab will automatically execute a new command that generates a profile of the data in the data frame. The profile will include summary statistics for numeric, string, and date columns as well as histograms of the value distributions for each column. Note that this command will profile the entire data set in the data frame or SQL query results, not just the portion displayed in the table (which can be truncated).
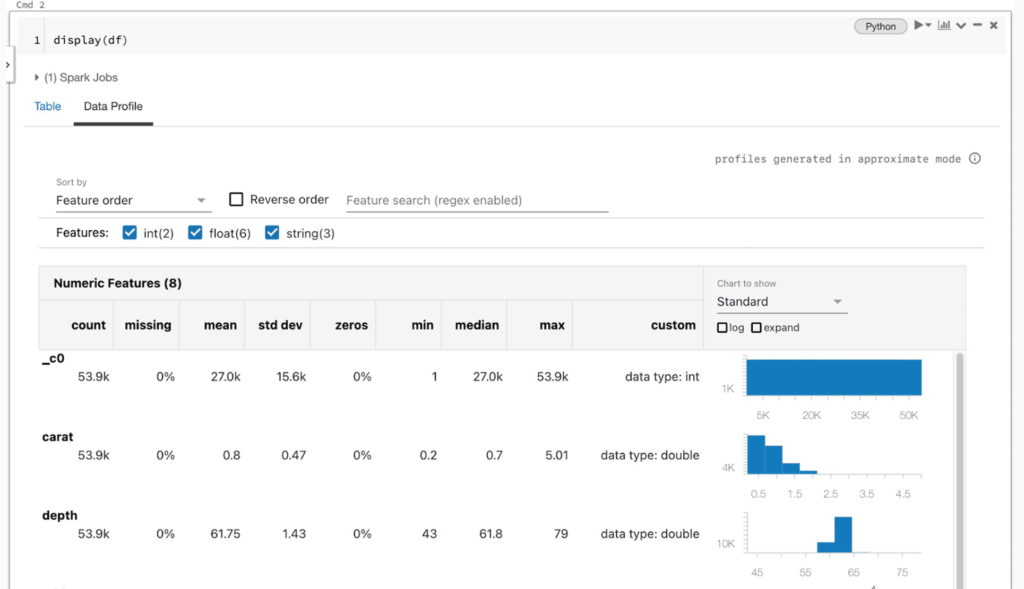
Under the hood, the notebook UI issues a new command to compute a data profile, which is implemented via an automatically generated Apache Spark™ query for each dataset. This functionality is also available through the dbutils API in Python, Scala, and R, using the dbutils.data.summarize(df) command. For more information, see the documentation (AWS|Azure|Google).
Try out data profiles today when previewing Dataframes in Databricks notebooks!
Get the latest posts in your inbox
Subscribe to our blog and get the latest posts delivered to your inbox.