Simplify Your Forecasting With Databricks AutoML

Last year, we announced Databricks AutoML for Classification and Regression and showed the importance of having a glass box approach to empower data teams. Today, we are happy to announce that we’re extending those capabilities to forecasting problems with AutoML for Forecasting.
Data teams can easily create forecasts entirely through a UI. These generated forecasts can be used as is or as starting points for further tweaking. Simplifying and reducing the time to start is particularly important in forecasting because stakeholders are often looking at hundreds or even thousands of different forecasts for different products, territories, stores and so forth, which can lead to a backlog of unstarted forecasts. AutoML for Forecasting augments data teams and helps them to quickly verify the predictive power of a dataset, as well as get a baseline model to guide the direction of a forecasting project.
Let’s take a look at how easy it is to get a forecast with AutoML.
Example: Forecasting candy production
With Valentine’s Day coming up soon, we want to forecast the production of candy in the next few weeks.
How it works
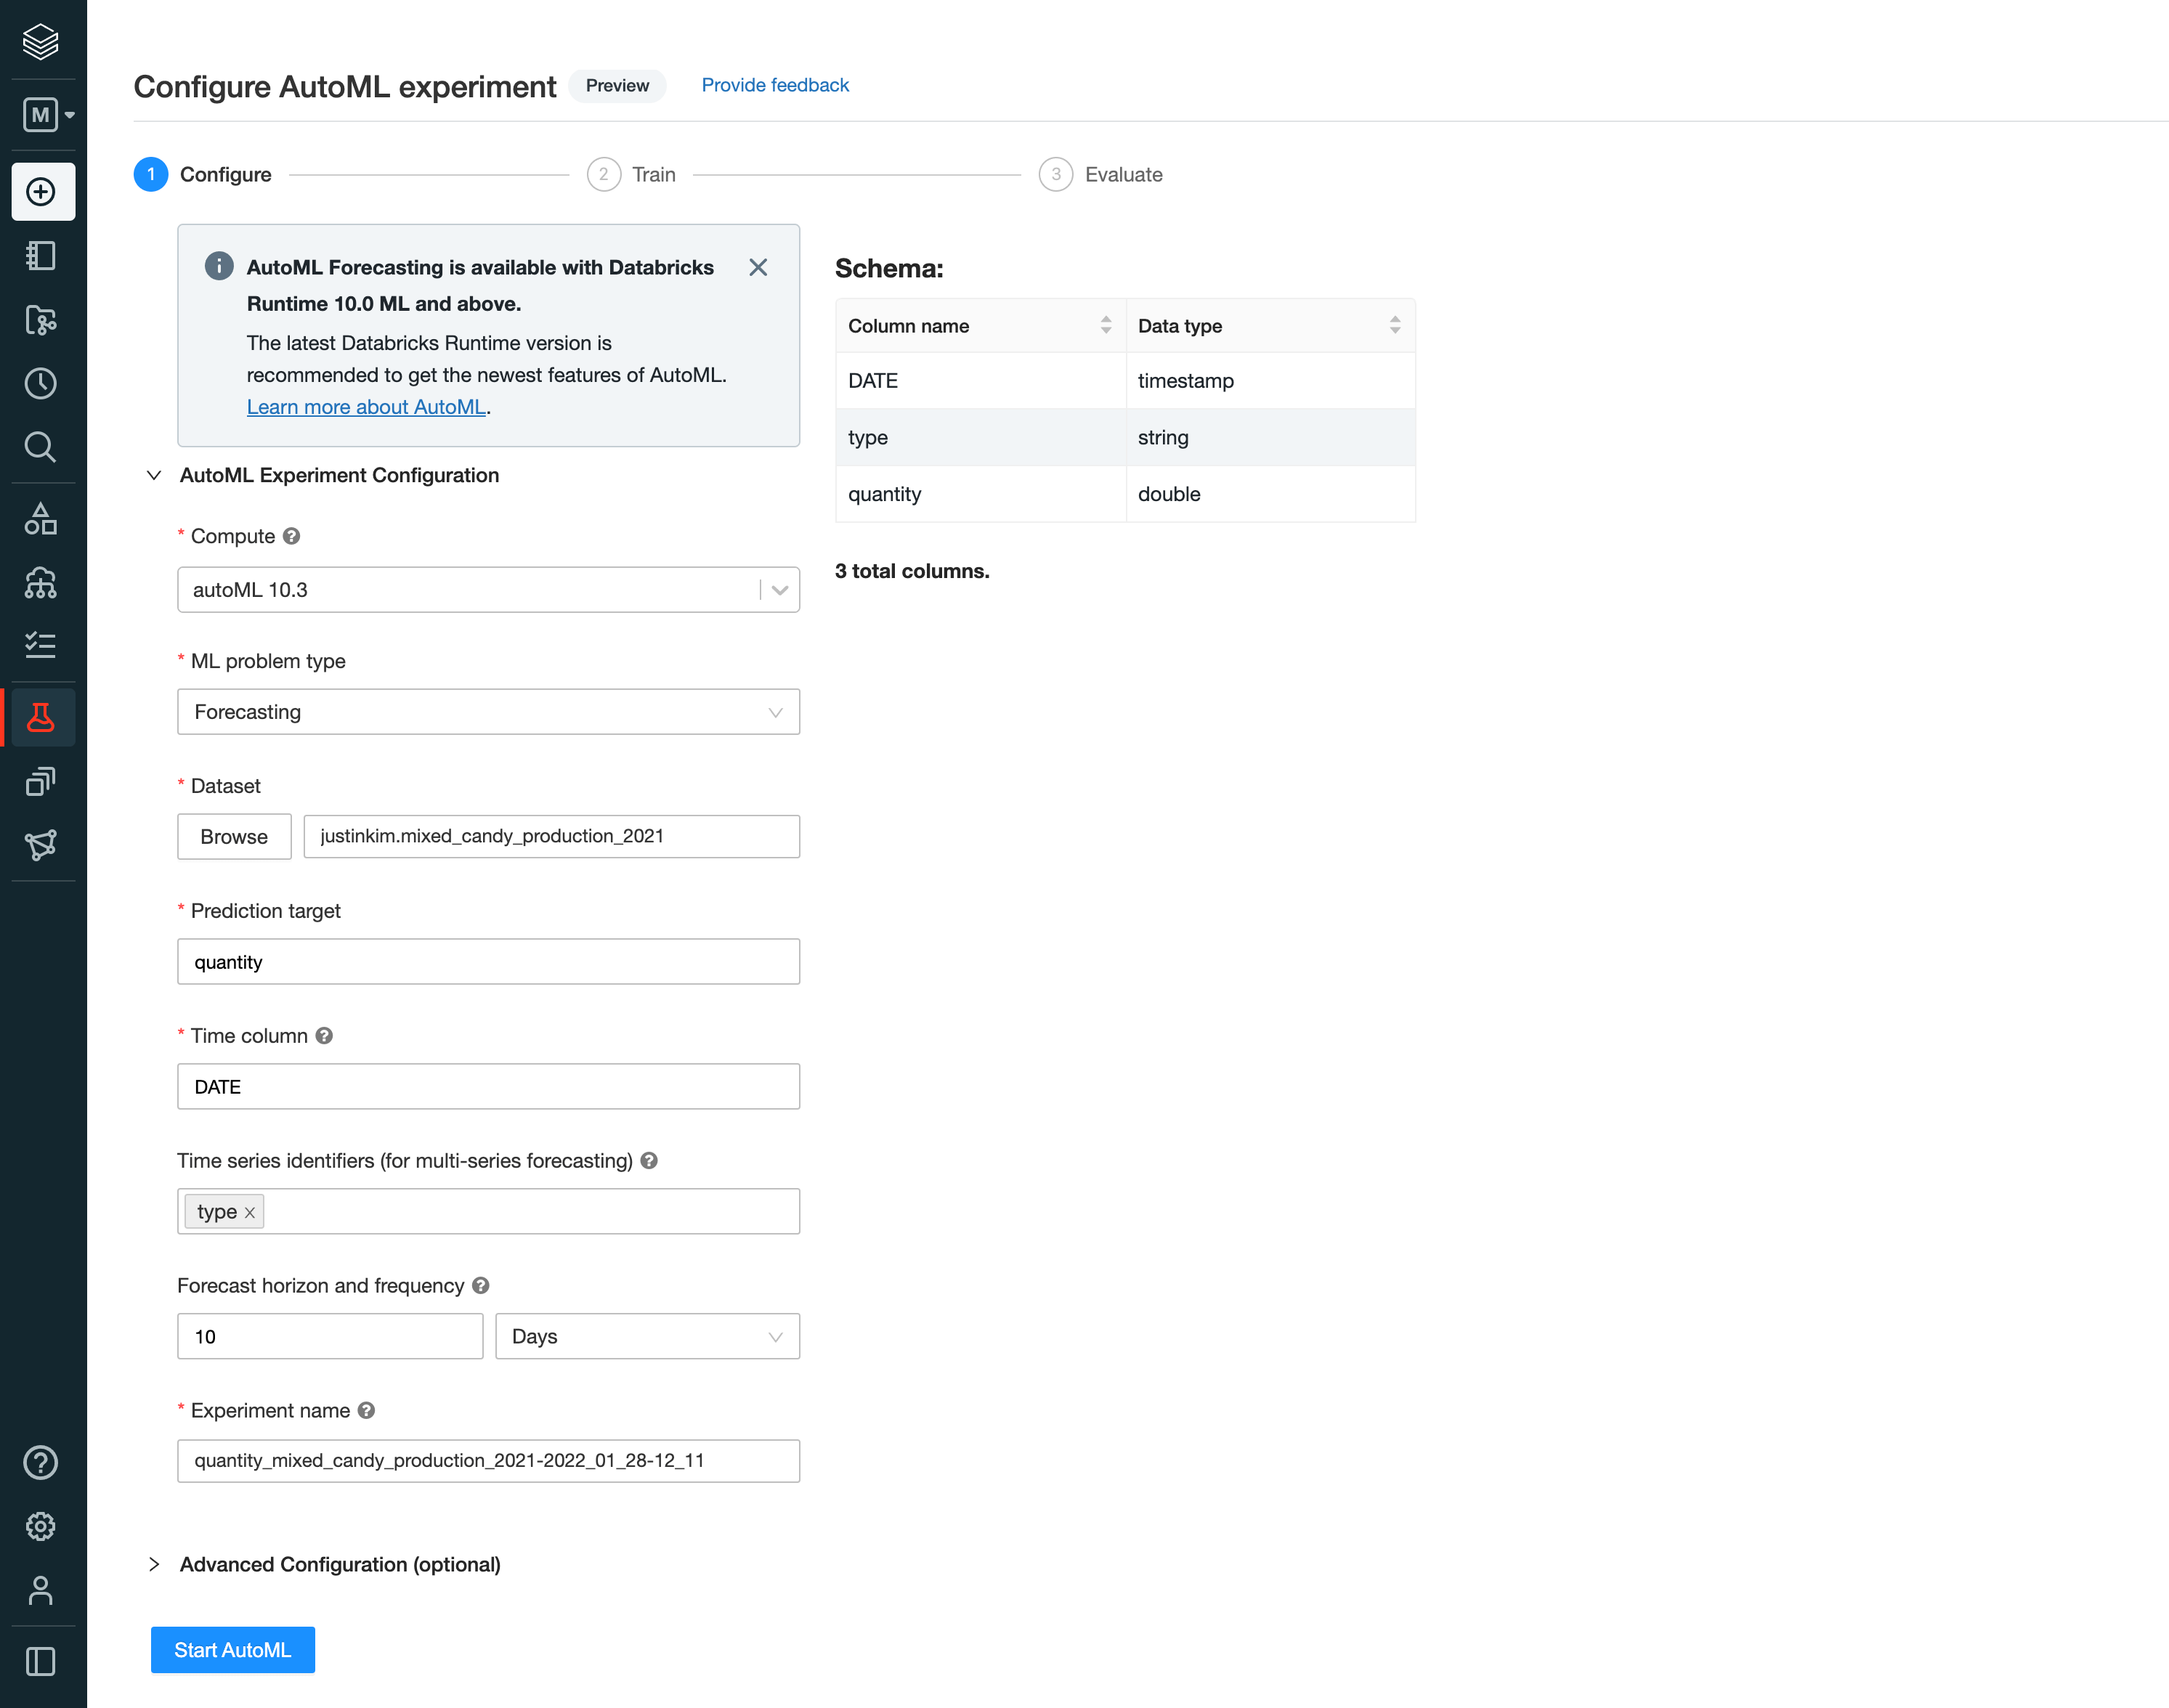
A setup wizard guides us through what we need to configure in order to get started. We chose the “Forecasting” problem type and selected the dataset. In this example, we’re using a candy production quantity dataset that we already had created as a table in Databricks and Databricks Runtime 10.3. Here we’re also able to specify if we want to perform a univariate or multi-series forecasting.
Once started, AutoML will perform any necessary data prep, train multiple models using Prophet and ARIMA algorithms, perform hyperparameter tuning with Hyperopt for each time series being forecasted, all while running fully parallelly with Apache Spark™. As AutoML finishes running, we will be able to see the different models that were trained and their performance metrics (e.g., SMAPE and RMSE) to evaluate the best ones.
Augmenting data teams
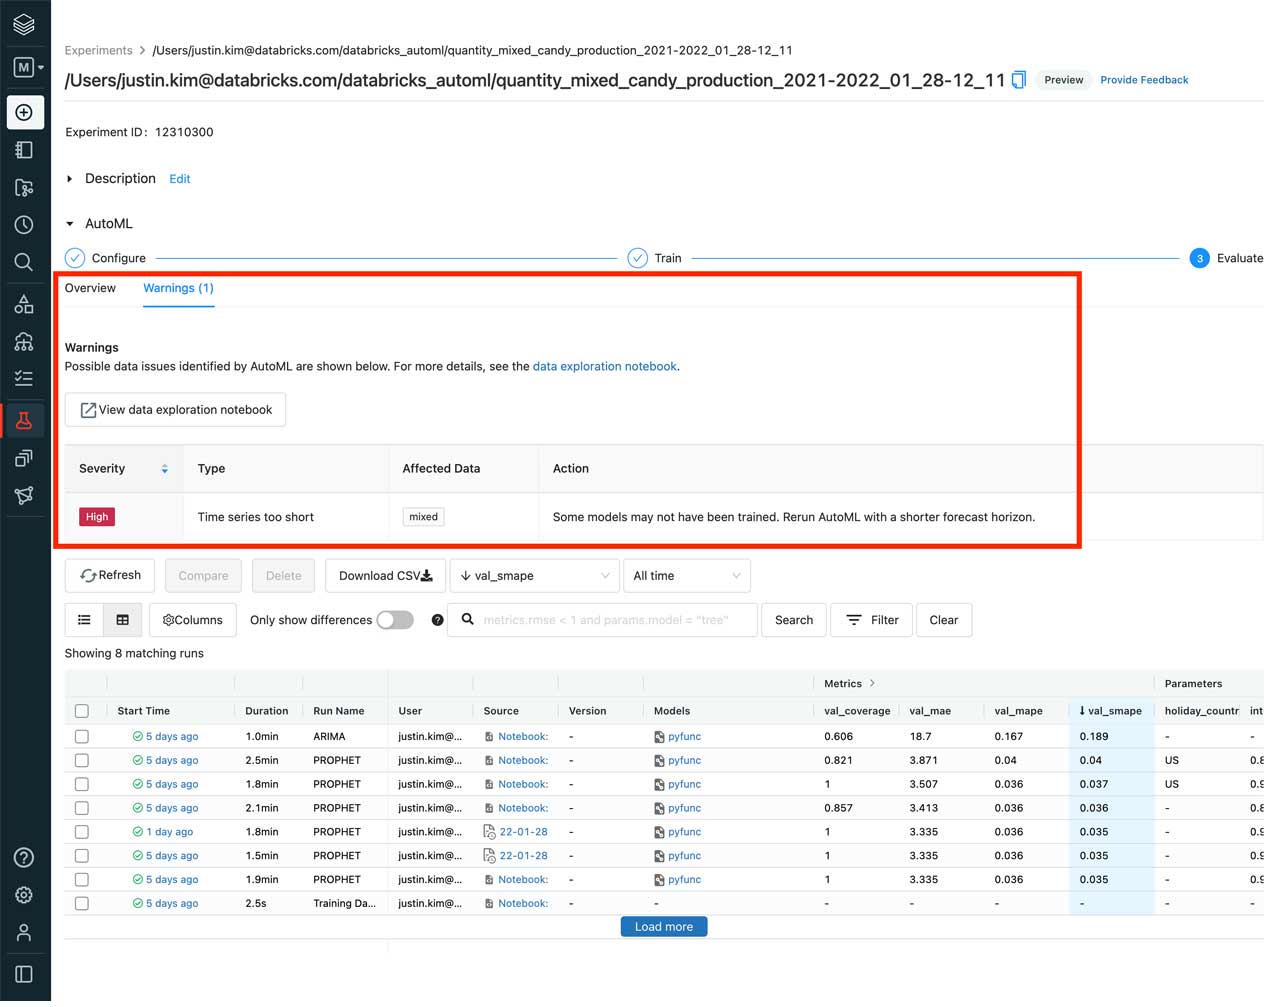
Next, we can see that AutoML detected that one of the types of candy, “mixed”, did not have enough data to produce a forecast and notified us through a warning.
The best part about AutoML is that everything is transparent. AutoML will provide warnings on important steps that were performed or even skipped based on our data. This gives us the opportunity to use our knowledge of the data and make any necessary updates to the models.
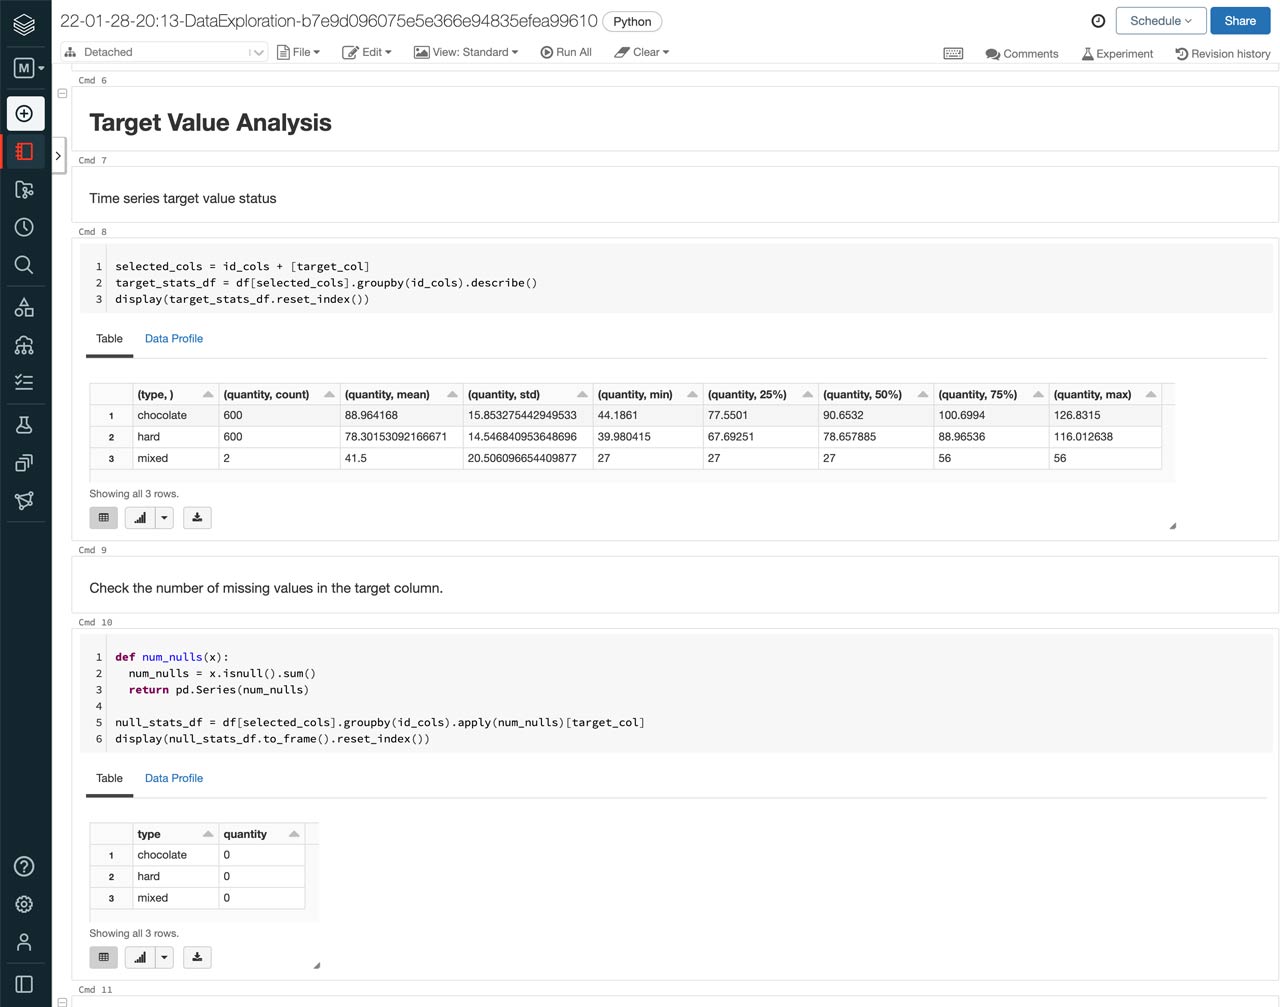
AutoML makes this easy by also allowing us to look at the full Python notebooks for each of the models trained and a data exploration notebook that highlights insights about the data used for the models. In the data exploration notebook, we’re able to confirm that removing the “mixed” candy type will not impact our forecast as we can see that it only had two data points.
These notebooks can be great starting points for data scientists by allowing them to bring in their domain knowledge to make updates to models that were automatically generated.
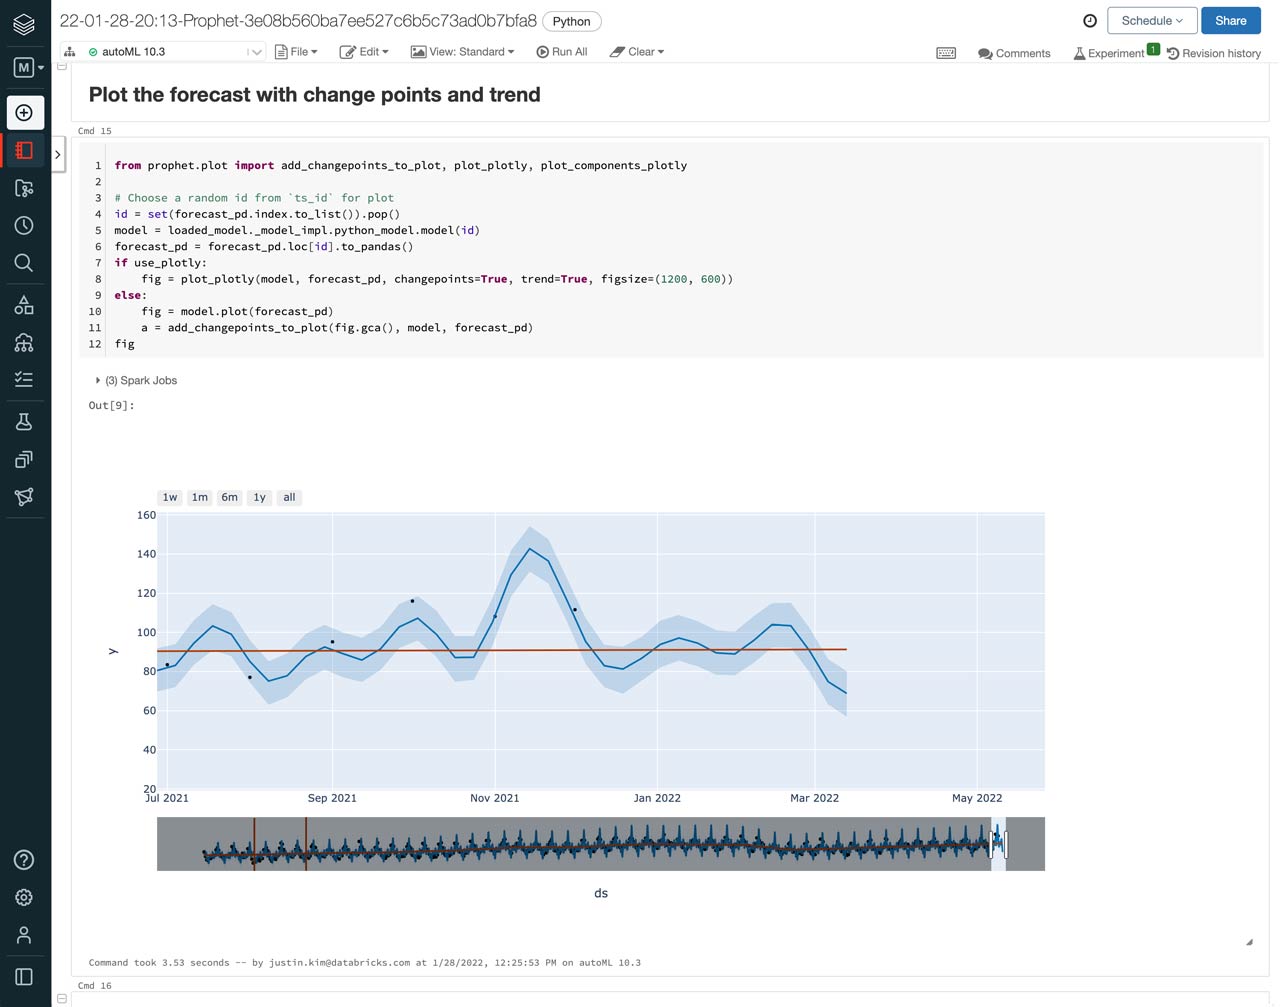
To see what the predicted production of candy is going to look like, we can select the notebook of the best performing model and view the included plot of the actual candy production vs the forecasts, including those for January 2022 to March 2022.
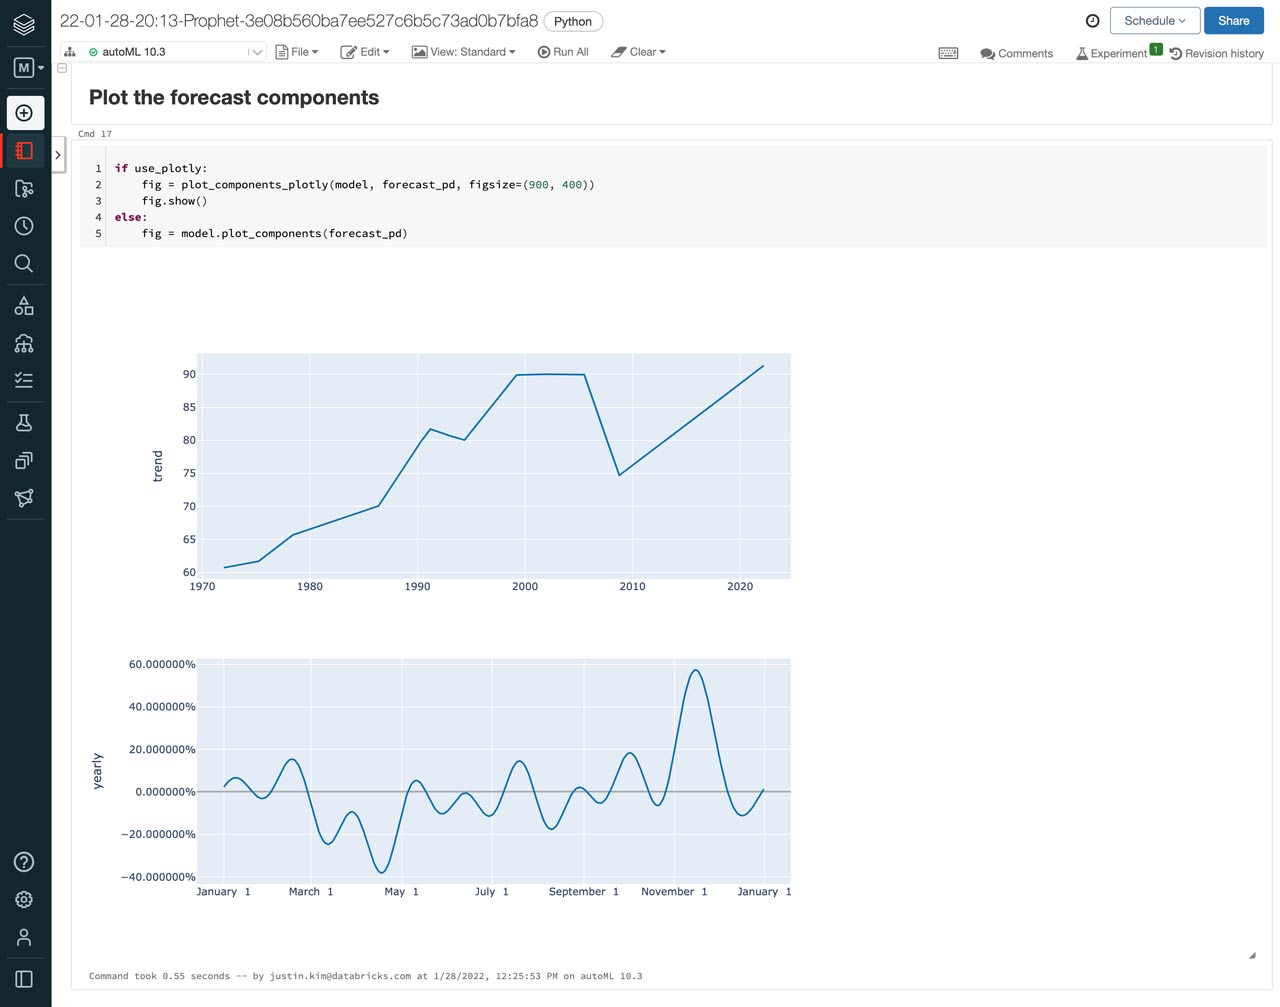
In addition to making predictions, AutoML Forecast provides more analysis of the forecast in the notebooks. Here, we can see how trends and seasonality factored into the predictions. Overall, it looks like candy production tends to peak from October to December, which aligns with Halloween and the holidays, but has a slight spike in production again in February, just in time for Valentine’s Day.
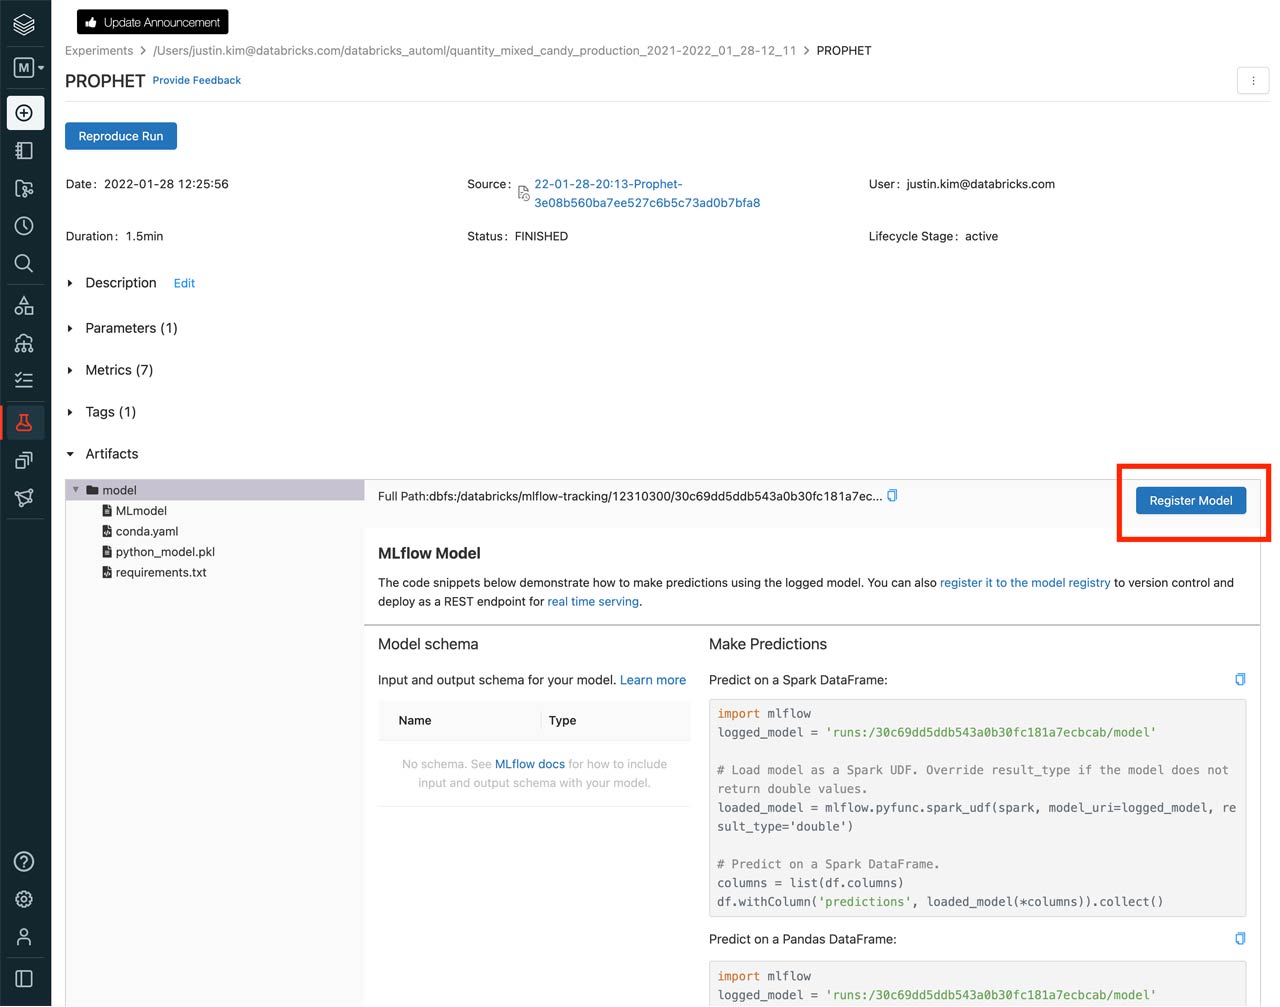
Now that we’ve identified which model to use, we can register it by clicking the model name or start time from the list of runs and then clicking the “Register Model” button. From here, we can set up model serving and deploy our model for inference and predictions.
Get started with Databricks AutoML public preview
Databricks AutoML is in Public Preview as part of the Databricks Machine Learning experience. To get started:
In the Databricks UI, simply switch to the “Machine Learning” experience via the left sidebar. Click on the “(+) Create” and click “AutoML Experiment” or navigate to the Experiments page and click “Create AutoML Experiment.”. Use the AutoML API, a single-line call, which can be seen in our documentation.
Ready to try Databricks AutoML out for yourself? Read more about Databricks AutoML and how to use it on AWS, Azure, and GCP or take the AutoML Forecasting course (available for Databricks customers with a Databricks Academy login).
If you’re new to AutoML, be sure to join us for a live demo with our friends at Fabletics on Feb 10 at 10AM PT. We’ll be covering the fundamentals of AutoML, and walk you through how - no matter what your role - you can leverage AutoML to jumpstart and simplify your ML projects. Grab a seat!
Never miss a Databricks post
What's next?
Data Science and ML
October 1, 2024/5 min read
Build Compound AI Systems Faster with Databricks Mosaic AI

Healthcare & Life Sciences
November 14, 2024/2 min read
