Increasing Healthcare Equity With Data
by Scott Black
Social determinants of health (SDOH) have an indisputable impact on health equity. They have long been a concern of the CDC, healthcare professionals, and many government agencies whose constituents experience health inequities due to nonmedical social and economic factors, such as race, income and sexual orientation. According to the CDC, "Health inequities are reflected in differences in length of life; quality of life; rates of disease, disability and death; severity of disease; and access to treatment." Negative consequences of health inequities include lower quality of life, but the good news is that use of data relevant to social determinants of health can play a large role in helping to identify disparities and prioritize health equity. Closing the gap on health disparities requires analyzing many rich sources of data, which can be challenging. The pandemic and the accompanying vaccine distribution rates among various socioeconomic and social groups provide the most recent example. It can be helpful to use COVID-19 to bring visibility to this issue and illustrate such disparities through the use of data. However, it's important to note that health equity is relevant to many use cases across local, state and federal governments.
Using the example of COVID-19 vaccinations, existing data sources can provide valuable insights into the causes that may underlie lower vaccination rates in certain communities. COVID-19 vaccines have been widely available across the United States for at least a year, but vaccination rates vary widely not only across states but within counties and at subcounty levels. While basic information about those who have been vaccinated — for example, age, ethnicity and gender — provides limited insight into groups of underserved people, there are many additional data sources that can be leveraged to gain a more comprehensive view. For our analysis, we'll use existing and public data sets such as income, educational attainment, population density and health traits such as asthma, cancer rates, obesity rates and medical insurance coverage, among others.
How's it done today?
Although the above data sets and other private data sets exist within various county and state departments such as health, labor, justice and family services, the challenge that has historically faced decision makers is the inability to access all of these data sets. To help visualize these challenges, let's consider an all too common conversation between Heather, a biostatistician who is looking for correlations between cost of claims and social determinants of health, and Ryan, a database administrator for the Medicare and Medicaid database.
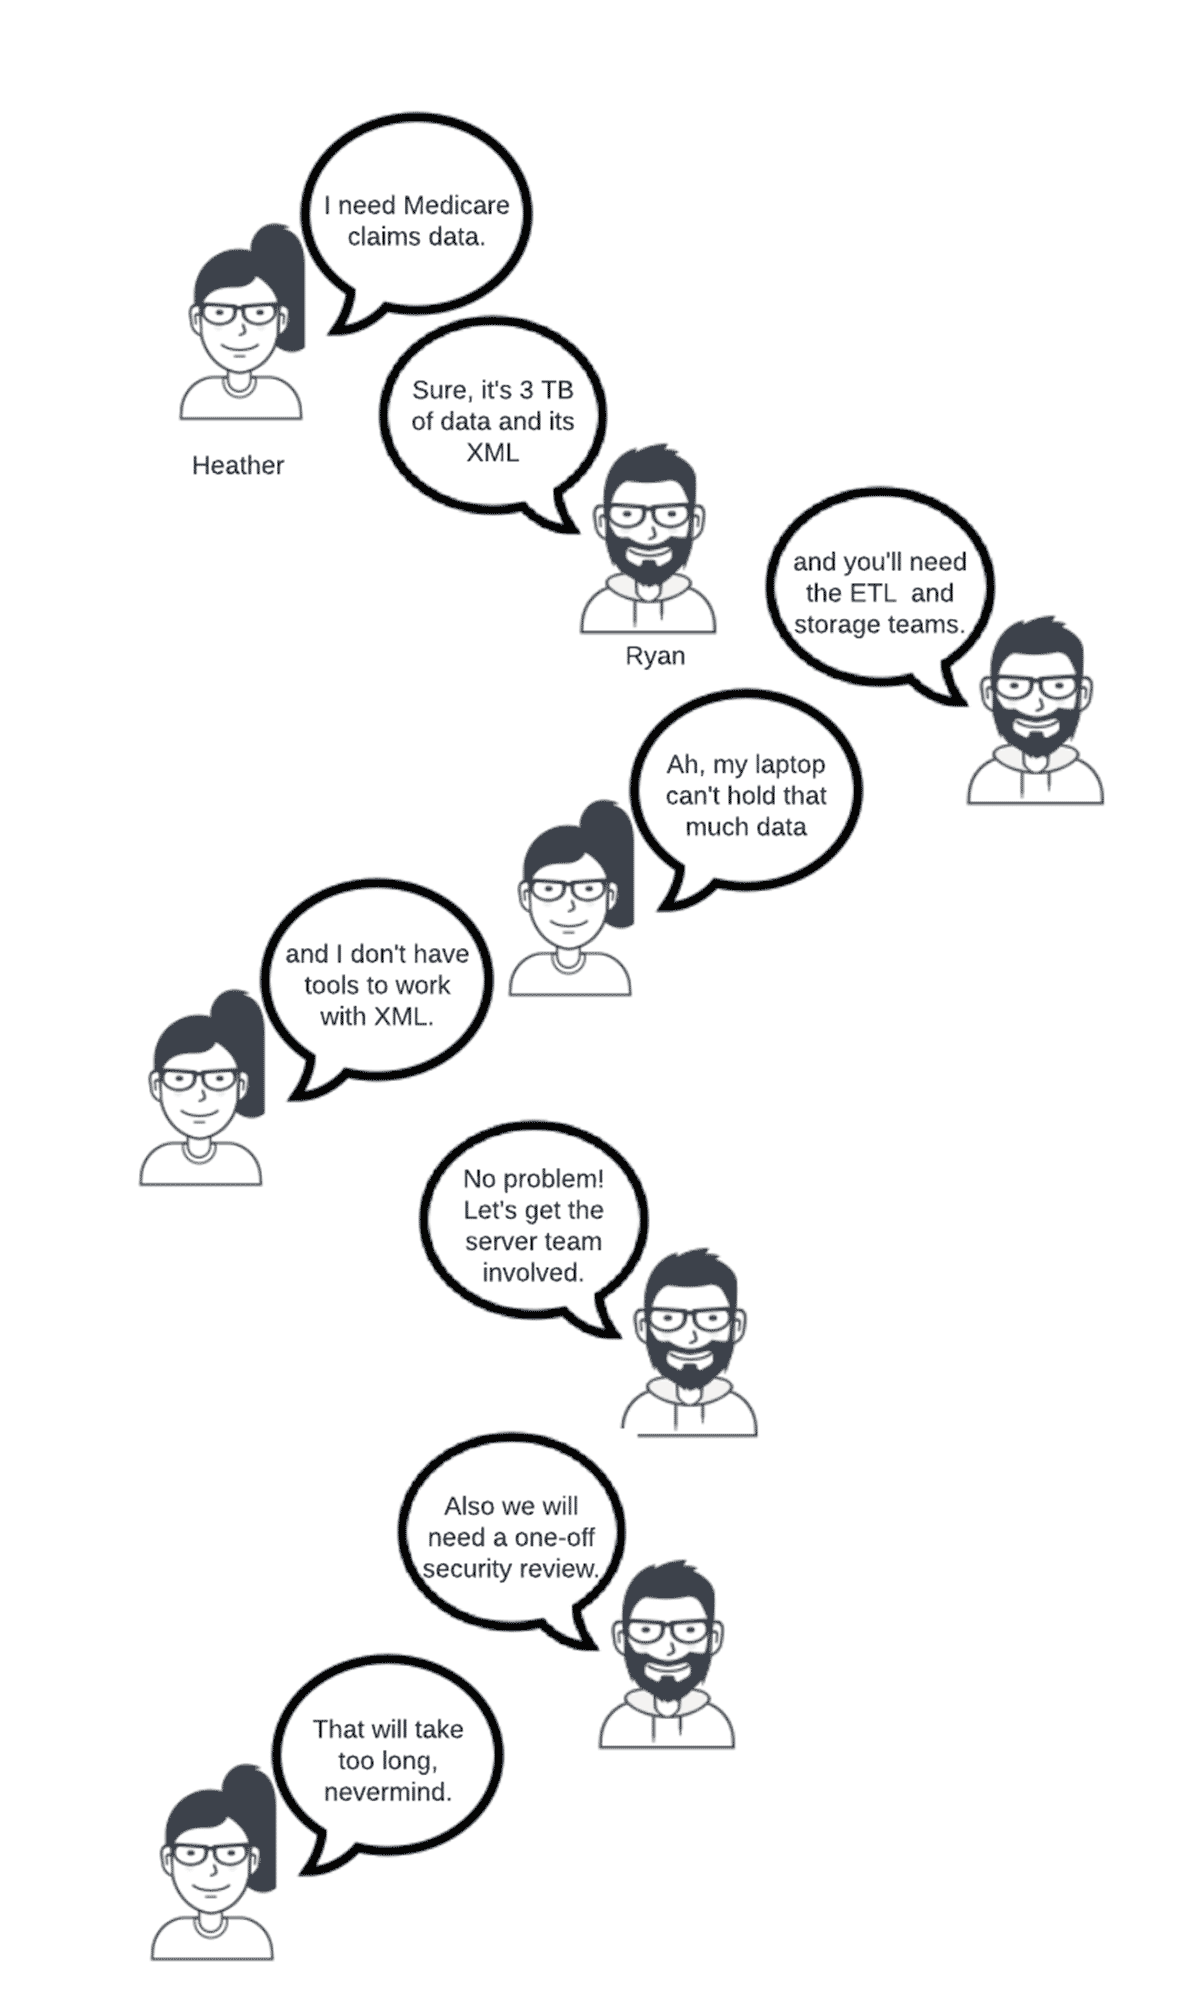
A similarly aggravating process plays out for each additional data source that is needed. Even though in this scenario, accessing sensitive public health data like medical claims would likely require a security review no matter the data platform, consider what would change if Heather had nonsensitive data she sourced locally on her laptop and just needed more compute power than what her laptop was capable of. She would still need:
- The infrastructure team to provide compute
- A data platform to process the data
- The ETL team to load the data into the data platform
- Analytics tools to perform the analysis
Even in a cloud environment, biostatisticians and data analysts are not expected to know how to provide their own database, ETL tools and compute, and so additional teams would need to be involved.
A better way: a modern data platform
Now let's look at how Heather would use Databricks Lakehouse Platform, a modern data platform, to support her initiative. She would:
- Upload her data to her S3, ADLS or GCS account
- Perform any data cleansing required using R, SQL or Python
- Use ephemeral compute for data cleansing and analytics
- Leverage collaborative notebooks to conduct her analysis
- Share the results of her analysis both within Databricks and externally to other BI tools
Note the key differences between the lakehouse and the "way it's always been done." Using the existing skill set of Python, R or SQL, Heather can ingest, cleanse and use the data without going through a lengthy and complex process of coordinating across multiple IT teams.
COVID-19 vaccination rates
Using the lakehouse, we will perform an analysis very similar to the one Heather was attempting to do. Using JSON and CSV files collected from various public data sources, we will upload the data to our cloud storage account, cleanse it and identify what factors are most influential for COVID-19 vaccination rates.
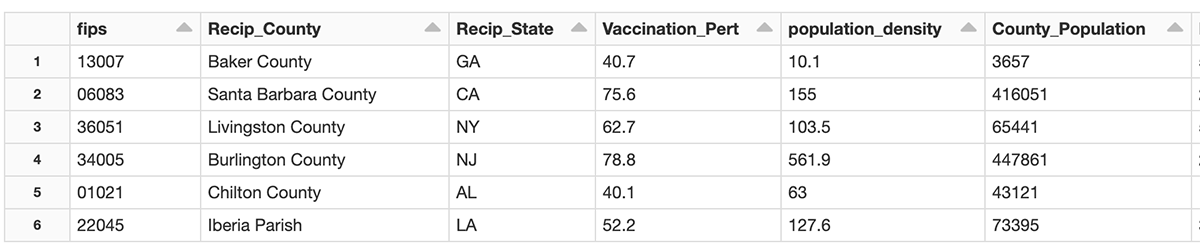
The data is aggregated at a county level and covers the population percentage that is fully vaccinated, as well as data for racial and population density, education and income level, and obesity, cancer, smoking, asthma and health insurance coverage rates. Initially, we will ingest the data in a mostly raw form. This allows for quick data exploration. Below is the step that takes the vaccination rates from a CSV file, performs a simple date parsing step, then saves the data to a Delta table.
Similar steps are repeated for the other data sets to complete the Bronze, or raw, layer of data. Next, the Silver layer of refined data is created where missing data, such as FIPS code, are added and unneeded data is filtered out. The following step creates a health traits table that includes only the traits we are interested in and pivots the table to make it easier to work with for our use case.
After the data cleansing is complete, we have one row per county that includes each attribute we intend on analyzing. Below is a partial listing of the data.
To perform the analysis, we are going to use XGBoost to create a linear regression model. For brevity, only the model setup and training are shown.
The model has a mean square error rate of 6.8%, meaning the vaccination rate could be +/- 6.8% of the actual rate. While we are not interested in predicting future vaccination rates, we can use the model to explain how each attribute influenced the vaccination rate. To perform this analysis we will use SHAP. There is a dedicated Databricks blog entry on SHAP that shows why SHAP is so powerful for calculating the influence the attributes had on the model.
Results
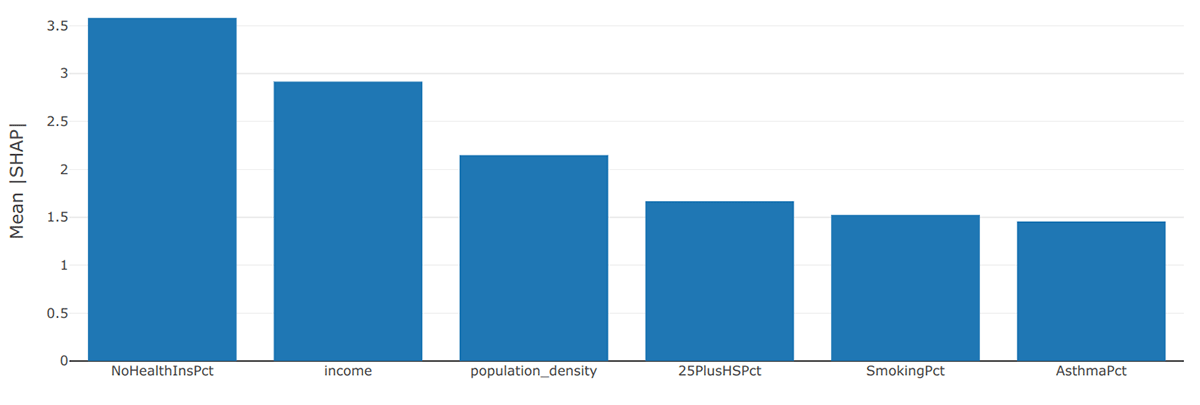
When we summarize and visualize the results for all attributes in every county, we see that lack of health insurance was the most influential factor in determining vaccination rates. What makes this interesting is that the COVID-19 vaccine has been free to everyone, so health insurance or a lack thereof should not have been a barrier to getting vaccinated. After health insurance, level of income and population density rounded out the top three factors.
While creating a model that covers the entire United States is interesting and insightful, local trends may not be apparent on such a large scale. Creating the same model but with the data limited to counties within the state of California produces a very different picture.
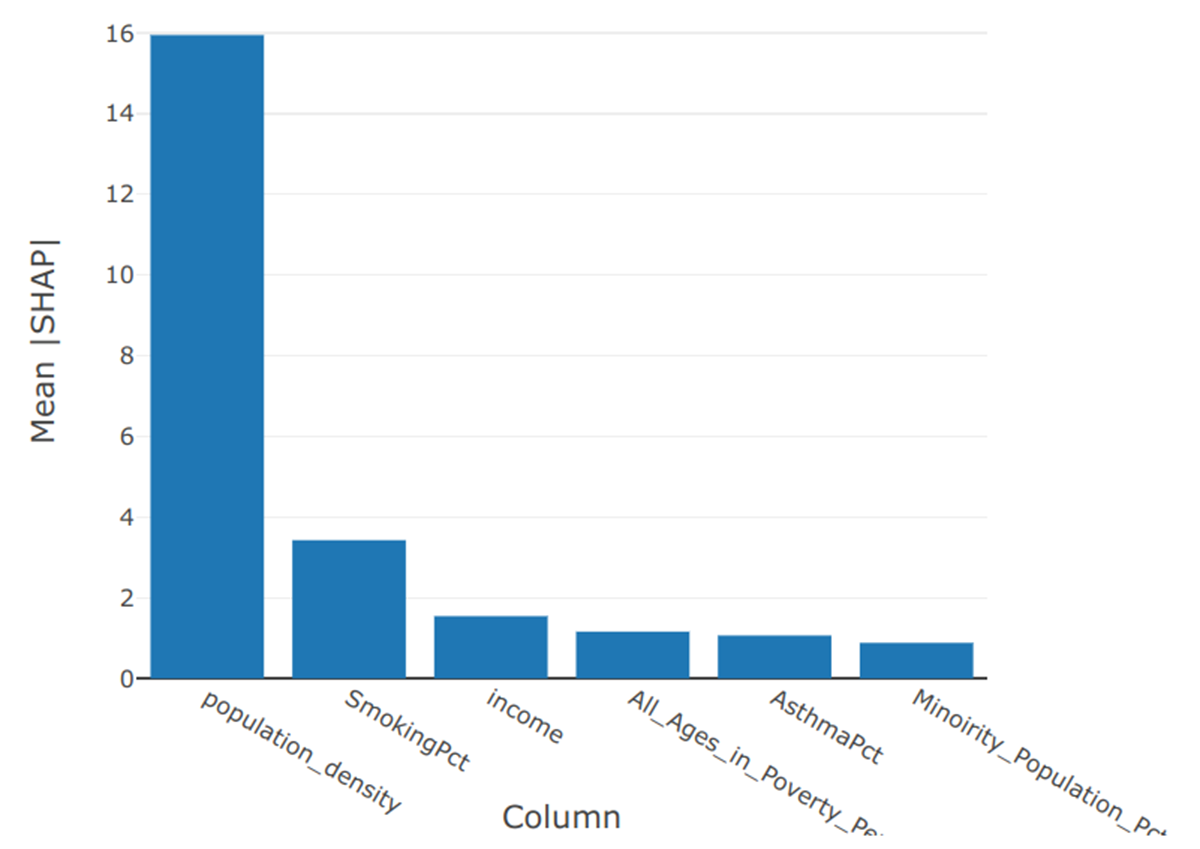
By a large margin, population density was the most influential factor in the vaccination rate of the counties within California. The percentage of the population who identified as smokers was a distant second, whereas health insurance status was not even in the top six factors.
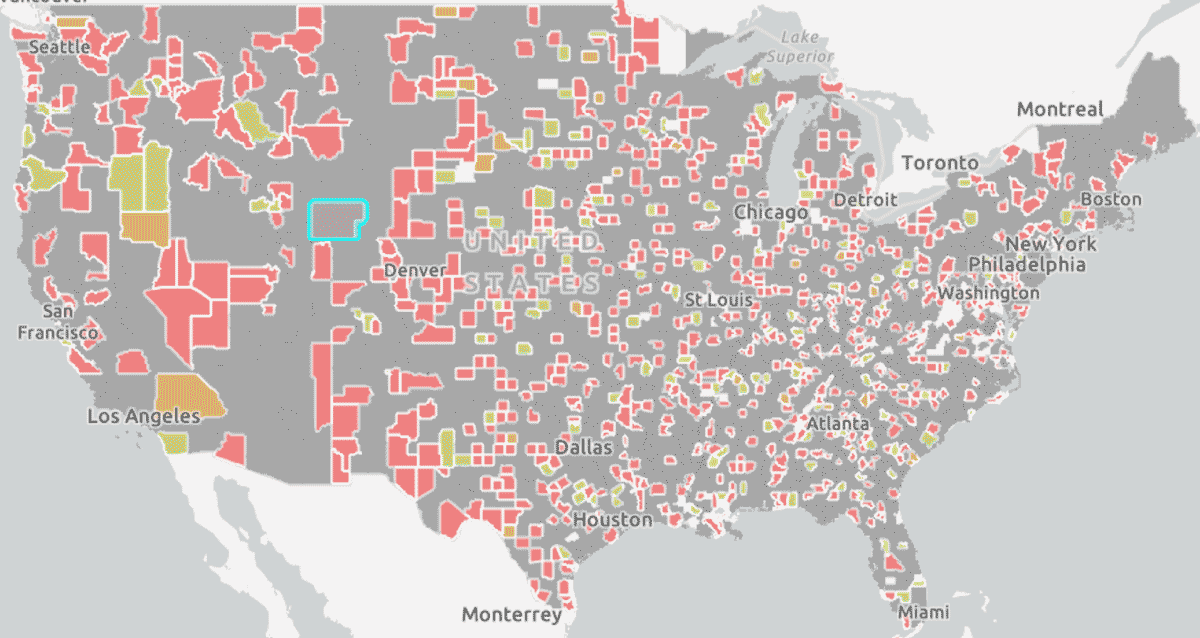
Finally, we can take the top factor for every county from our whole country model and visualize it as a map (below). These details can show us factors that are relevant by state or region and compare them to those of an individual county to understand outliers or patterns. This knowledge can help us begin to address gaps in health equity impacting the most vulnerable members of our constituency.
What's next
Publicly available data sets provide a great starting point in visualizing gaps in population health, as you can see through this example with COVID-19 vaccinations. However, this is one small use case that I hope illustrates the insights possible and progress toward health equity that is within reach when leveraging the Databricks Lakehouse. When we are able to bring together more data from a variety of sources, we can achieve greater insight and positively impact health policy and outcomes for citizens who need our support in ensuring a more equitable distribution of health in the future.
Read more about Data Analytics and AI for State and Local Governments on our Databricks industry page.
Get the latest posts in your inbox
Subscribe to our blog and get the latest posts delivered to your inbox.