Accelerate your model development with the new MLflow Experiments UI

MLflow is the premier platform for model development and experimentation. Thousands of data scientists use MLflow Experiment Tracking every day to find the best candidate models through a powerful GUI-based experience which allows them to view, filter, and sort models based on parameters, performance metrics, and source information.
Today, we are thrilled to announce several major improvements to the MLflow Experiments UI, including a configurable chart view providing visual model performance insights, a revamped parallel coordinates experience for tuning, and a streamlined table view with enhancements for search and filtering. We believe that these improvements will greatly improve the speed of model comparison for data scientists and give them more time to focus on the thing they love doing the most: building awesome models.
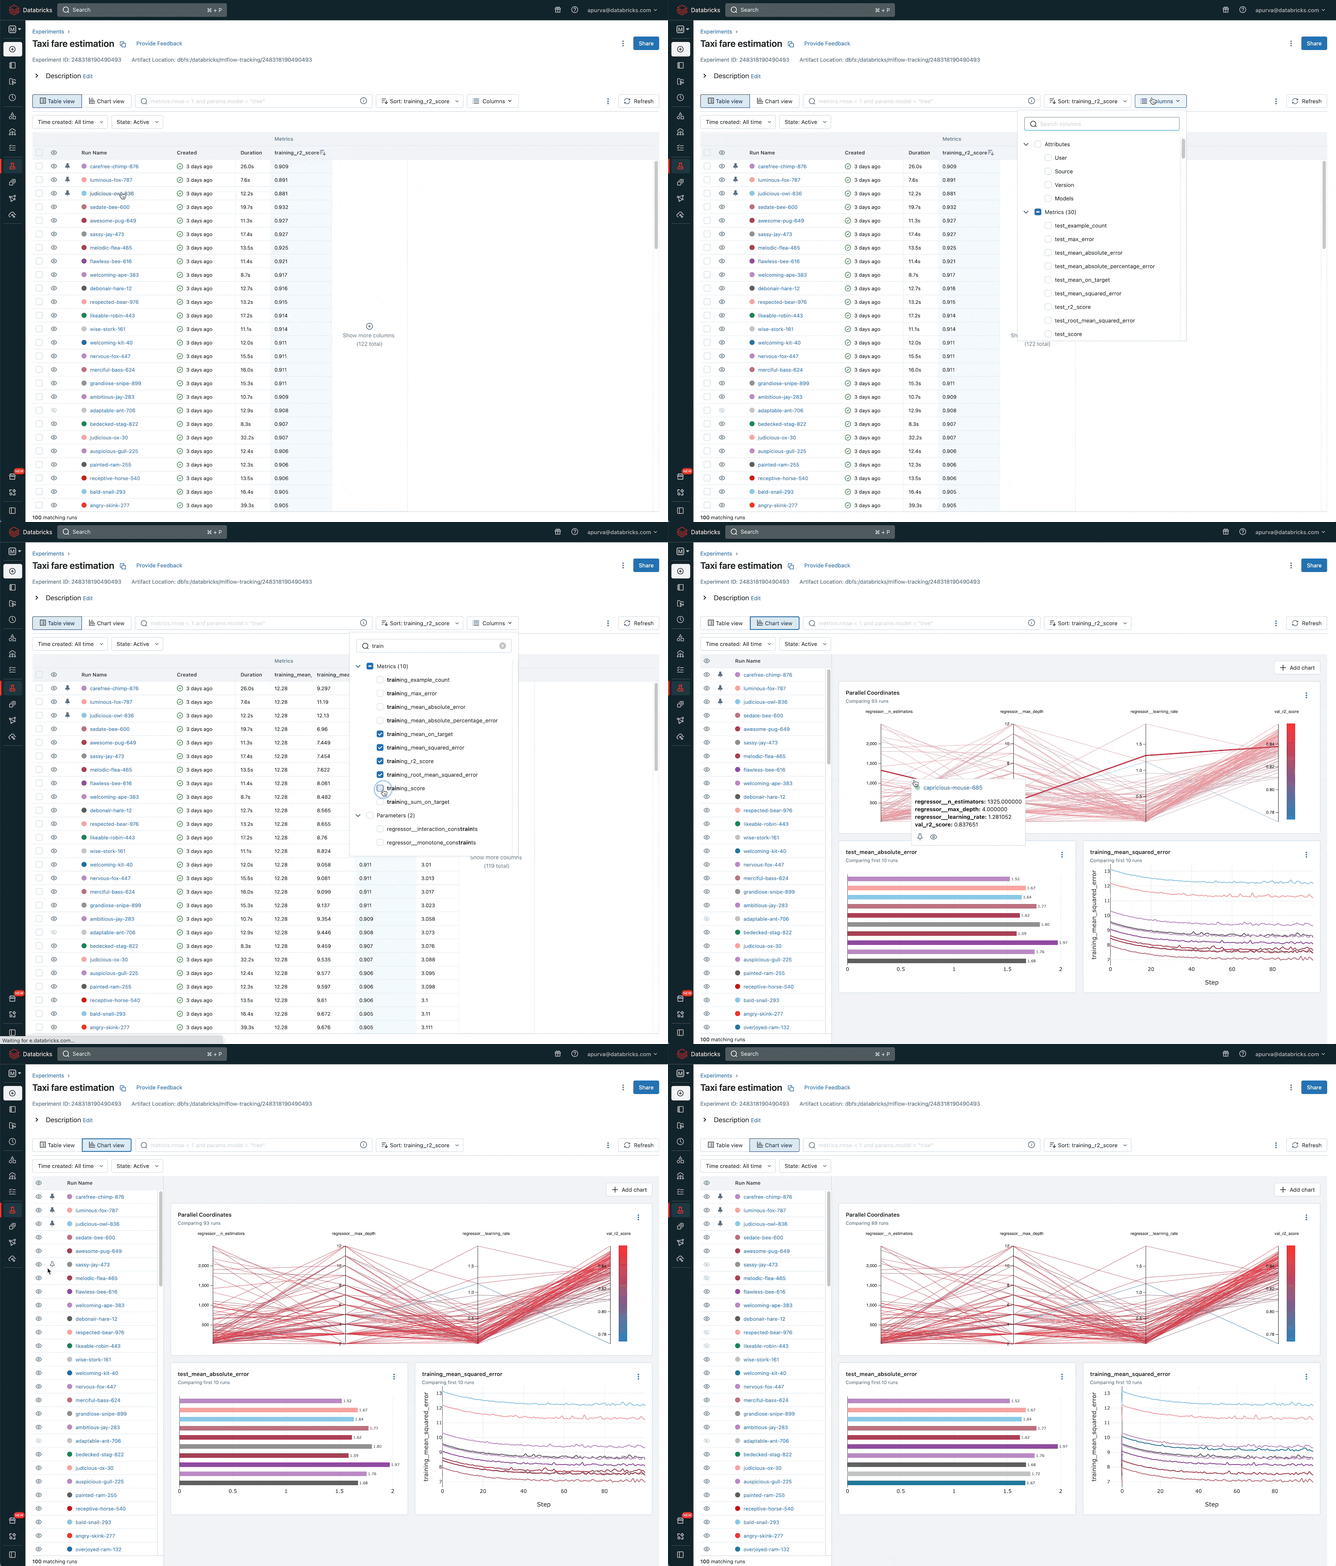
Let's take a look at some of the key enhancements and features of the new MLflow Experiments UI.
Analyze your models' performance with the new chart view
In order to identify the best models for production, data scientists rely heavily on visualizations of their models' parameters and performance metrics. For example, line charts illustrate a model's progress during training to verify that its accuracy is improving, and bar charts provide quick insights into performance differences between multiple models.
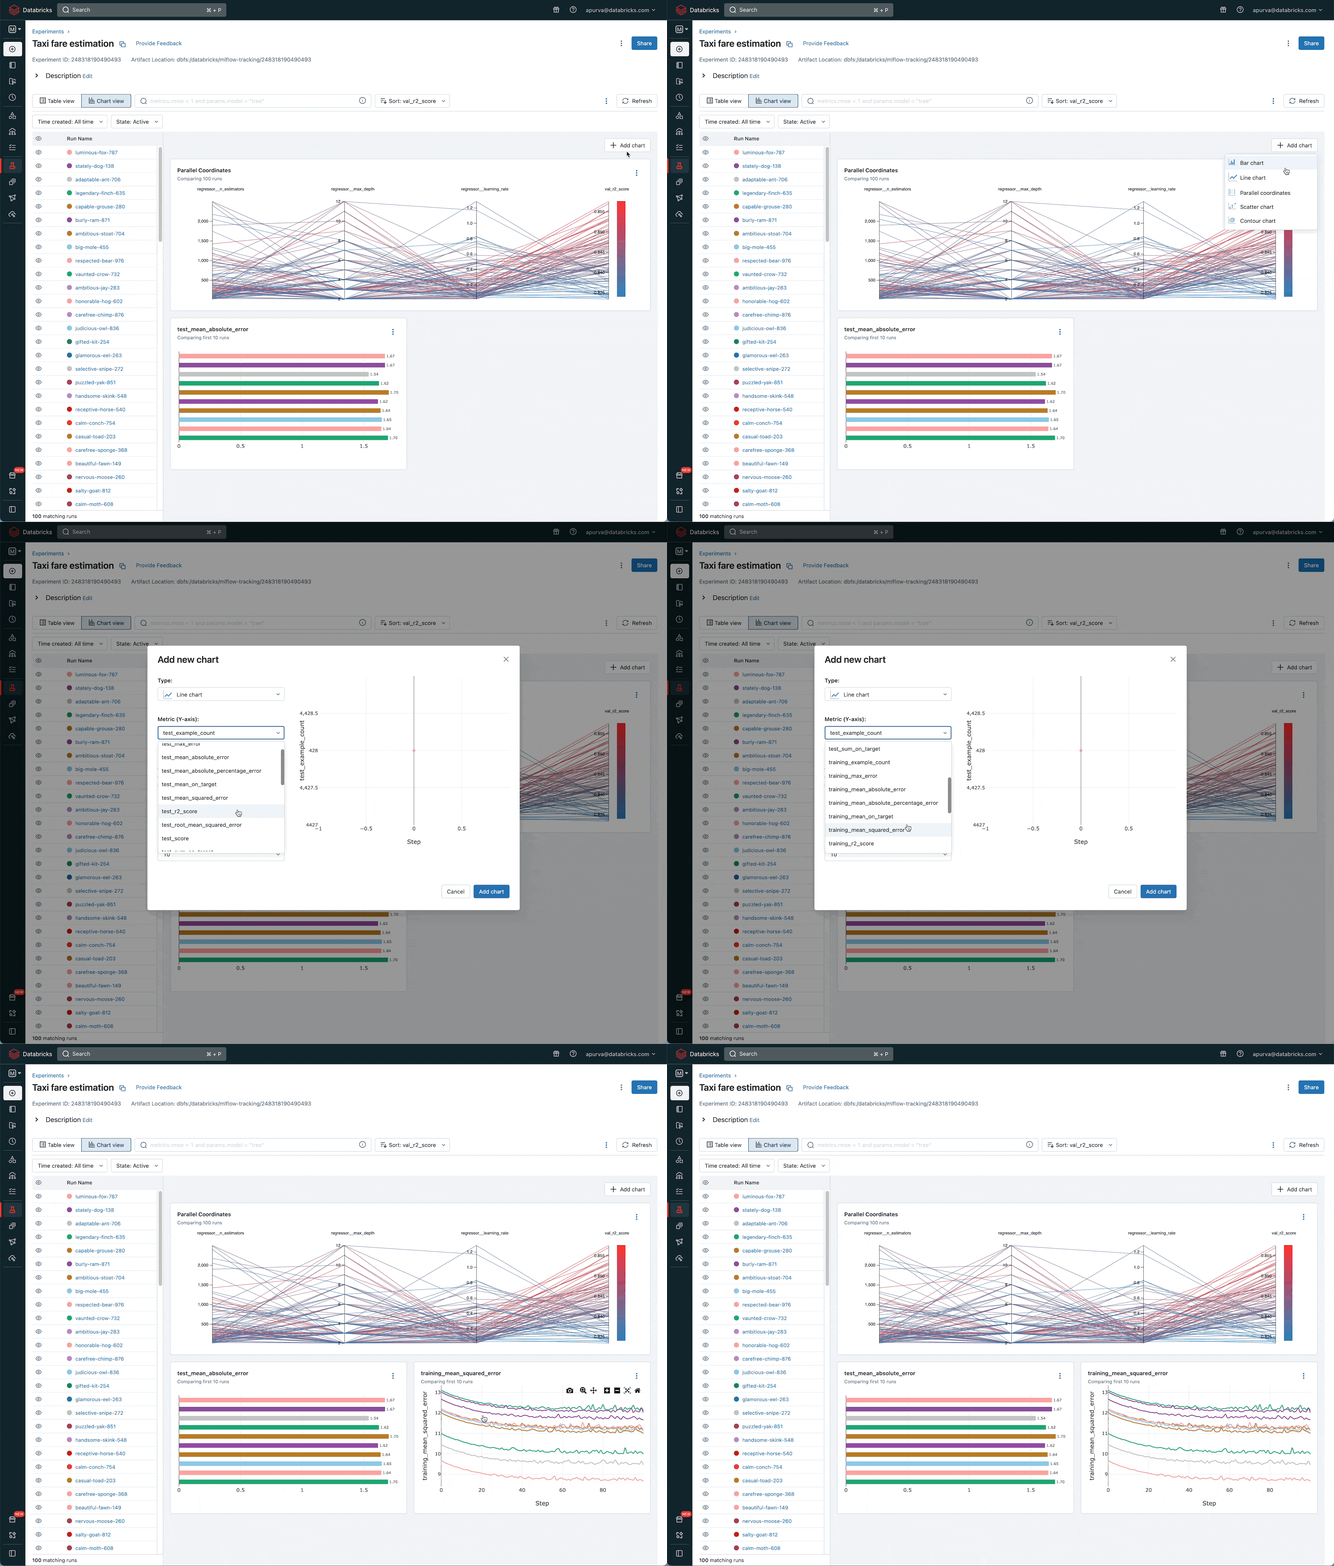
We're excited to introduce a brand new chart view to the MLflow Experiment Page. The chart view is a customizable model performance dashboard, supporting bar, line, scatter, and parallel coordinates plots for all of your models' parameters and metrics. Instead of having to select runs and hit "compare", you can now seamlessly switch back and forth between the table and chart view and choose the mode of run comparison that you prefer. Each chart is configurable and interactive, enabling you to select the axes and data to display, filter data points to find the most relevant results, and pin the best models for future reference. The chart view will dramatically improve your model development experience and velocity, reducing the need for manual plotting and calculations.
Tune your models faster with the revamped parallel coordinates chart
In order to develop high-quality models, data scientists need to carefully select model parameters. This hyperparameter tuning process often requires exploring tens, hundreds, or even thousands of parameters to identify the most important ones. Throughout this process, the parallel coordinates chart is an extremely useful tool for visualizing the relationship between model parameters and performance metrics and how various parameter values might affect a given metric.
Big Book of MLOps
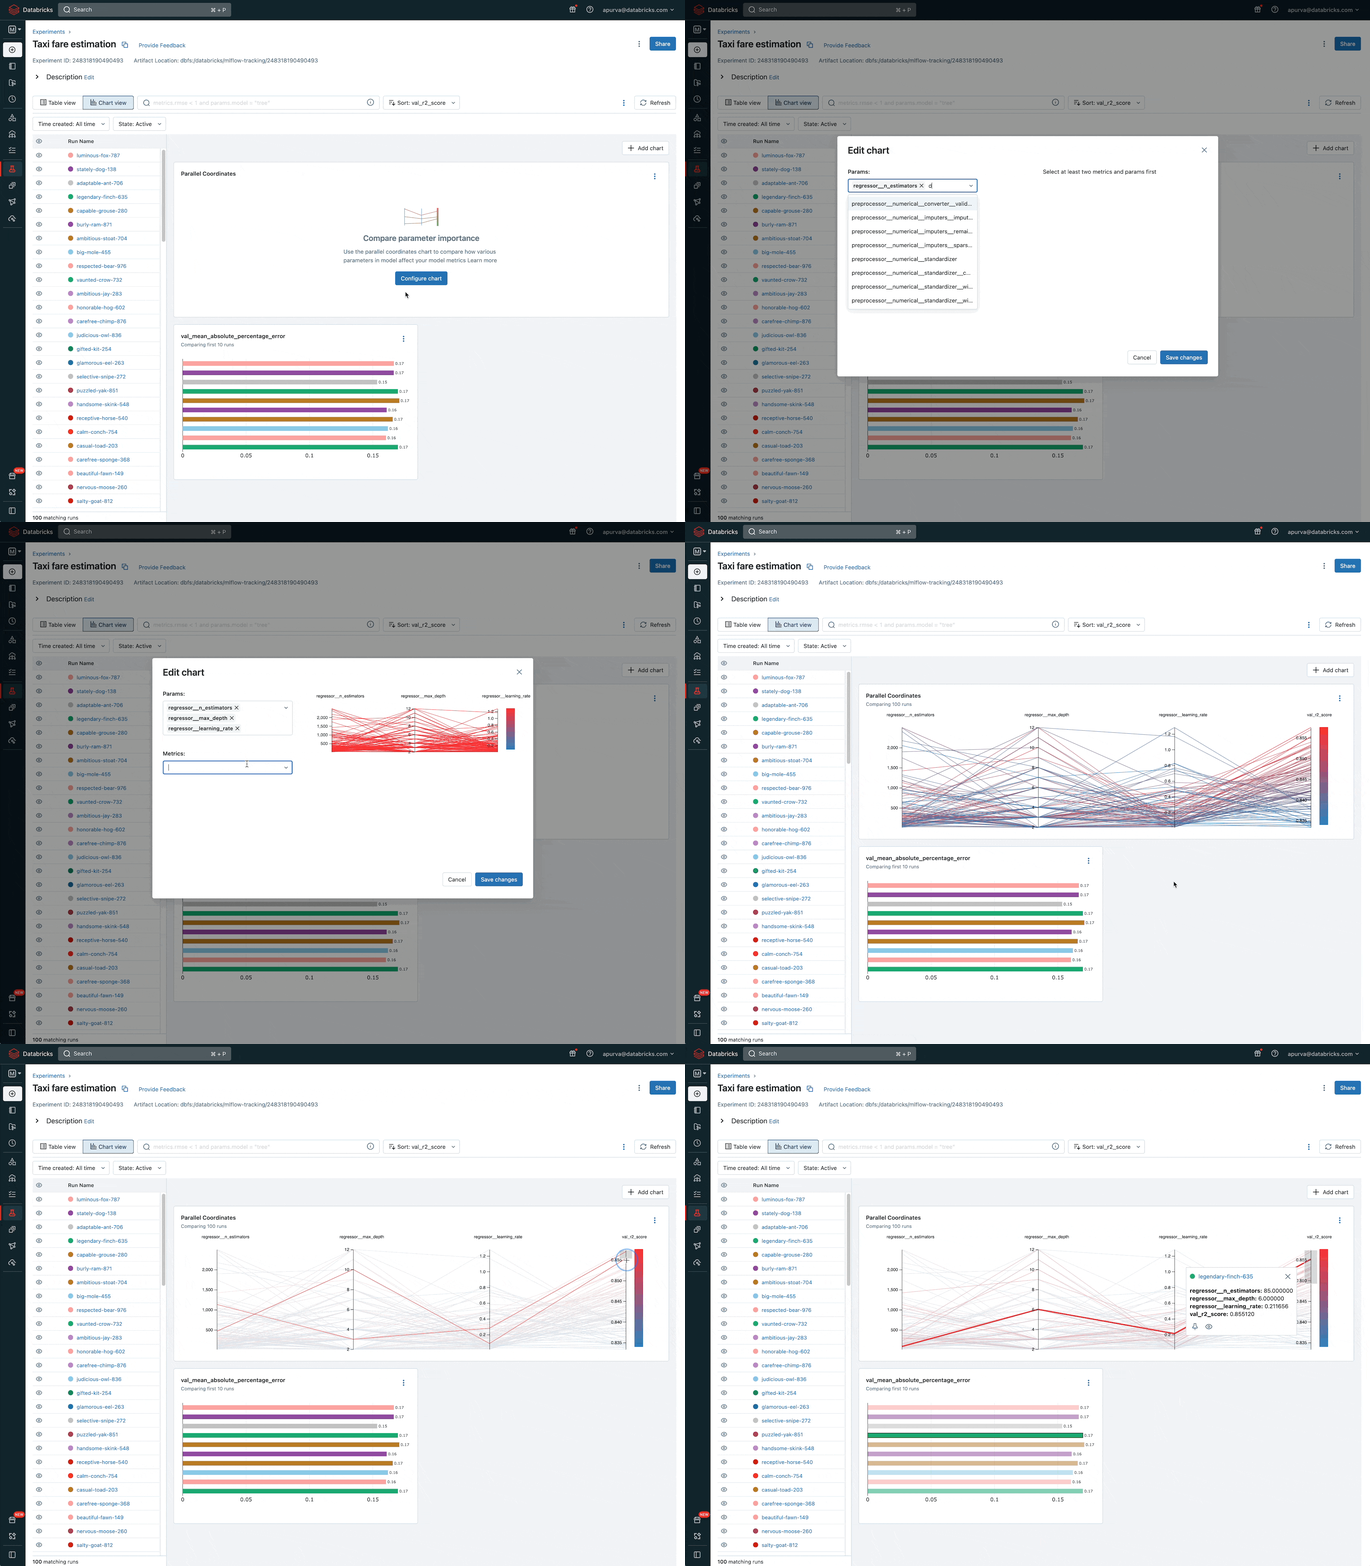
We've embedded the parallel coordinates charts in the new chart view, enabling you to seamlessly analyze parameter combinations from thousands of model training runs simultaneously. Additionally, the parallel coordinates chart has been rebuilt using an advanced visualization framework, delivering an interactive and highly scalable experience. New features include:
- Improved brushing – filter model training runs by desired ranges of parameter and metric values
- Run highlighting – select a particular run from the chart to view all of its metrics and parameters
- Hiding and pinning – remove outliers or keep important runs in view
The revamped parallel coordinates chart will make your model tuning much easier, helping you rapidly build and ship high-quality models.
Find the best models with a streamlined table view and search experience
Model development is an iterative process. Data scientists often explore thousands of candidate models before selecting the best one for production. When new data is collected and application requirements change, models are retrained to ensure that they continue to make accurate predictions. As a result, data scientists need to be able to search and filter their model training results, as well as keep track of the best models as their training progresses. The new MLflow Experiments UI includes several features and improvements to streamline this experience.
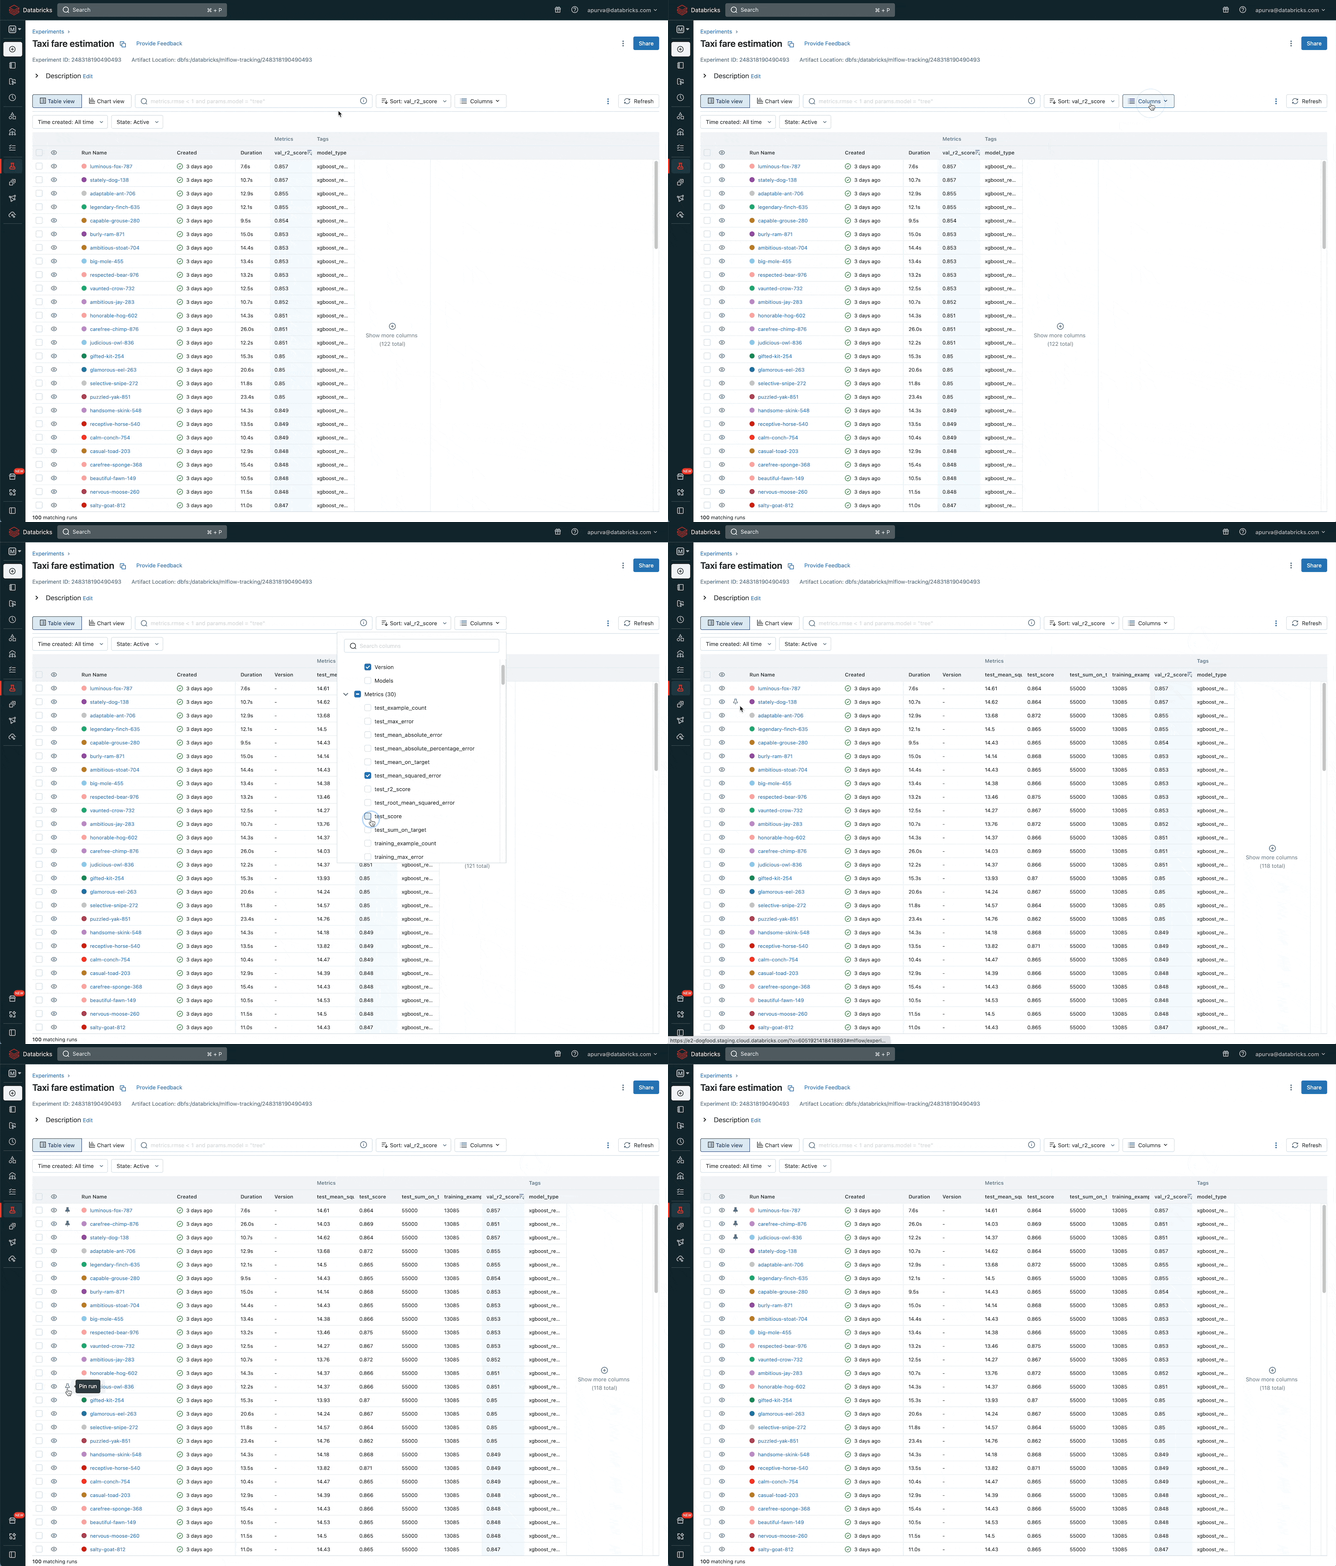
Every MLflow Run you create now has a memorable name to help you identify and compare models. Additionally, you can now pin runs to the top of the Runs table. Pinned runs always remain visible as you continue to filter and explore your model training results, so now you can pin a "baseline" model for quick comparison. Finally, if you're training models with Databricks AutoML or MLflow Recipes, the Experiment Page automatically displays the most relevant performance metrics and model attributes, enabling you to quickly identify the optimal model. Additional model information can easily be displayed using the column selector dropdown.
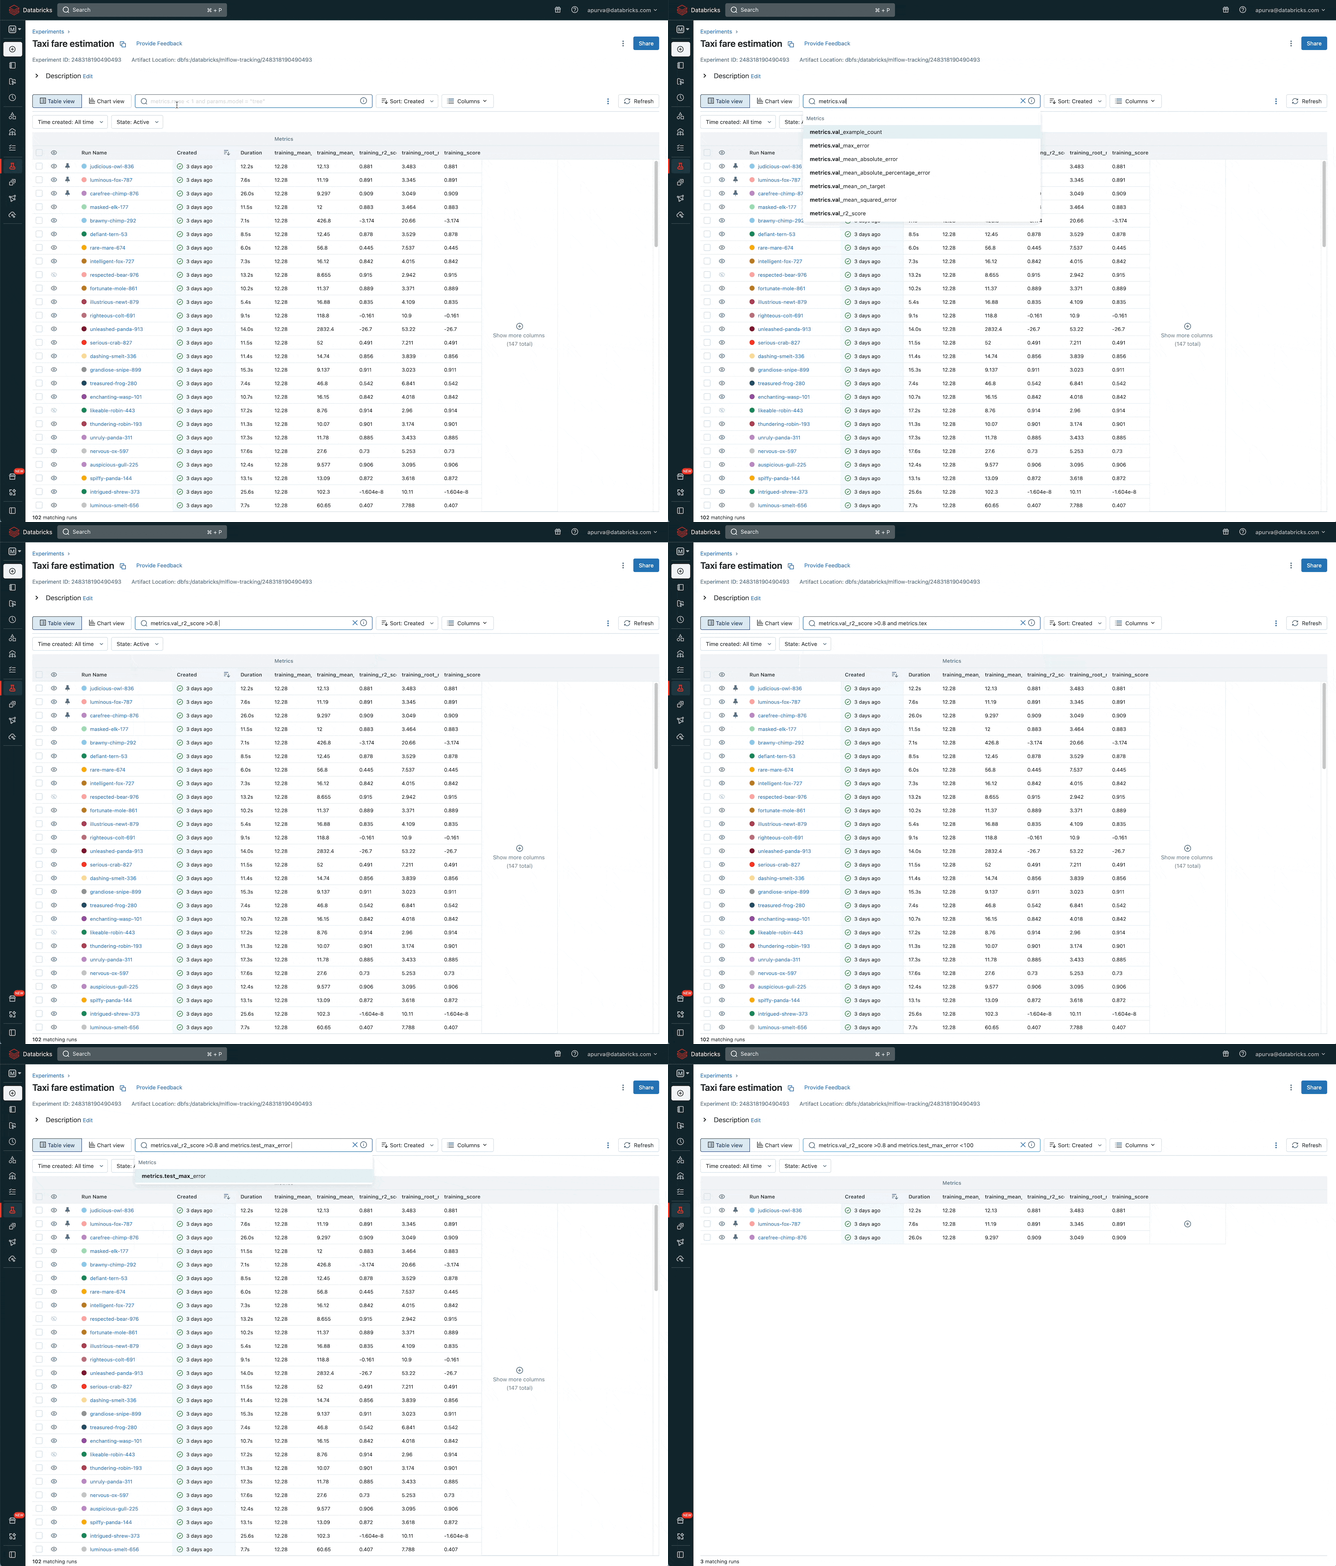
We've also dramatically simplified the search experience on the Experiment experience by integrating automatic suggestion capabilities. Simply type the name of a performance metric or model parameter in the search bar, and the autosuggest dropdown shows you how to use it in your query. The Experiment Page also includes a comprehensive list of example search queries to help you learn the syntax quickly.
Get started with the new MLflow Experiments UI
With the new and improved MLflow Experiments UI, it's never been easier to develop high-quality models at scale and effortlessly identify the optimal models for production. The new experience has already been released in many Databricks workspaces and will soon be available everywhere. Simply navigate to Experiments in the workspace sidebar and select an experiment to get started. We highly recommend exploring everything the new MLflow Experiments UI has to offer and look forward to your feedback!
