Announcing the General Availability of Step-Through Debugging in Databricks Notebooks and Files
We are thrilled to announce the General Availability of a Python step-through debugger for Databricks Notebooks and Files. This highly requested feature allows Databricks users to step through complex code and diagnose errors just as they would in their favorite IDE.
Key features include:
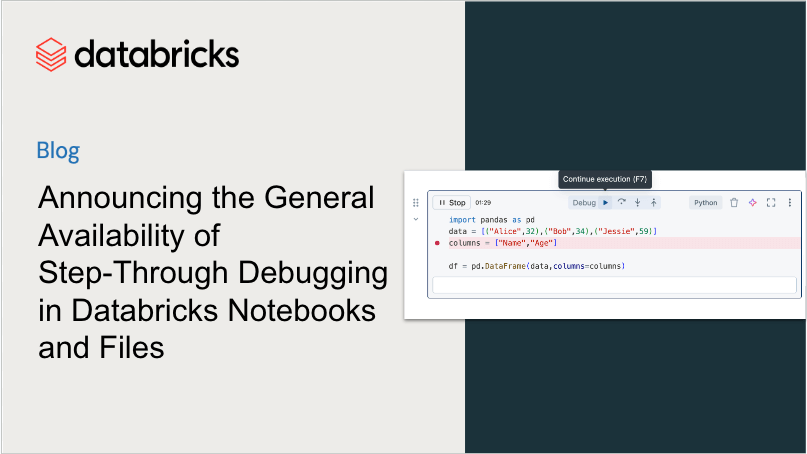
- Simple and powerful debugging UX: Set breakpoints and step through your Python code using a sleek user interface with familiar IDE controls.
- Variable inspection and manipulation: Observe your Notebook state when paused at a breakpoint with an improved Variable Explorer. You can also write Python code in a debug console to inspect and manipulate variables in real time.
- Supported everywhere: This debugging feature is available on all-purpose clusters and Serverless compute.
“The Databricks Notebook Debugger has made it significantly easier to develop sophisticated notebooks entirely within the Databricks environment. The feature has meaningfully improved our team’s productivity and development speed.” - Jackson Buckle, Data Scientist at Cenovus Energy
"The Debugger has helped us detect errors in code more efficiently and empowered us to fix them quickly. I particularly appreciate the debug console which has provided us with real-time visibility into the state of our variables." - Víctor Machuca, Data Engineer at Sigma Alimentos
Simple and powerful debugging UX
Set breakpoints and step through your Python code with precision. With our step-through debugger, you can quickly diagnose errors that you are facing.
Variable Inspection
When paused at a breakpoint, you can execute Python code snippets in the debug console. The debug console allows you to inspect and manipulate your variables, such as Spark DataFrames, in real-time.
We've also improved the Variable Explorer. Now, you can view the schema of DataFrames directly within the Variable Explorer and visualize your variables in the debug console by clicking the “Inspect” button.
Try the new step-through debugger now.
Our step-through debugger is available on various compute options including:
- Serverless compute
- “Single User” and “No Isolation Shared” clusters (DBR 13.3+)
- “Shared” clusters (DBR 15.1 and higher supported, DBR 14.3 coming soon)
Try the new Debugger today and experience a more efficient way to debug your code! If you don’t have a Databricks account, you can get started with a free trial. We look forward to your feedback and are excited to see how this new feature improves your debugging and development experience.
Never miss a Databricks post
What's next?

Platform & Products & Announcements
December 17, 2024/2 min read
