Announcing MLflow 2.4: LLMOps Tools for Robust Model Evaluation

LLMs present a massive opportunity for organizations of all scales to quickly build powerful applications and deliver business value. Where data scientists used to spend thousands of hours training and retraining models to perform very limited tasks, they can now leverage a wide foundation of SaaS and open source models to deliver much more versatile and intelligent applications in a fraction of the time. Using few-shot and zero-shot learning techniques like prompt engineering, data scientists can quickly build high-accuracy classifiers for diverse sets of data, state-of-the-art sentiment analysis models, low-latency document summarizers, and much more.
However, in order to identify the best models for production and deploy them safely, organizations need the right tools and processes in place. One of the most critical components is robust model evaluation. With model quality challenges like hallucination, response toxicity, and vulnerability to prompt injection, as well a lack of ground truth labels for many tasks, data scientists need to be extremely diligent about evaluating their models’ performance on a wide variety of data. Data scientists also need to be able to identify subtle differences between multiple model candidates to select the best one for production. Now more than ever, you need an LLMOps platform that provides a detailed performance report for every model , helps you identify weaknesses and vulnerabilities long before production, and streamlines model comparison.
To meet these needs, we’re thrilled to announce the arrival of MLflow 2.4, which provides a comprehensive set of LLMOps tools for model evaluation. With new mlflow.evaluate() integrations for language tasks, a brand new Artifact View UI for comparing text outputs across multiple model versions, and long-anticipated dataset tracking capabilities, MLflow 2.4 accelerates development with LLMs.
Capture performance insights with mlflow.evaluate() for language models
To assess the performance of a language model, you need to feed it a variety of input datasets, record the corresponding outputs, and compute domain-specific metrics. In MLflow 2.4, we’ve extended MLflow’s powerful evaluation API - mlflow.evaluate() - to dramatically simplify this process. With a single line of code, you can track model predictions and performance metrics for a wide variety of tasks with LLMs, including text summarization, text classification, question answering, and text generation. All of this information is recorded to MLflow Tracking, where you can inspect and compare performance evaluations across multiple models in order to select the best candidates for production.
The following example code uses mlflow.evaluate() to quickly capture performance information for a summarization model:
For more information about the mlflow.evaluate(), including usage examples, check out the MLflow Documentation and examples repository.
Inspect and compare LLM outputs with the new Artifact View
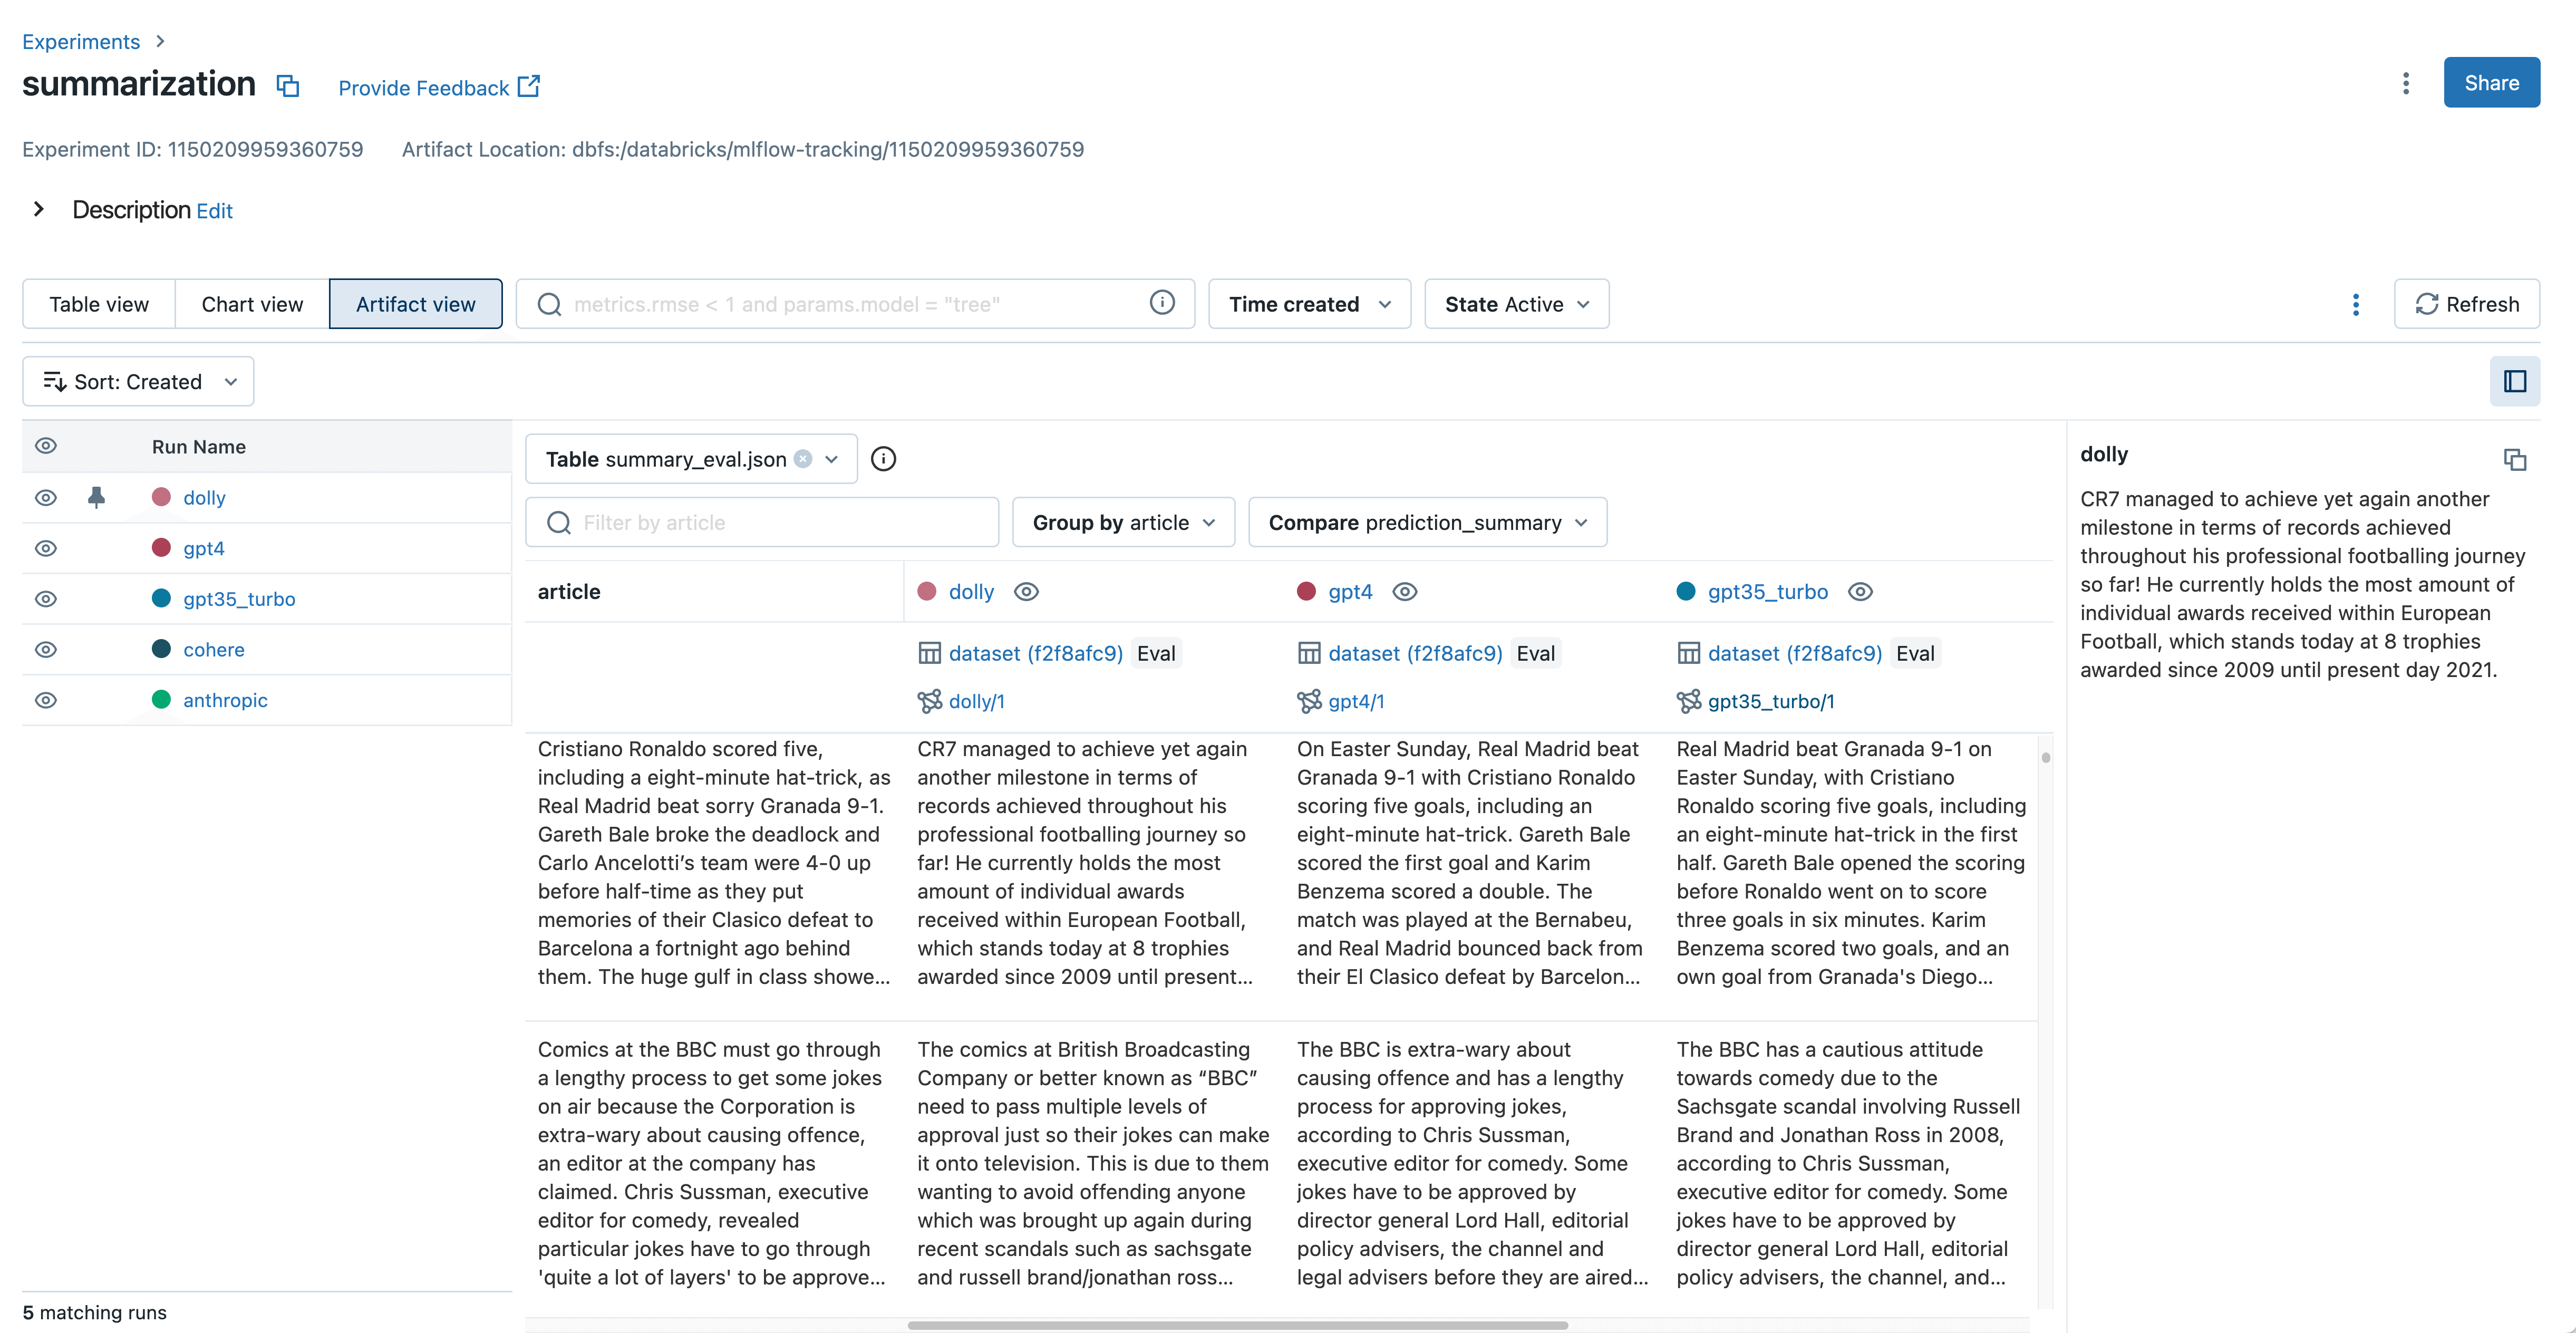
Without ground truth labels, many LLM developers need to manually inspect model outputs to assess quality. This often means reading through text produced by the model, such as document summaries, answers to complex questions, and generated prose. When selecting the best model for production, these text outputs need to be grouped and compared across models. For example, when developing a document summarization model with LLMs, it’s important to see how each model summarizes a given document and identify differences.

Gartner®: Databricks Cloud Database Leader
In MLflow 2.4, the new Artifact View in MLflow Tracking streamlines this output inspection and comparison. With just a few clicks, you can view and compare text inputs, outputs, and intermediate results from mlflow.evaluate() across all of your models. This makes it very easy to identify bad outputs and understand which prompt was used during inference. With the new mlflow.load_table() API in MLflow 2.4, you can also download all of the evaluation results displayed in the Artifact View for use with Databricks SQL, data labeling, and more. This is demonstrated in the following code example:
Track your evaluation datasets to ensure accurate comparisons
Choosing the best model for production requires thorough comparison of performance across different model candidates. A crucial aspect of this comparison is ensuring that all models are evaluated using the same dataset(s). After all, selecting a model with the best reported accuracy only makes sense if every model considered was evaluated on the same dataset.
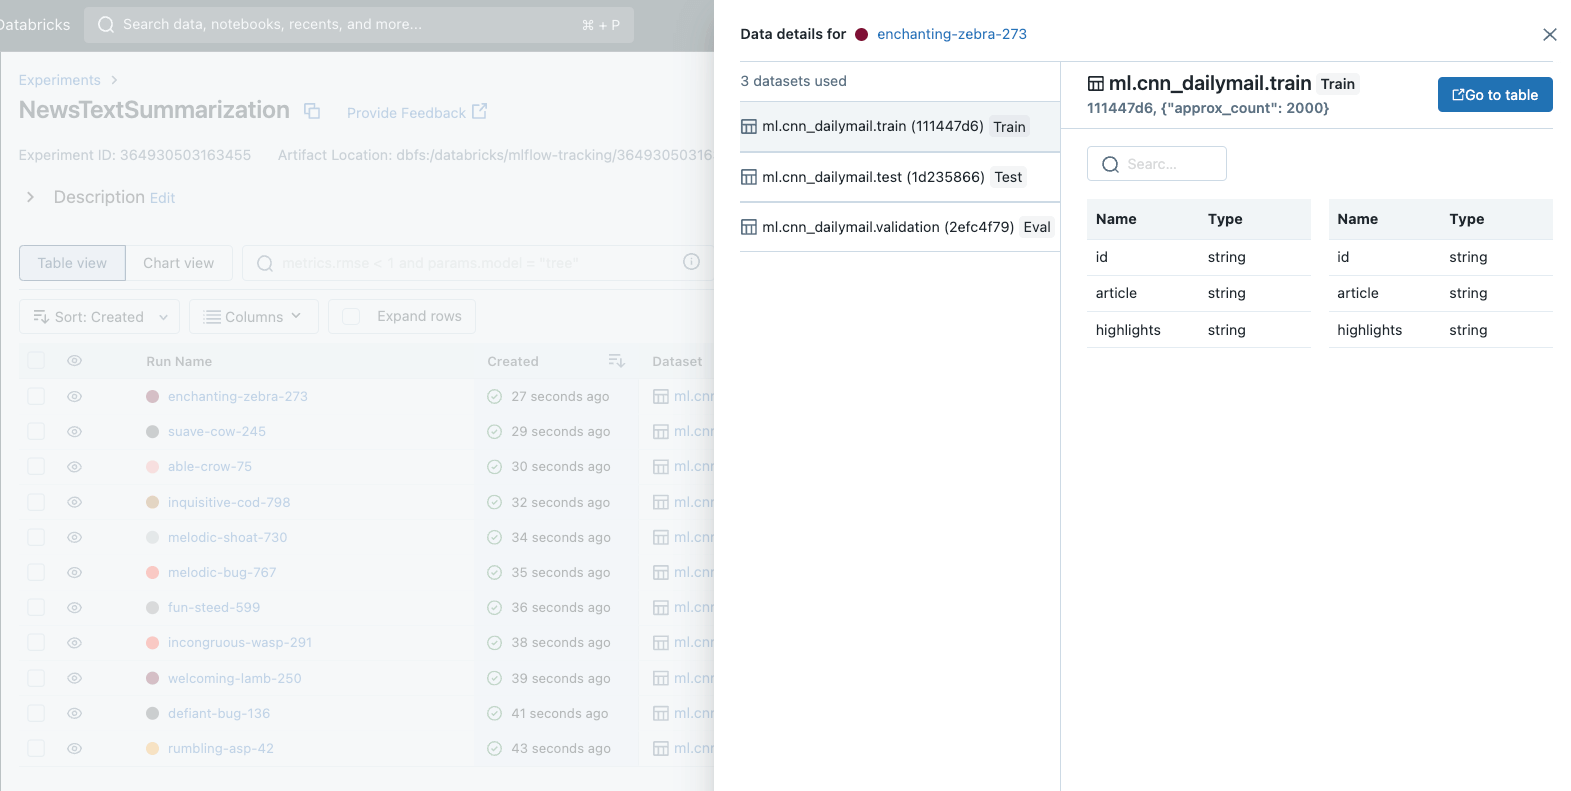
In MLflow 2.4, we are thrilled to introduce a long-anticipated feature to MLflow - Dataset Tracking. This exciting new feature standardizes the way you manage and analyze datasets during model development. With dataset tracking, you can quickly identify which datasets were used to develop and evaluate each of your models, ensuring fair comparison and simplifying model selection for production deployment.

It’s very easy to get started with dataset tracking in MLflow. To record dataset information to any of your MLflow Runs, simply call the mlflow.log_input() API. Dataset tracking has also been integrated with Autologging in MLflow, providing data insights with no additional code required. All of this dataset information is displayed prominently in the MLflow Tracking UI for analysis and comparison. The following example demonstrates how to use mlflow.log_input() to log a training dataset to a run, retrieve information about the dataset from the run, and load the dataset’s source:
For more dataset tracking information and usage guides, check out the MLflow Documentation.
Get started with LLMOps tools in MLflow 2.4
With the introduction of mlflow.evaluate() for language models, a new Artifact View for language model comparison, and comprehensive dataset tracking, MLflow 2.4 continues to empower users to build more robust, accurate, and reliable models. In particular, these enhancements dramatically improve the experience of developing applications with LLMs.
We are excited for you to experience the new features of MLflow 2.4 for LLMOps. If you're an existing Databricks user, you can start using MLflow 2.4 today by installing the library in your notebook or cluster. MLflow 2.4 will also be preinstalled in version 13.2 of the Databricks Machine Learning Runtime. Visit the Databricks MLflow guide [AWS][Azure][GCP] to get started. If you're not yet a Databricks user, visit databricks.com/product/managed-mlflow to learn more and start a free trial of Databricks and Managed MLflow 2.4. For a complete list of new features and improvements in MLflow 2.4, see the release changelog.
