Applying software development & DevOps best practices to Delta Live Table pipelines
Implementing unit/integration tests & CI/CD for Delta Live Tables

Databricks Delta Live Tables (DLT) radically simplifies the development of the robust data processing pipelines by decreasing the amount of code that data engineers need to write and maintain. And also reduces the need for data maintenance & infrastructure operations, while enabling users to seamlessly promote code & pipelines configurations between environments. But people still need to perform testing of the code in the pipelines, and we often get questions on how people can do it efficiently.
In this blog post we’ll cover the following items based on our experience working with multiple customers:
- How to apply DevOps best practices to Delta Live Tables.
- How to structure the DLT pipeline's code to facilitate unit & integration testing.
- How to perform unit testing of individual transformations of your DLT pipeline.
- How to perform integration testing by executing the full DLT pipeline.
- How to promote the DLT assets between stages.
- How to put everything together to form a CI/CD pipeline (with Azure DevOps as an example).
Applying DevOps practices to DLT: The big picture
The DevOps practices are aimed at shortening the software development life cycle (SDLC) providing the high quality at the same time. Typically they include below steps:
- Version control of the source code & infrastructure.
- Code reviews.
- Separation of environments (development/staging/production).
- Automated testing of individual software components & the whole product with the unit & integration tests.
- Continuous integration (testing) & continuous deployment of changes (CI/CD).
All of these practices can be applied to Delta Live Tables pipelines as well:
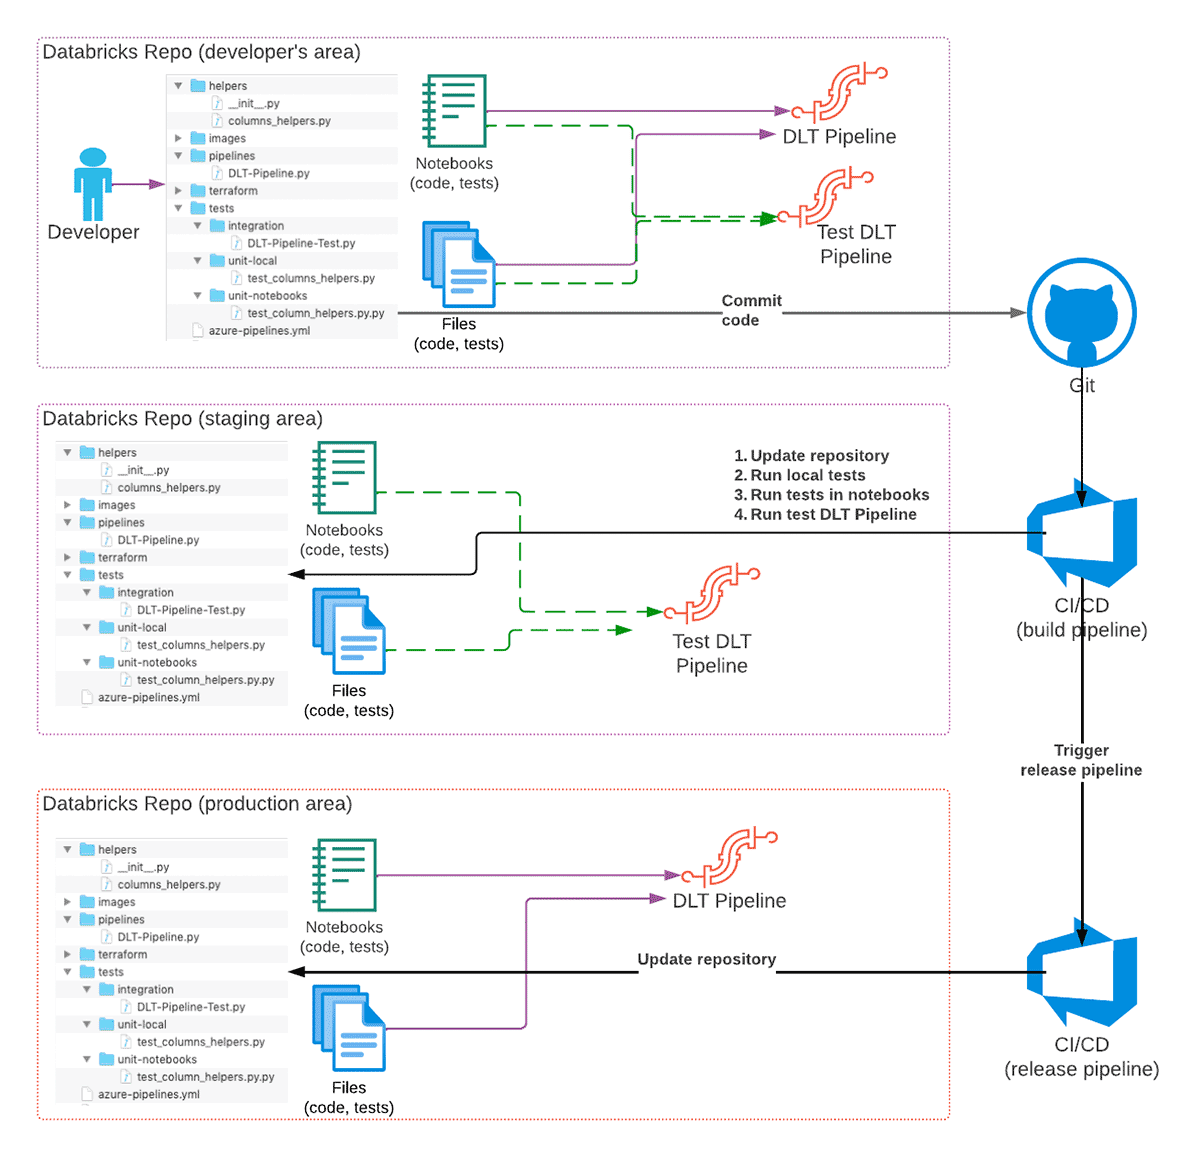
To achieve this we use the following features of Databricks product portfolio:
- Databricks Repos provide an interface to different Git services, so we can use them for code versioning, integration with CI/CD systems, and promotion of the code between environments.
- Databricks CLI (or Databricks REST API) to implement CI/CD pipelines.
- Databricks Terraform Provider for deployment of all necessary infrastructure & keeping it up to date.
The recommended high-level development workflow of a DLT pipeline is as following:
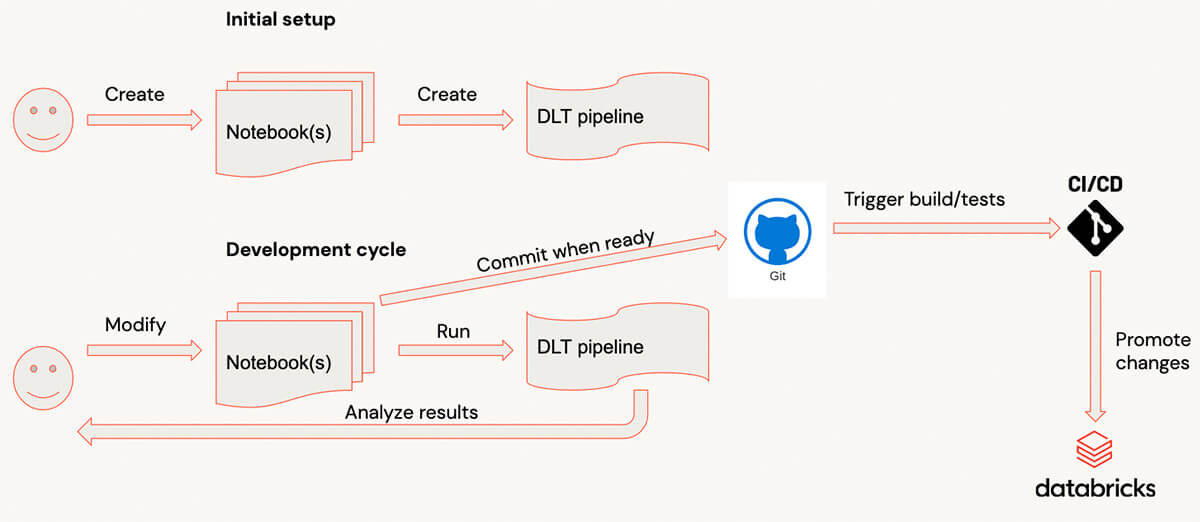
- A developer is developing the DLT code in their own checkout of a Git repository using a separate Git branch for changes.
- When code is ready & tested, code is committed to Git and a pull request is created.
- CI/CD system reacts to the commit and starts the build pipeline (CI part of CI/CD) that will update a staging Databricks Repo with the changes, and trigger execution of unit tests.
a) Optionally, the integration tests could be executed as well, although in some cases this could be done only for some branches, or as a separate pipeline. - If all tests are successful and code is reviewed, the changes are merged into the main (or a dedicated branch) of the Git repository.
- Merging of changes into a specific branch (for example, releases) may trigger a release pipeline (CD part of CI/CD) that will update the Databricks Repo in the production environment, so code changes will take effect when pipeline runs next time.
As illustration for the rest of the blog post we'll use a very simple DLT pipeline consisting just of two tables, illustrating typical bronze/silver layers of a typical Lakehouse architecture. Complete source code together with deployment instructions is available on GitHub.

Note: DLT provides both SQL and Python APIs, in most of the blog we focus on Python implementation, although we can apply most of the best practices also for SQL-based pipelines.
Development cycle with Delta Live Tables
When developing with Delta Live Tables, typical development process looks as follows:
- Code is written in the notebook(s).
- When another piece of code is ready, a user switches to DLT UI and starts the pipeline. (To make this process faster it’s recommended to run the pipeline in the Development mode, so you don’t need to wait for resources again and again).
- When a pipeline is finished or failed because of the errors, the user analyzes results, and adds/modifies the code, repeating the process.
- When code is ready, it’s committed.
For complex pipelines, such dev cycle could have a significant overhead because the pipeline’s startup could be relatively long for complex pipelines with dozens of tables/views and when there are many libraries attached. For users it would be easier to get very fast feedback by evaluating the individual transformations & testing them with sample data on interactive clusters.
Structuring the DLT pipeline's code
To be able to evaluate individual functions & make them testable it's very important to have correct code structure. Usual approach is to define all data transformations as individual functions receiving & returning Spark DataFrames, and call these functions from DLT pipeline functions that will form the DLT execution graph. The best way to achieve this is to use files in repos functionality that allows to expose Python files as normal Python modules that could be imported into Databricks notebooks or other Python code. DLT natively supports files in repos that allows importing Python files as Python modules (please note, that when using files in repos, the two entries are added to the Python’s sys.path - one for repo root, and one for the current directory of the caller notebook). With this, we can start to write our code as a separate Python file located in the dedicated folder under the repo root that will be imported as a Python module:
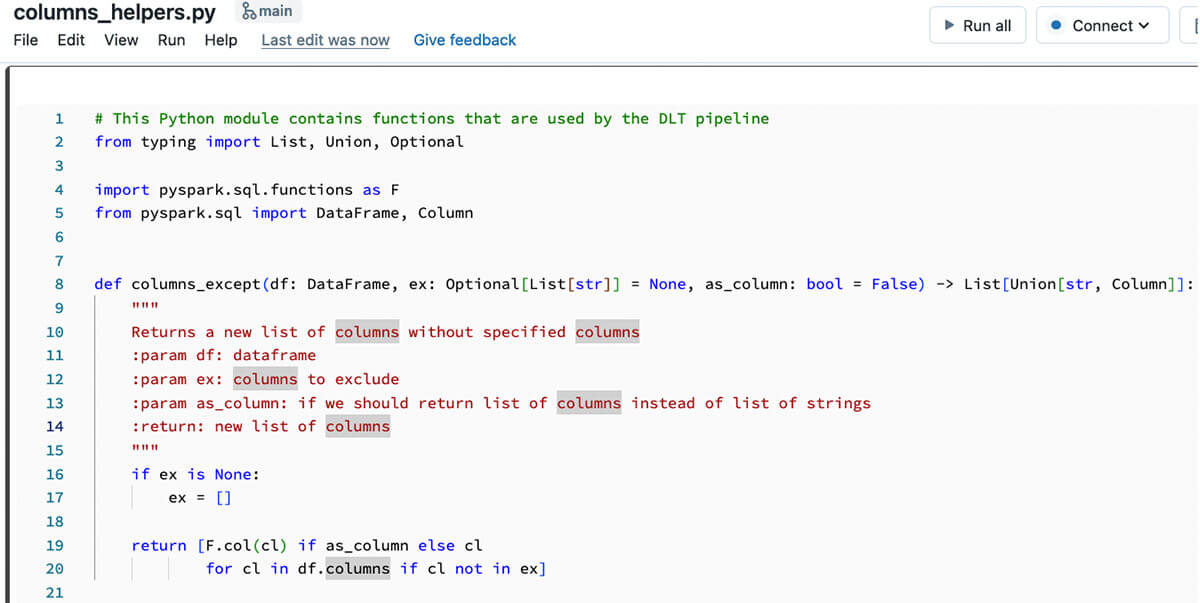
And the code from this Python package could be used inside the DLT pipeline code:
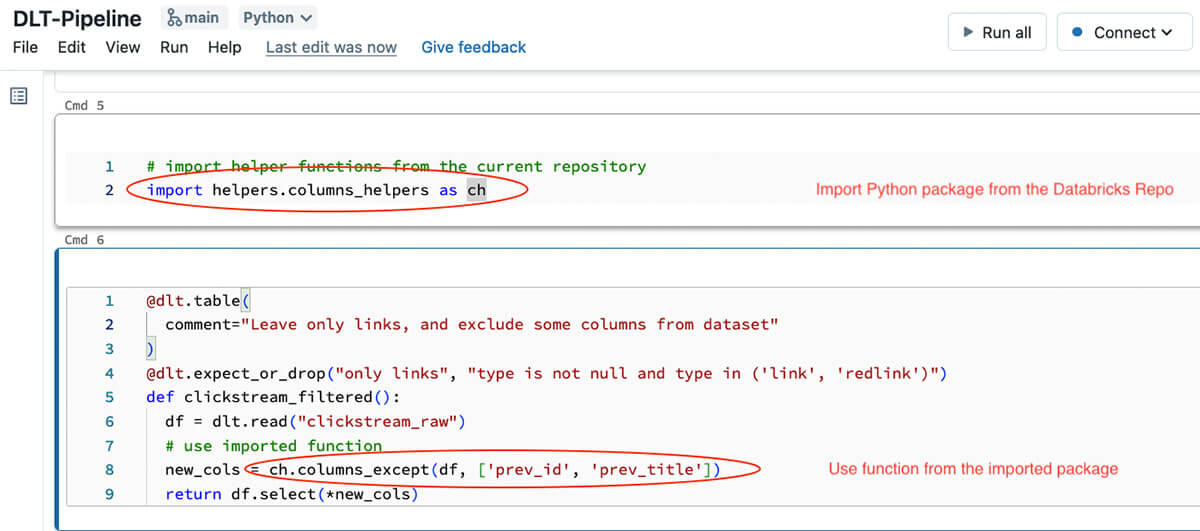
Note, that function in this particular DLT code snippet is very small - all it's doing is just reading data from the upstream table, and applying our transformation defined in the Python module. With this approach we can make DLT code simpler to understand and easier to test locally or using a separate notebook attached to an interactive cluster. Splitting the transformation logic into a separate Python module allows us to interactively test transformations from notebooks, write unit tests for these transformations and also test the whole pipeline (we'll talk about testing in the next sections).
The final layout of the Databricks Repo, with unit & integration tests, may look as following:
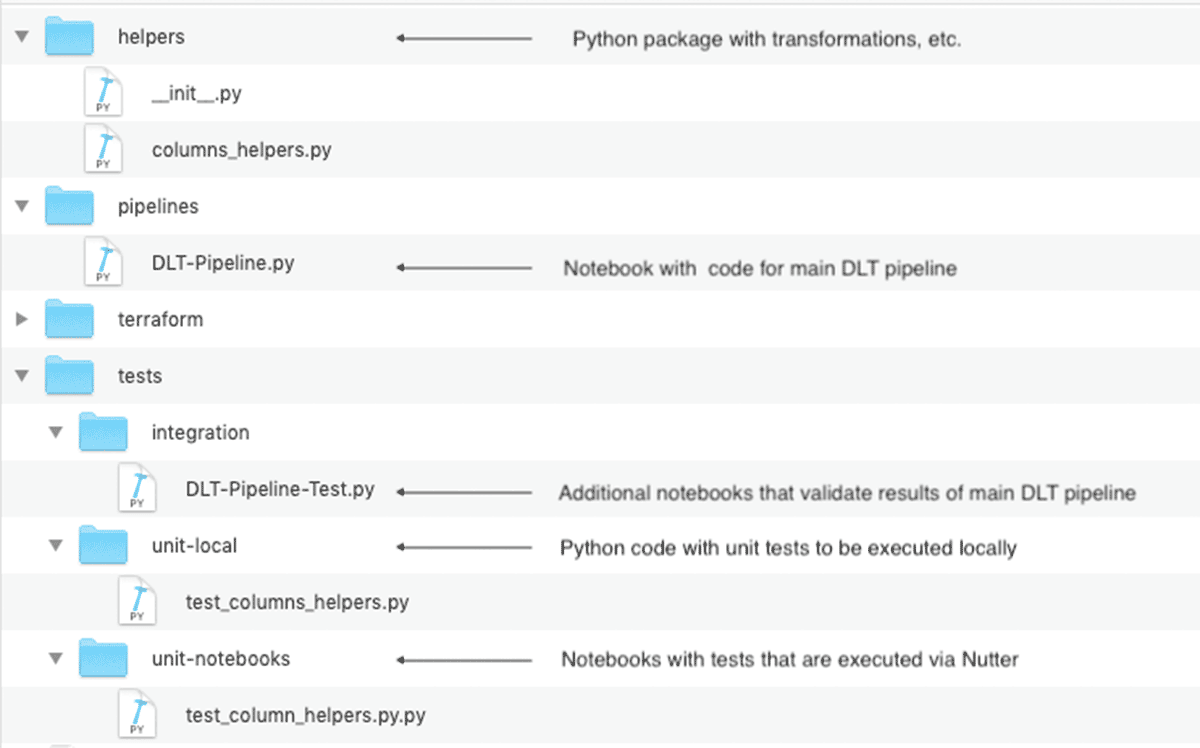
This code structure is especially important for bigger projects that may consist of the multiple DLT pipelines sharing the common transformations.
Gartner®: Databricks Cloud Database Leader

Implementing unit tests
As mentioned above, splitting transformations into a separate Python module allows us easier write unit tests that will check behavior of the individual functions. We have a choice of how we can implement these unit tests:
- we can define them as Python files that could be executed locally, for example, using pytest. This approach has following advantages:
- we can develop & test these transformations using the IDE, and for example, sync the local code with Databricks repo using the Databricks extension for Visual Studio Code or dbx sync command if you use another IDE.
- such tests could be executed inside the CI/CD build pipeline without need to use Databricks resources (although it may depend if some Databricks-specific functionality is used or the code could be executed with PySpark).
- we have access to more development related tools - static code & code coverage analysis, code refactoring tools, interactive debugging, etc.
- we can even package our Python code as a library, and attach to multiple projects.
- we can define them in the notebooks - with this approach:
- we can get feedback faster as we always can run sample code & tests interactively.
- we can use additional tools like Nutter to trigger execution of notebooks from the CI/CD build pipeline (or from the local machine) and collect results for reporting.
The demo repository contains a sample code for both of these approaches - for local execution of the tests, and executing tests as notebooks. The CI pipeline shows both approaches.
Please note that both of these approaches are applicable only to the Python code - if you’re implementing your DLT pipelines using SQL, then you need to follow the approach described in the next section.
Implementing integration tests
While unit tests give us assurance that individual transformations are working as they should, we still need to make sure that the whole pipeline also works. Usually this is implemented as an integration test that runs the whole pipeline, but usually it’s executed on the smaller amount of data, and we need to validate execution results. With Delta Live Tables, there are multiple ways to implement integration tests:
- Implement it as a Databricks Workflow with multiple tasks - similarly what is typically done for non-DLT code.
- Use DLT expectations to check pipeline’s results.
Implementing integration tests with Databricks Workflows
In this case we can implement integration tests with Databricks Workflows with multiple tasks (we can even pass data, such as, data location, etc. between tasks using task values). Typically such a workflow consists of the following tasks:
- Setup data for DLT pipeline.
- Execute pipeline on this data.
- Perform validation of produced results.

The main drawback of this approach is that it requires writing quite a significant amount of the auxiliary code for setup and validation tasks, plus it requires additional compute resources to execute the setup and validation tasks.
Use DLT expectations to implement integration tests
We can implement integration tests for DLT by expanding the DLT pipeline with additional DLT tables that will apply DLT expectations to data using the fail operator to fail the pipeline if results don't match to provided expectations. It's very easy to implement - just create a separate DLT pipeline that will include additional notebook(s) that define DLT tables with expectations attached to them.
For example, to check that silver table includes only allowed data in the type column we can add following DLT table and attach expectations to it:
Resulting DLT pipeline for integration test may look as following (we have two additional tables in the execution graph that check that data is valid):

This is the recommended approach to performing integration testing of DLT pipelines. With this approach, we don’t need any additional compute resources - everything is executed in the same DLT pipeline, so get cluster reuse, all data is logged into the DLT pipeline’s event log that we can use for reporting, etc.
Please refer to DLT documentation for more examples of using DLT expectations for advanced validations, such as, checking uniqueness of rows, checking presence of specific rows in the results, etc. We can also build libraries of DLT expectations as shared Python modules for reuse between different DLT pipelines.
Promoting the DLT assets between environments
When we’re talking about promotion of changes in the context of DLT, we’re talking about multiple assets:
- Source code that defines transformations in the pipeline.
- Settings for a specific Delta Live Tables pipeline.
The simplest way to promote the code is to use Databricks Repos to work with the code stored in the Git repository. Besides keeping your code versioned, Databricks Repos allows you to easily propagate the code changes to other environments using the Repos REST API or Databricks CLI.
From the beginning, DLT separates code from the pipeline configuration to make it easier to promote between stages by allowing to specify the schemas, data locations, etc. So we can define a separate DLT configuration for each stage that will use the same code, while allowing you to store data in different locations, use different cluster sizes,etc.
To define pipeline settings we can use Delta Live Tables REST API or Databricks CLI’s pipelines command, but it becomes difficult in case you need to use instance pools, cluster policies, or other dependencies. In this case the more flexible alternative is Databricks Terraform Provider’s databricks_pipeline resource that allows easier handling of dependencies to other resources, and we can use Terraform modules to modularize the Terraform code to make it reusable. The provided code repository contains examples of the Terraform code for deploying the DLT pipelines into the multiple environments.
Putting everything together to form a CI/CD pipeline
After we implemented all the individual parts, it's relatively easy to implement a CI/CD pipeline. GitHub repository includes a build pipeline for Azure DevOps (other systems could be supported as well - the differences are usually in the file structure). This pipeline has two stages to show ability to execute different sets of tests depending on the specific event:
- onPush is executed on push to any Git branch except releases branch and version tags. This stage only runs & reports unit tests results (both local & notebooks).
- onRelease is executed only on commits to the releases branch, and in addition to the unit tests it will execute a DLT pipeline with integration test.
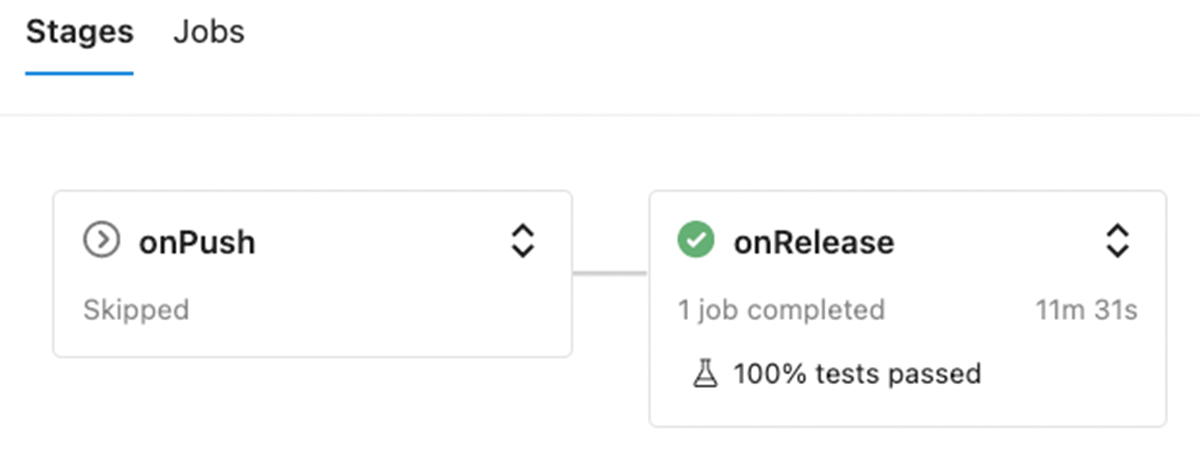
Except for the execution of the integration test in the onRelease stage, the structure of both stages is the same - it consists of following steps:
- Checkout the branch with changes.
- Set up environment - install Poetry which is used for managing Python environment management, and installation of required dependencies.
- Update Databricks Repos in the staging environment.
- Execute local unit tests using the PySpark.
- Execute the unit tests implemented as Databricks notebooks using Nutter.
- For
releasesbranch, execute integration tests. - Collect test results & publish them to Azure DevOps.
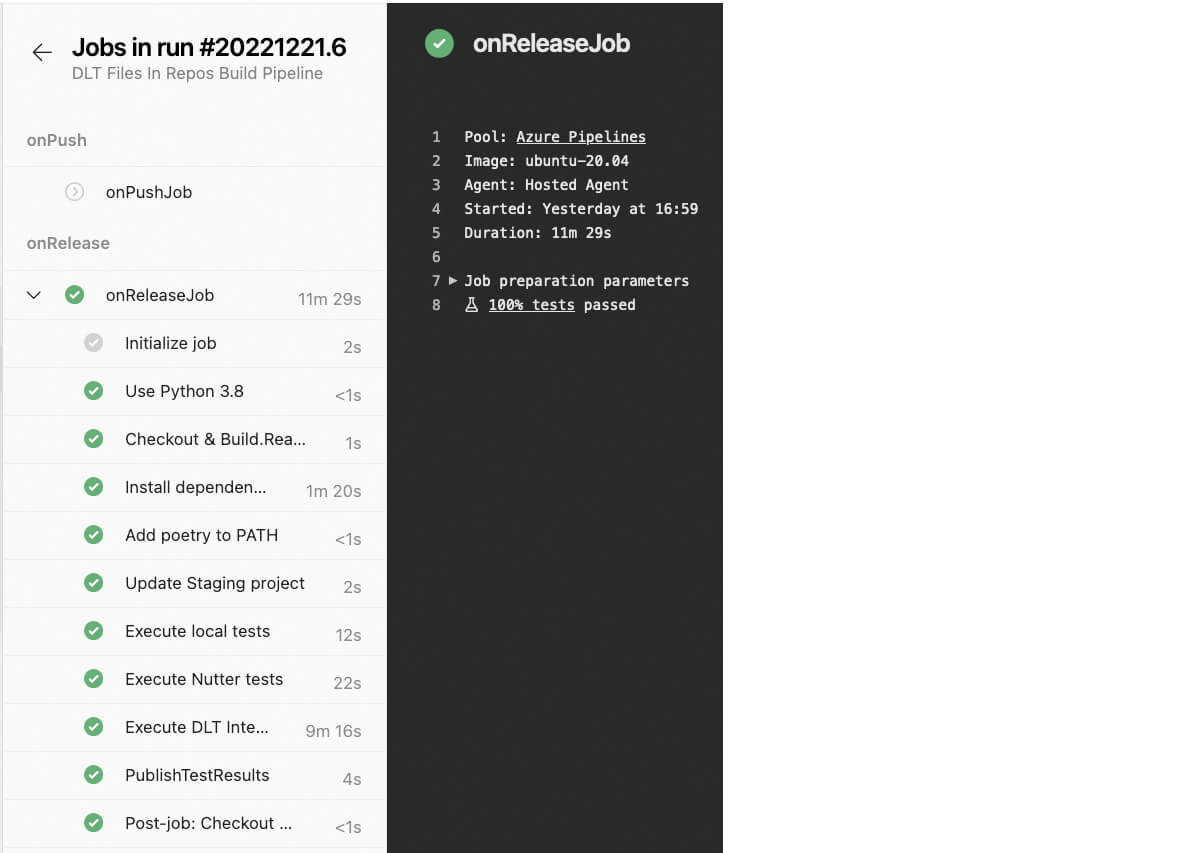
Results of tests execution are reported back to the Azure DevOps, so we can track them:
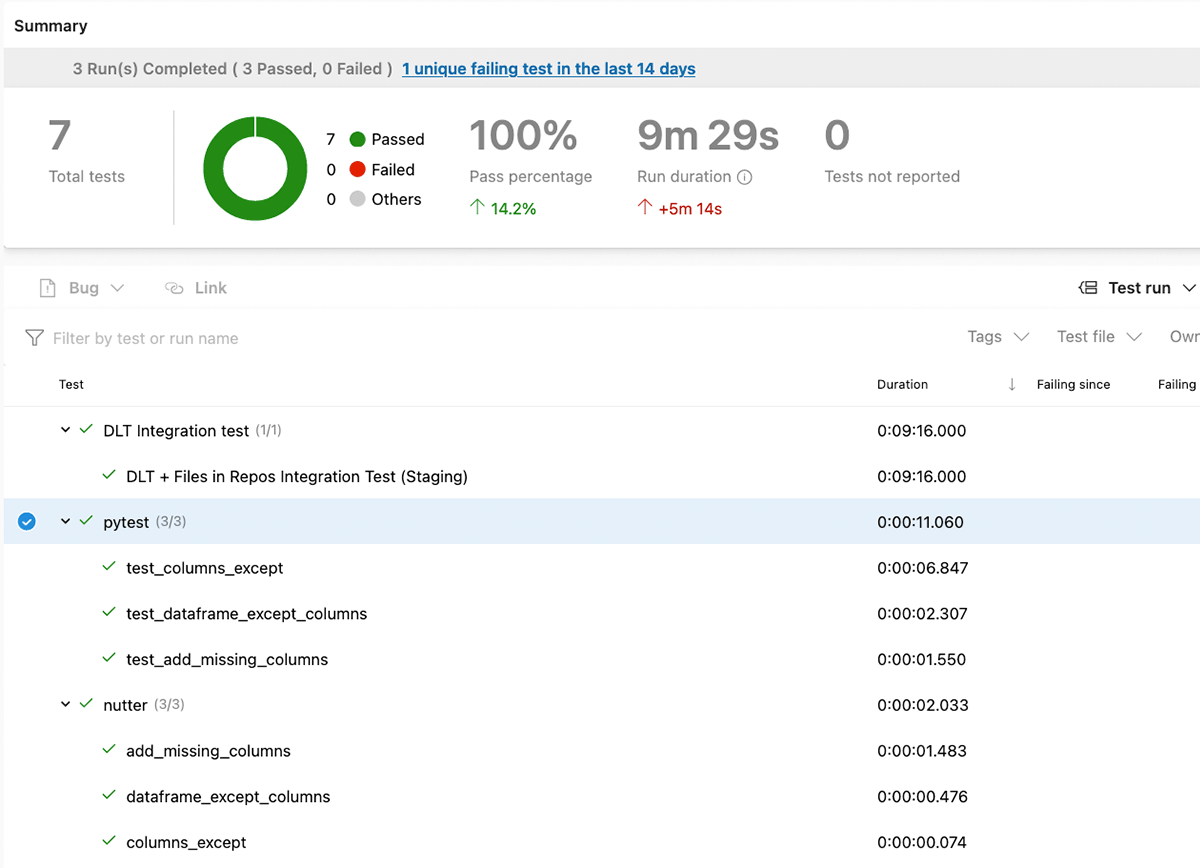
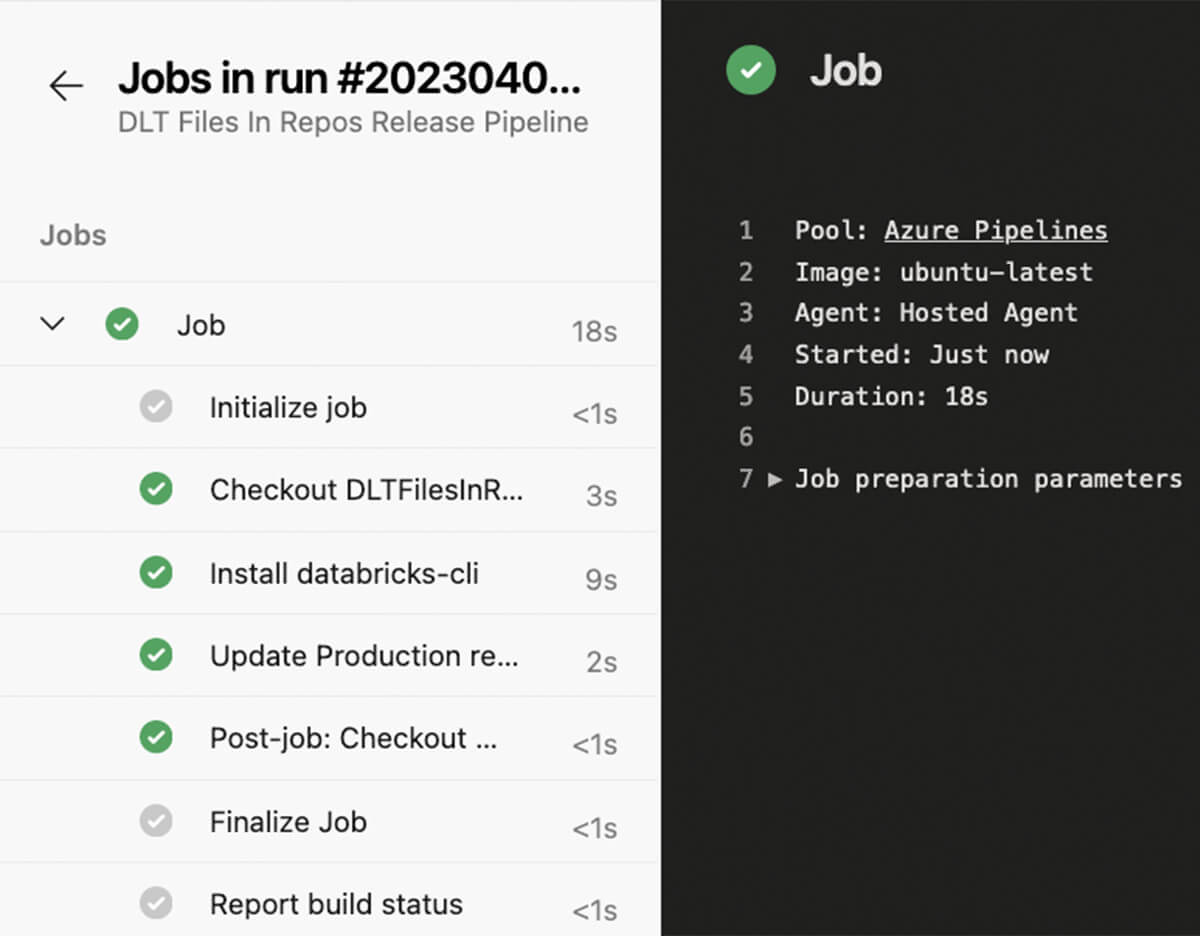
If commits were done to the releases branch and all tests were successful, the release pipeline could be triggered, updating the production Databricks repo, so changes in the code will be taken into account on the next run of DLT pipeline.
Try to apply approaches described in this blog post to your Delta Live Table pipelines! The provided demo repository contains all necessary code together with setup instructions and Terraform code for deployment of everything to Azure DevOps.