Building a Cybersecurity Lakehouse for CrowdStrike Falcon Events Part III
Converting Insights into Actions

Published: December 16, 2022
by Alex Ott, Aemro Amare and Kristin Waters
In Part I of this series, we walked through the process of setting up a Cybersecurity Lakehouse that allowed us to collect and operationalize CrowdStrike Falcon log data. In Part II we explored sample use cases, including exploratory analysis, data enrichment, and analytic development. In this installment, we will deep dive into engineering-specific threat detections in near real-time and how to create alerts on multiple messaging channels.
As with Parts I and II, we will investigate a set of CrowdStrike Falcon logs collected from enterprise network endpoints over several weeks. Sensitive details have been masked due to security and confidentiality reasons.
Databricks and scalable cybersecurity analytics
Cybersecurity event logs are large and complex (dozens to hundreds of data sources, ingesting from 10s Gbs to hundreds of Tbs per day, keeping data for years), with the volume of these data sets increasing exponentially as organizations scale. What's more, these logs are almost never analyzed in isolation. Security teams often include additional correlated data sets, such endpoint logs, network logs, user behavior analytics, enrichment data, external threat intelligence, etc. The ability to quickly extract information from these massive, complex sources is imperative for successful threat detection and incident response operations. Quick threat detection and remediation for defensive operations is key to minimizing dwell time and mitigating malicious activity.
CrowdStrike Falcon logs can grow fast to many petabytes. Parsing these logs and making them queryable is not trivial due to the size and the variation of schemas within the same dataset. Some security use cases need data enrichment to get the most from these logs. Running detection algorithms without proper alerting and monitoring tools would delay taking action. For faster and more effective detection algorithm development, engineers should be equipped with tools to collaborate, test their work and verify production readiness.
Many "traditional" security tools struggle to support the volume, velocity, and complexity of these data sets, so some large enterprise security teams have begun to use scalable distributed systems such as Apache Spark™, as seen in these and these examples. At its heart, Apache Spark™ is an open source distributed processing engine that can scale horizontally to process tasks on very large data sets. It is the most popular open source distributed processing framework in the world. It comes packaged with higher-level libraries to support SQL queries, streaming data, machine learning, and graph processing.
Databricks notebooks allow you to work with peers across teams in multiple languages (R, Python, SQL and Scala) and libraries with easy operational scalability. It also has all the required capabilities for full detection engineering - from development to production. It has built-in workflow management for complex orchestration, alert and dashboarding capabilities for detections, and Unity Catalog for fine-grained access control. It is also easy to integrate with technologies commonly used by Cyber security engineers.
Monitoring for vulnerable services
In Part II, we examined an approach to identifying potentially vulnerable services executing within our environment. As a refresher, services that implement vulnerable versions of applications such as Microsoft Remote Desktop Protocol (RDP), Citrix services, etc. are often targeted by attackers. Because early detection is critical to preventing compromise, we will want to monitor for and flag devices that start these services. We especially want to be on the lookout for when these services are executed on unknown devices - this may indicate that an endpoint device may not be sufficiently patched.
This detection is very straightforward to implement with Spark Structured Streaming. Streaming provides near real-time visibility into events (such as the execution of a vulnerable service on a non-approved device).
In the context of our Crowdstrike data set, we need to perform the following operations:
- Consume NetworkListen events for both IPv4 & IPv6 protocols
- Identify events related to the vulnerable services
- Filter out "known" devices
We implement this using a one-to-one translation of the detection logic. In this simple example, we have implemented the logic using Spark code for demonstration purposes. An alternate, more scalable implementation based on Delta Live Tables is demonstrated in this example notebook.
The first step is to extract data from the corresponding source tables (NetworkListenIP4 & NetworkListenIP6):
We can now work with the extracted events as a stream. If we intend to use the data in downstream applications, we can write it to Kafka or to a Delta table or even set up alerts to a monitoring system using the foreachBatch function. We can also push data into a Splunk instance. As an example, let's push data into a Delta table for further analysis:
Logins from "New" locations
Tracking user login location enables the detection of unauthorized login attempts or login attempts using stolen credentials (often obtained from phishing or hacking activities). "Location" in this context may refer to either a network location or a geographic location. In this scenario, we will assume that most users will access company resources from the same set of networks. We will also assume that people are primarily working in the same physical office with the exception of business trips or related activities.
We will monitor user login attempts over time and raise an alert when there is login from an unrecognized location. To implement this alerting system, we need to enrich logon data with additional information - the autonomous systems number associated with their IP address and the corresponding geographical information. For this, we leveraged MaxMind's GeoIP2 databases. This information allows us to come up with a simple algorithm to detect logins from new locations:
- For each user, compile a list of network login locations that have been previously used
- When a user logs in, check whether the network location was used before
- If yes, update user login timestamp, network location, and physical location
- If network location was not used before, generate an alert
The code for this solution is relatively straightforward - we're using structured streaming to process all data since the previous run (Trigger.AvailableNow), but the same code could be used to perform detections in real-time. We use the Delta Change Feed functionality to detect new locations and generate alerts.
First, we need to create the logon_locations table, which maintains the information on login locations for each user. The schema of the table is as follows:
This table will be populated by the following code:
To implement the alerting functionality, we read change feed data from the table with locations and leave only entries corresponding to inserts:
Matching indicators of compromise
A common application of cybersecurity analytics is in the matching of Indicators of Compromise (IoCs), or forensic artifacts that indicate malicious or unauthorized behavior. IoCs come in many forms - file hashes, IP addresses, URLs, host & domain names, etc. In order to normalize and more easily share this information, the security community developed a number of data formats for IoCs exchange. This means that we can easily incorporate this information into our detection pipelines.
For this example, we're using information from multiple sources (AlienVault OTX, abuseurl/abusemalware from Abuse.ch, Malware Bazaar, among others) using the Threat intel module of Elastic's filebeat. This data comes through the Azure Event Hubs, is processed by a dedicated Delta Live Tables pipeline, and made available as a separate table to be used by our detection logic.
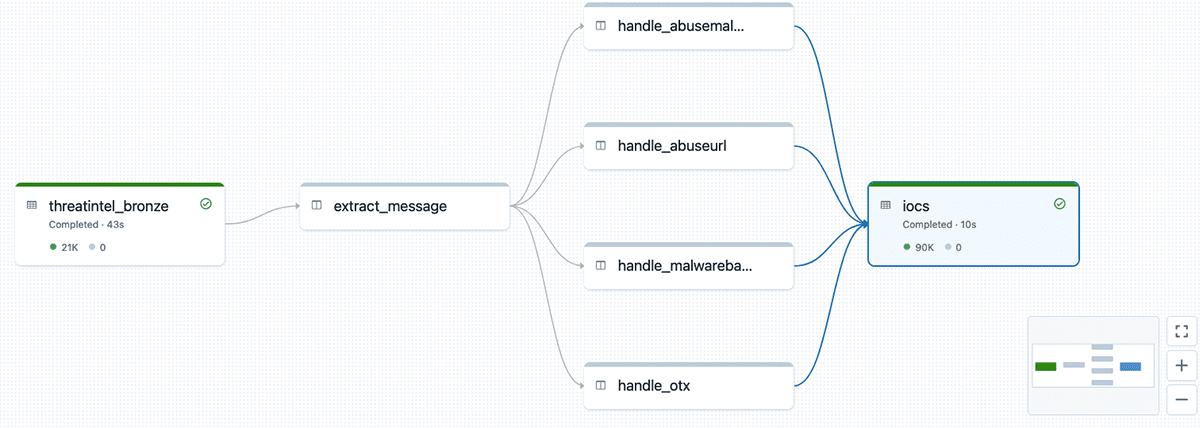
We will also use Delta Live Tables (DLT) for the implementation of our detection pipeline. DLT allows us to engineer workflows with multiple tables and data sources easily without spending too much time on the selection of the correct node sizes, etc.
Like in most organizations, our Crowdstrike logs are very diverse; we have an array of different tables with data fields we'd like to compare against known IoCs. There are also multiple columns that we need to check. Consider, for example, that oftentimes there will be multiple hashes calculated for the same file. We need to check all possible hashes against the IoCs in the threat exchange because we don't know which version of the file hash may have been reported. The same holds true for other fields, including hostname and domain name.
The complexity of these logs means that we cannot possibly write individual DLT functions by hand. But, we can generate them. Let's start by defining a mapping between tables and the corresponding columns needed for IoC detection purposes. We'll also need to define a set of columns that are common across all tables.
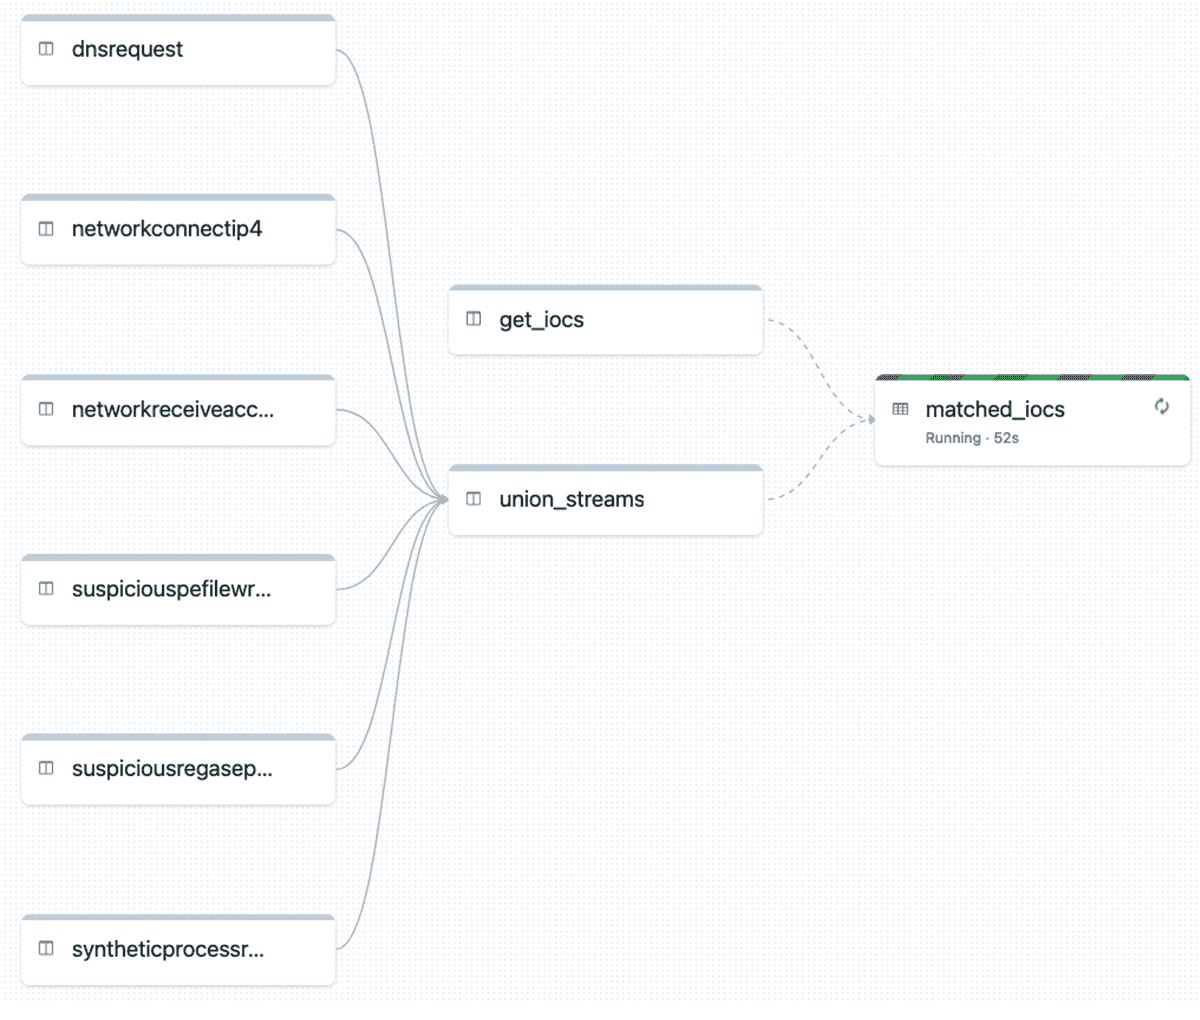
Now we can use our mapping to programmatically generate functions to be used as nodes in the DLT graph - each function will read from the corresponding source table, and generate individual rows for each IoC type defined in our mapping:
After we define the source nodes, we need to union them together so that we avoid the need to join each table separately. We're also dropping duplicates as the same data may come from the multiple tables:
The final step is to join our Crowdstrike data with existing IoCs - we're loading that data from the cyber.iocs table. As result of the join, we're getting only the records that are matching to the known IoCs. This data is stored into the matched_iocs table, from which we can do other things, such as reporting, sending notifications, etc.
When we execute this pipeline we are presented with the DLT execution graph. This implementation could be easily extended to handle more data sources by just adding them to the mapping.
Alert notification
Alerts consist of Triggers and Actions. In the previous section we have seen how to generate cyber security triggers that generate alerts and write them in a delta table. A follow-on Action might be to send an email or text notification, or even calling PagerDuty to create an incident ticket. It is also possible to publish alert messages on a Kafka or Event Hub so that different consumer groups can consume messages based on their interest.
Integrating an analytics platform with different notification channels can be quite complex or might need expensive proprietary software. Databricks platform has out of the box integration with the most popular alert destinations. Alerts might need a real-time response before your system is impacted or intellectual property lost. Below we present a few examples of how to integrate multiple alerting notification systems for a faster threat remediation.
Slack
Slack is a messaging program used by many organizations. By using the slack webhook connector it is possible to publish the generator alerts on a slack channel. To do this, we first must create a slack incoming webhook.
It is possible to add filters and aggregate similar events to reduce cluttering (especially important in a production environment). With the above function definitions we can start publishing alerts on a slack channel via streaming or in batch mode. We can trigger the stream with the following code:
Azure Event Hubs
It is also possible to publish alerts so that different consumer groups in the organization can subscribe to read, filter and respond based on their job requirements. To test the following code, an Event Hubs needs to be created to get a bootstrap server(s) and a connection string.
Using the above kafka options we can simply start streaming jobs. If we want to check alerts every interval, we can processingTime set as shown in this code.
What's next?
In this blog we demonstrated how you can leverage the Databricks Lakehouse Platform to build scalable threat detection. We performed a deep-dive into the creation of actionable threat intelligence to manage vulnerabilities and provide faster, near-real-time incident response using CrowdStrike Falcon Data. In our next installment, we will take this analysis a step even further with the application of machine learning and MLflow. Stay tuned!
We have also provided some sample notebooks that you can import into your own Databricks workspace. Each section of the notebooks has a detailed description of the code and functionality. We invite you to email us at [email protected]. We look forward to your questions and suggestions for making this notebook easier to understand and deploy.
If you are new to Databricks, please refer to this documentation for detailed instructions on how to use Databricks notebooks.

